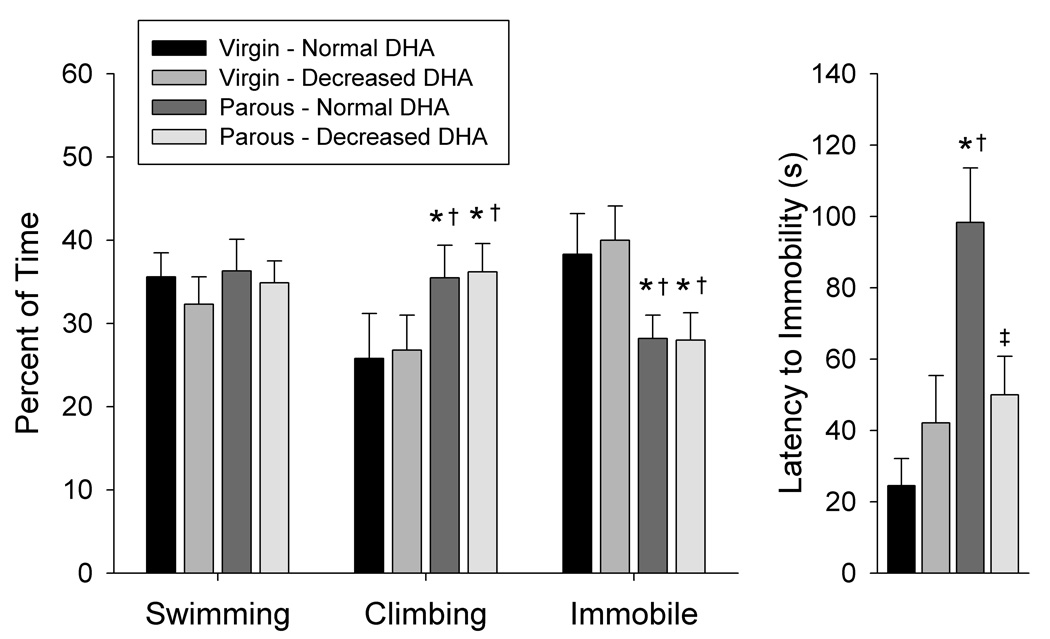
Figure 3. Effects of brain DHA status and reproductive status on behavioral response in the forced swim test.
Data are presented as the mean ± SEM (n = 12–14 per group). *Different from Virgin – Normal DHA (P < 0.05). †Different from Virgin – Decreased DHA (P < 0.05). ‡Different from Parous – Normal DHA (P < 0.05).

