

Abstract
Using data on clinical practices for outpatients 5 years and older, test accuracy, and malaria prevalence, we model financial and clinical implications of malaria rapid diagnostic tests (RDTs) under the new artemether-lumefantrine (AL) treatment policy in one high and one low malaria prevalence district in Kenya. In the high transmission district, RDTs as actually used would improve malaria treatment (61% less over-treatment but 8% more under-treatment) and lower costs (21% less). Nonetheless, the majority of patients with malaria would not be correctly treated with AL. In the low transmission district, especially because the treatment policy was new and AL was not widely used, RDTs as actually used would yield a minor reduction in under-treatment errors (36% less but the base is small) with 41% higher costs. In both districts, adherence to revised clinical practices with RDTs has the potential to further decrease treatment errors with acceptable costs.
INTRODUCTION
Effective treatment using artemisinin-based combination therapy (ACT) is one of the recent, key strategies for combating malaria in sub-Saharan Africa.1 As of 2007, 39 African countries have changed policies to ACTs, with 22 of these countries, including Kenya, selecting highly efficacious but relatively expensive artemether-lumefantrine (AL) as the first-line treatment of uncomplicated malaria.2 In most settings across Africa, laboratory support to diagnose malaria is not available and presumptive treatment resulted in wide-scale over-diagnosis in the pre-ACT era.3 The advent of malaria rapid diagnostic tests (RDTs) has been seen as a potential solution to increase testing capacities and overcome the problem of malaria over-diagnosis and associated over-treatment under new ACT policies.4
Existing studies have modeled the effects of RDTs on costs, malaria diagnosis, and health outcomes under ACT policies.5-7 Potential impacts of RDTs were positive in most African settings, except in areas of very high malaria transmission. A key assumption in these studies is that clinicians follow recommended clinical practice. Yet under operational conditions in sub-Saharan Africa, deviations from malaria guidelines are common because: 1) tests are insufficiently used8; 2) negative test results are frequently ignored8-11; and 3) non-recommended antimalarial drugs are commonly prescribed.12-14 Furthermore, the accuracy of RDTs might be lower in the hands of health workers. As a result, actual clinical and laboratory practice may compromise the potential benefits of RDTs.
Adapting our previous model of costs and treatment errors,15 the objective of this paper is to examine from the provider's perspective the financial and clinical implications of using RDTs in the malaria case-management of older children and adults under operational conditions observed in Kenya in areas of different malaria transmission. To develop realistic parameters for this analysis, we use data on the accuracy of routine malaria tests (RDTs and microscopy) and actual clinical practices for patients 5 years and older observed during our initial trial undertaken in two districts of different malaria endemicities in Kenya.16 Throughout the remainder of this paper, patient is used to denote an outpatient above 5 years of age.
METHODS
Description of initial trial
The study areas and study design of the initial trial are presented in detail elsewhere.16 Briefly, the randomized controlled trial with pre-post measurement was undertaken in 30 government facilities in Bondo/Siaya districts (intense, hyper–holoendemic malaria transmission) and 30 facilities in Kericho district (low, hypoendemic, seasonal malaria transmission). The trial tested the accuracy of RDTs under operational conditions and effects of malaria RDTs on health workers' adherence to malaria guidelines for outpatients. After an initial baseline survey, 30 intervention facilities received RDTs (Paracheck device, Orchid Diagnostics, India), in-service training, copies of guidelines, and a supervisory visit. Thirty control facilities received the same intervention but did not receive RDTs. AL was already available in the facilities as part of the national roll-out of the new malaria policy. Health facility surveys were used to collect data at baseline (pre-intervention) and at a 6-week post-intervention follow up. The health facility surveys used a range of quality of care methods, including an exit assessment of fever (defined as history of fever in past 48 hours and/or axillary temperature ≥ 37.5°C) and a review of patient records for routine requests for diagnostic tests, reported results, and medications prescribed.
After the consultation, each patient had a reference malaria blood slide performed by study staff, which provided the gold standard for evaluating the results of RDT and microscopy results completed by health workers.17 Throughout this analysis, a malaria case is defined as parasitemia on blood smear detected by the reference microscopist. Kenyan clinical guidelines do not include parasitemia thresholds, and malaria RDTs also do not provide such information. Thus, although this definition may be conservative in high malaria risk areas where parasitemia is not necessarily cause of malaria disease, the definition is the policy-relevant definition for malaria case management in Kenya.
Scenarios modeled and evaluated by district
We organize our analysis as the evaluation of three clinical practice scenarios for each area of malaria transmission intensity (district). Scenario S0 models outpatient costs and treatment outcomes based on actual clinical practice observed prior to provision of RDTs. This baseline scenario provides a benchmark from which the other two scenarios are evaluated. Scenario S1 models costs and outcomes based on actual clinical practice and RDT accuracy in the intervention sites after the introduction of RDTs. Scenario S2 models a revised clinical practice scenario for AL use in outpatients at facilities where microscopy and/or RDTs are available. In this scenario, malaria tests are performed for all febrile patients, no tests are performed for non-febrile patients, all patients with a routine test result reported as positive are prescribed AL, and all patients with a routine negative test result are not prescribed any antimalarial. We provide further details on these scenarios below.
Determination of initial model parameter values
In our interventional study, malaria prevalence at baseline among all outpatients was different from prevalence observed during the post-intervention follow up due to seasonal variations. For example, in the high transmission district of Bondo/Siaya, prevalence among outpatients was 26% at baseline but 12% at the post-intervention follow up. Prevalence in Kericho however was very low in both periods—only 1.5% at baseline and 0% at the post-intervention follow up. To provide a comparable evaluation of the clinical practices modeled in scenarios 1 and 2, we base our analysis on the gold-standard malaria prevalence and proportion of febrile patients observed at baseline (i.e., modeled in S0). Any changes in costs or treatment errors between S0, S1, and S2 can, as a result, be attributed to changes in clinical practice and RDTs.
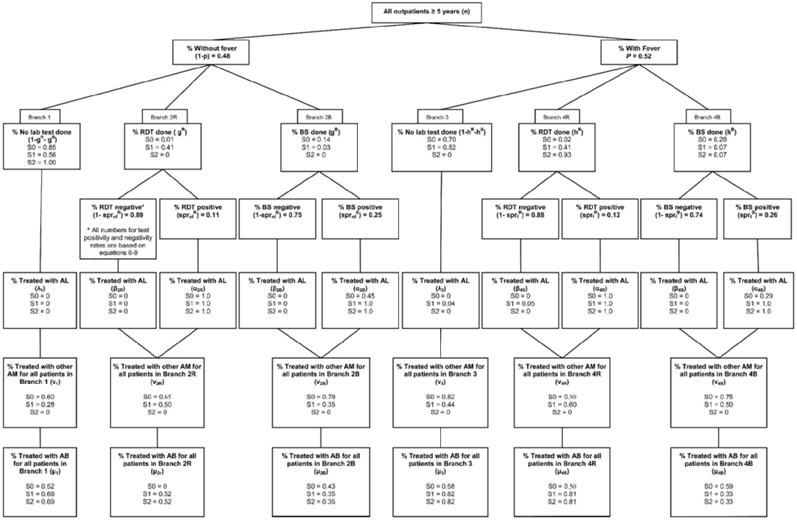
All notation and assumptions used for this analysis are provided in Figure 1, Figure 2, and Table 1. Parameter values used in each scenario are summarized as six main treatment branches in Figure 1 for Bondo/Siaya and Figure 2 for Kericho. All clinical practice information in Figures 1 and 2 for S0 and S1 are based on actual behavior observed during the interventional study, whereas information for S2 is based on revised clinical practices for each scenario.
Figure 1.

Clinical process scenarios* for outpatients 5 years and older in Bondo/Siaya districts (high malaria transmission area). * In each box variable is defined, notation for the variable and parameter assumptions are specified, and values in decimal points for each of 3 scenarios are presented. RDT = rapid diagnostic test; BS = blood slide; AL = artemether-lumefantrine; AM = antimalarial (other than artemether-lumefantrine); AB = antibiotic.
Figure 2.
Clinical process scenarios* for outpatients 5 years and older in Kericho district (low malaria transmission area). * In each box variable is defined, notation for the variable and parameter assumptions are specified and values in decimal points for each of 3 scenarios are presented.
Table 1.
Additional parameter values and assumptions for both districts
| Description | District | Bondo/Siaya | Kericho |
|---|---|---|---|
| Constant for all scenarios | Notation | ||
| Cost of AL per patient* | CAL | $1.61 | $1.61 |
| Cost of other antimalarials per patient† | CAM | $0.37 | $0.37 |
| Cost of antibiotics per patient† | CAB | $0.35 | $0.35 |
| Cost of RDT per patient‡ | CR | $0.65 | $0.65 |
| Cost of blood slide per patient§ | CB | $0.40 | $0.40 |
| Sensitivity of RDTs | SENR | 0.85 | 0.85 |
| Specificity of RDTs | SPECR | 0.90 | 0.90 |
| Sensitivity of BS | SENB | 0.57 | 0.57 |
| Specificity of BS | SPECB | 0.75 | 0.75 |
| Malaria prevalence among non-febrile patients¶ | sprnfE | 0.11 | 0.01 |
| Malaria prevalence among febrile patients¶ | sprfE | 0.33 | 0.02 |
Based on the WHO agreement with the supplier of AL, the instrument that Kenyan Ministry of Health uses to procure the drug; the costs were averaged based on the weight distribution of patients in our initial study.16
Based on the cost that Kenyan Ministry of Health pays for other antimalarials and antibiotics; the costs were calculated based on the distribution of prescription of these drugs in our initial study.16
Based on the cost of Paracheck rapid diagnostic test (Orchid Biomedical Systems, India) used in our initial study.16
Gross provider cost per malaria slide that includes costs of microscope, supplies, training, staff time, supervision, and overhead for laboratories.5
Based on identification of parasitemia on the blood smear by the study microscopist.
AL = artemether-lumefantrine; RDT = rapid diagnostic test; BS = blood slide.
In both figures, Branch 1 is for outpatients presenting without a fever who do not have an RDT or blood slide performed, branch 2R is for outpatients presenting without a fever who have an RDT performed, and branch 2B is for outpatients presenting without a fever who have a blood slide performed. Branch 3 is for outpatients presenting with a fever who do not have an RDT or blood slide performed, branch 4R is for outpatients presenting with a fever who have an RDT performed, and branch 4B is for outpatients presenting with a fever who have a blood slide performed.
Four issues are important to highlight in Figures 1 and 2. First, after the introduction of RDTs (scenario S1), a large number of febrile patients in both settings remained untested, whereas a substantial number of afebrile patients were tested. Second, in Figure 1, a significant number of patients were tested positive were not prescribed AL (15% of RDT positives in branch 4R and 38% of blood slide positives in branch 4B). However, respecting of test results in Figure 1 for Scenario S1 is 100%. Third, adherence to negative test results was better than positive results for febrile patients (10% of RDT negatives prescribed AL in branch 4R and 3% of blood slide negatives in branch 4B), although 28% of the afebrile patients with a negative RDT were still prescribed AL. And fourth, the sensitivity and specificity of RDTs observed in operational conditions (85% and 90% respectively) was high compared with microscopy (57% and 75% respectively).
We can use the basic framework provided in Figure 1 and Figure 2 to estimate the financial costs to a health care facility (costs of tests, AL, and other medicines) and treatment errors based on the three scenarios outlined above. For costs, our accounting stance is that of a typical government health facility, and we assume initially that the health facility bears the financial costs of RDTs, microscopy, AL, other antimalarials, and other medicines prescribed (antibiotics). Our objective here is to model costs and outcomes under operational conditions when AL exists in health facilities (S0) and when AL and RDTs exist (S1), and when AL and RDTs exist and clinicians follow revised clinical practices (S2).
Scenario S2 shows what could be achieved with AL and RDTs if health workers would adhere to revised malaria clinical practice. Two additional assumptions incorporated into S2 must be mentioned here. First, among all febrile outpatients in Bondo/Siaya in the post-intervention follow up (S1), a blood test was performed for 17% of outpatients (branch 4B), 33% received an RDT (branch 4R), and 50% received no test (branch 3). We assume that all of the patients managed in branch 3 during S1 would receive an RDT in S2 (now managed in branch 4R). And second, due to this shift, we assume that these adults would also be prescribed antibiotics at the same rate observed in this branch in S1 (68% were prescribed antibiotics in S1). The same assumptions hold for the Kericho analysis. We do not suggest that such use of antibiotics is appropriate clinical practice, but acknowledge that such practices are likely to continue if RDTs are available. Results are broken down by major cost components, so that the importance of antibiotic costs in total costs for each scenario can be easily evaluated.
The test sensitivities and specificities reported in Table 1 and used in this analysis are within the range of results obtained under operational conditions in other studies,9-11,18-21 although there is some substantial variation reported in the literature, especially for microscopy. For this analysis, the test sensitivities and specificities reported in Table 1 are for all patients (febrile and afebrile). The sensitivity of RDTs and microscopy may be lower in afebrile parasitemic patients; however, our previous study used to estimate RDT accuracy under operational conditions in Kenya17 was not designed to address this issue and to date no other studies from Kenya provide such information under operational conditions. The model developed in this paper can be easily adjusted to incorporate such information if and when better data become available.
Modeling expected costs and AL treatment errors
The model developed for this analysis is a direct extension of the decision-tree framework developed previously15 that allows for RDTs and microscopy as diagnostic tools as well as the prescription of other antimalarials (not AL) when AL is not prescribed. Because expected costs and AL treatment errors are simple multiples of the number of outpatients, we based our analysis in terms of 1,000 outpatients presenting to a health facility. A complete presentation of the model is provided in the supplemental appendix (appendix may be found online at www.ajtmh.org).
As a brief overview, expected costs per 1,000 outpatients are simply the weighted sum of the costs associated with managing outpatients in each of the six branches in Figure 1 or Figure 2, where the weights are the proportion of the outpatients managed in each branch. The costs per branch include the costs of tests (RDTs or microscopy as relevant) and the costs of drugs (AL, other antimalarials, and antibiotics). These costs in turn depend on actual malaria prevalence in febrile and non-febrile patients, the sensitivity and specificity of RDTs and microscopy, and health worker decisions related to test results and prescribing of other antimalarials and antibiotics (see Figures 1 and 2). Equations 1-9 in the appendix provide all details for the costing analysis.
Although this model is consistent with other recent analyses of malaria RDTs,22 the model developed here includes several operationally relevant issues needed to evaluate the implications of malaria RDTs, including that: 1) the management of afebrile patients must be included in the analysis; 2) afebrile patients may be tested whereas febrile patients may not; 3) the level of adherence to positive and negative test results for afebrile and febrile patients may differ; 4) the prescription of other non-recommended antimalarials may continue to exist after the introduction of AL and prescription rates may differ by branches in Figure 1 and 2; and 5) prescription rates of antibiotics may also differ substantially across treatment branches.
We also note that expected costs are linear in unit costs (AL, RDTs, blood slides, other AM, and antibiotics). With total costs and cost categories provided in the results (Table 2), a reader can easily evaluate how expected costs would change if any of the unit costs changed. For example, if the unit cost of microscopy was 50% less, then microscopy costs would fall by 50%, and then the change in overall costs can be easily computed.
Table 2.
Model results for each scenario (per 1,000 outpatients 5 years and older) by district
| Bondo/Siaya district (high malaria transmission area) |
Scenarios |
|||
|---|---|---|---|---|
| Expected number with malaria | 262 | S0* | S1† | S2‡ |
| Costs | $1044 | $822 | $1031 | |
| AL | $541 | $290 | $388 | |
| RDTs | $0 | $178 | $372 | |
| Blood slides | $119 | $58 | $47 | |
| Other antimalarials | $189 | $75 | $0 | |
| Antibiotics | $195 | $220 | $224 | |
| Number over-treated | 236 | 92 | 58 | |
| Number under-treated | 161 | 174 | 79 | |
| Kericho district (low malaria transmission area) | ||||
| Expected number with malaria | 15 | S0* | S1† | S2‡ |
| Costs | $582 | $823 | $691 | |
| AL | $33 | $127 | $105 | |
| RDTs | $10 | $267 | $314 | |
| Blood slides | $85 | $20 | $15 | |
| Other antimalarials | $264 | $164 | $0 | |
| Antibiotics | $190 | $245 | $257 | |
| Number over-treated | 19 | 73 | 56 | |
| Number under-treated | 14 | 9 | 7 | |
Behavior based on actual practice observed prior to introduction of RDTs.
Behavior based on actual practice observed after intervention to provide RDTs.
Behavior based on revised practice with RDTs (see text for details).
AL = artemether-lumefantrine; RDT =rapid diagnostic test.
Besides costs, however, the clear policy goal is to treat with malaria correctly with AL. Two types of AL treatment errors are possible. First, errors from over-treatment with AL occur because some patients who are prescribed AL do not have malaria. Second, errors from under-treatment with AL occur because patients who are not prescribed AL do have malaria. Throughout the remainder of this presentation, we use the term over-treatment error explicitly to mean an outpatient treated with AL who does not have malaria. We use the term under-treatment error to mean that an outpatient with malaria is not treated with AL.
All details needed to calculate AL treatment errors are provided in the appendix. In brief, errors from over-treatment with AL depend on the true malaria prevalence in febrile and non-febrile adults, the numbers of outpatients managed in the six branches, the sensitivity and specificity of RDTs and microscopy, and the health worker decisions. For example, over-treatment errors in Branch 3 for S0 and S1 (febrile adults not tested) depend simply on the proportion prescribed AL and malaria prevalence in this group (as measure by the slide positivity rate of expert microscopy for patients with fever). For the other branches such as 4B and 4R, however, the number of outpatients over-treated with AL depends on the number treated with routine positive and negative tests (RDTs or blood slides done by health workers) combined with the probability that those treated with negative or positive tests do not have malaria, which in turn depends on health worker decisions and the sensitivity and specificity of tests used. Similar logic is used for the calculation of errors from under-treatment with AL. Complete details are provided in the appendix, equations 10-23.
Ethical considerations
Approval for this study was obtained from the ethical review committee of the Kenya Medical Research Institute (KEMRI) (reference number 1057) and the Centers for Disease Control and Prevention (CDC), Atlanta, Georgia. Written informed consent was collected from all health workers, adult patients, and from the parents or legal guardians of minors.
RESULTS
Results are presented separately for each area of malaria transmission intensity.
Expected costs and treatment errors per 1,000 outpatients (≥ 5 years) for Bondo/Siaya (high malaria transmission area)
For the distribution of febrile patients, background prevalence, and other assumptions provided in Figure 1 and Table 1, the expected costs of scenario S0 based on equations 1-9 would be $1,044 per 1,000 outpatients. For scenario S1, which is based on actual practice with RDTs observed in the intervention sites (Figure 1), costs would fall substantially to $822 per 1,000 outpatients (21% less). Over-treatment errors would also fall substantially (from 236 per 1,000 outpatients for S0 to 92 per 1,000 outpatients for S1), although under-treatment errors would increase (from 161 per 1,000 outpatients for S0 to 174 per 1,000 outpatients for S1).
The distribution of costs across the scenarios S0 and S1 also changes markedly. As shown in Table 2, AL costs would fall by $251 per 1,000 outpatients, whereas RDT costs would increase from $0 to $178 per 1,000 outpatients. Thus, the AL costs savings from using RDTs more than compensated for the additional costs of RDTs used. With the introduction of RDTs, fewer blood slides would be performed, and fewer other antimalarials would be prescribed. This reduction in costs of other antimalarials, from $189 to $75 per 1,000 outpatients, shows that 308 per 1,000 outpatients would no longer be prescribed these medicines. Antibiotic costs would rise somewhat (from $195 to $220 per 1,000 outpatients), indicating that more antibiotics would be prescribed to compensate for fewer AL and other antimalarial prescriptions. We do not suggest that such antibiotic treatment practices are optimal; rather, this analysis acknowledges the empirical fact that additional use of antibiotics may be used to substitute for reduced treatment with AL.
Regarding under-treatment errors, however, both S0 and S1 would still miss the majority of patients with malaria (38% and 34% correctly treated respectively). Clinical practice with RDTs under operational conditions (S1) performs poorly on this outcome because a large number of patients presenting with fever would still not be tested (i.e., patients in branch 3). Specifically, 58% of all under-treatment errors (102 per 1,000 outpatients) would occur in branch 3. The remaining errors would be distributed across branches 1, 4R, and 4B (25, 20, and 25 per 1,000 outpatients respectively).
As analyzed in Scenario S2, however, a substantial reduction in under-treatment and over-treatment errors could be achieved if health workers changed clinical practice as modeled in scenario S2. In scenario S2, patients without fever receive no test and are not prescribed AL, all patients with fever are tested, all patients with positive tests are prescribed AL, and no patients are prescribed other antimalarials. Comparing S2 to S1, over-treatment errors would fall to 58 per 1,000 outpatients, under-treatment errors would fall to 79 per 1,000 outpatients, and costs would increase to $1031 per 1,000 outpatients. Compared with S1, costs would increase because more tests are completed and more AL is prescribed, but AL is prescribed more precisely with substantial reductions in both over-treatment and under-treatment errors.
Expected costs and treatment errors per 1,000 outpatients (≥ 5 years) for Kericho (low malaria transmission area)
For the distribution of febrile patients, background prevalence, and initial parameter assumptions provided in Figure 2 and Table 1, the expected costs of the baseline scenario S0 based on equations 1-9 would be $582 per 1,000 outpatients above 5 years of age. Relatively few patients would actually be treated with AL, reflecting the very low malaria prevalence, but scenario S0 is especially poor at treating patients correctly who have malaria. While only 15 of 1,000 outpatients had malaria, only 1 per 1,000 outpatients with malaria would be correctly prescribed AL. The other 14 per 1,000 outpatients with malaria (93% of all malaria patients) would not be treated with AL.
For scenario S1, based on actual practice with RDTs observed in the intervention sites, costs would increase substantially to $823 per 1,000 outpatients, over-treatment errors would increase to 73 per 1,000 outpatients, and under-treatment errors would fall to 9 per 1,000 outpatients (i.e., 40% of malaria patients treated with AL). Revised practice analyzed as scenario S2, as compared with S1, would reduce costs to $691 per 1,000 outpatients, reduce over-treatment errors to 56 per 1,000 outpatients, and reduce under-treatment errors to 7 per 1,000 outpatients. These seven under-treatment errors remain in S2 because of the small but positive number of non-febrile outpatients with malaria parasitemia.
DISCUSSION
This modeling analysis, based on actual clinical practices observed in Kenyan health facilities after implementation of the new AL treatment policy, suggests different implications for the introduction of RDTs on costs and AL treatment errors depending on the intensity of malaria transmission.
Implications of RDT introduction in the high malaria transmission area
Bondo/Siaya district is an area of intense, perennial malaria transmission with some seasonal variations where community Plasmodium falciparum prevalence rates above 50% are commonly reported in the childhood population.23 Under such conditions, repeated infections from birth results in the acquisition of a functional clinical immunity during early childhood and the risks of severe complications and fatal outcomes in older children and adults are rare.24 In such areas of high transmission, malaria diagnostic strategies in older children and adults should focus on the reduction of over-treatment errors and associated costs given acceptable changes in under-treatment errors.
The results presented in Table 2 for S0 and S1 show that RDTs, even if used in far from optimal conditions, could nevertheless reduce overall treatment costs (a net cost savings of $222 per 1,000 outpatients, a 21% reduction) and reduce substantially over-treatment errors (144 fewer per 1,000 outpatients, a 61% reduction). The trade off would be an increase in under-treatment errors (13 additional under-treatment errors per 1,000 outpatients). In high transmission areas, this tradeoff is acceptable.
Nevertheless, under operational use observed in Bondo/Siaya after the introduction of RDTs, only one third of malaria patients would actually be treated with AL. Essentially all patients who did not have a routine malaria test performed would be missed. In this patient group, health workers used a clinical judgment to rule out malaria and did not perform a diagnostic test. Past studies have repeatedly demonstrated low sensitivity of various clinical signs and symptoms to detect malaria in febrile adults.25,26 These studies concluded that parasitological diagnosis in febrile adults is the only reliable solution to confirm or rule out malaria. Yet, case management guidelines are rarely explicit in recommending malaria testing for all febrile adult patients.1 In Kenya, the national malaria guideline recommends testing in absence of any other obvious cause of fever; however, it does not specify what signs and symptoms present an alternative explanation of fever.27 Pending further evidence-based symptom algorithms, testing all febrile older children and adults with subsequent treatment of all positive test results with AL should be promoted practice to decrease under-treatment errors. As modeled as S2 scenario, this approach would lead to significant reductions in both over-treatment and under-treatment errors.
Implications of RDT introduction in the low malaria transmission area
Kericho district is an area of low, acutely seasonal malaria transmission prone to epidemics that reemerged in the Kenyan highlands from the early 1990s.28 At baseline, malaria prevalence was only 1.5% among all patients above 5 years of age (or 15 per 1,000 outpatients). In areas of very low transmission, parasite exposure is infrequent and clinical immunity develops slowly and may always be incomplete against severe disease and death.24,29,30 Arguably, in such areas the rationale for effective diagnosis includes the necessity to detect and treat accurately all clinical infections while maintaining an acceptable trade-off against malaria over-treatment and associated costs.
Our key finding for Kericho under operational conditions is that AL treatment practices without RDTs would perform especially poorly; only 1 of the 15 outpatients (per 1,000) with malaria would be correctly treated with AL (Table 2). Regardless of the very low prevalence of the disease in Kericho, the current diagnostic strategy with such a low sensitivity (7%) cannot be promoted. The introduction of RDTs under actual clinical practices, however, would increase costs but reduce under-treatment errors from 14 to 9. Two additional under-treatment errors could be avoided if health workers test all febrile patients and treat all positive patients with AL (scenario S2). The cost of the revised practice scenario (S2) would be $691 per 1,000 patients, of which RDTs and other antibiotics comprise the majority. Overall, S2 is only somewhat more expensive than current unacceptable practices without RDTs ($582 for S0).
Although far from perfect, the introduction of RDTs in Kericho given AL is the first-line policy, is still an important step forward to reduce the number of under-treatment errors in populations exposed to higher risk of malaria consequences. Furthermore, delivery of effective AL treatment to patients who need it in Kericho has broader public health consequences because such epidemic-prone areas with marginal transmission are also appropriate places to examine the impact of ACTs on interruption of malaria transmission and prevention of malaria epidemics.28,31 This potential can only be explored if recommended treatments reach patients with malaria.
In Kericho, the increase in costs and over-treatment errors associated with the introduction of RDTs (comparing scenario S0 to S1) should be cautiously interpreted. During our baseline survey prior to the introduction of RDTs, we expected more frequent use of AL in treating fevers. Overall AL use in this district was rare (only 20 per 1,000 outpatients), of which 19 per 1,000 were over-treatment error, and overall costs were modest ($582 per 1,000 outpatients). Other, non-recommended antimalarials, however, were widely prescribed.
Under-use of AL has been identified as a problem during early evaluations after AL implementation in Kenya and Zambia in the absence of RDTs.12,14 The follow-up evaluation in Zambia showed that the frequency of AL prescriptions increased over two years, and this increase coincided with the expansion of RDT capacities.8,13 Similar changes in Kenya in the future would inevitably change current over-treatment and cost relations related to the presence of RDTs in our study.
Finally, an important reason why over-treatment errors would still occur in Kericho, even following the best clinical practices, is the imperfect accuracy of routine testing. Even though the prevalence of malaria was only 1.5% at baseline, routine test positivity rates for febrile patients for RDTs and microscopy are still 12% and 26% respectively because test sensitivities and specificities are less than 100%. Therefore, without improved accuracy of diagnostic tests (and in particular microscopy), further reductions in these errors are unlikely to be achieved in very low transmission areas.
CONCLUSION
In areas of high malaria transmission, the results of this analysis are encouraging and support a policy of expanding the use of RDTs to support the roll-out of AL as the first-line malaria drug in Kenya. The clinical behavior actually observed in the study health facilities, although not yet optimal, could yield substantial cost savings and overall improvements in malaria treatment. The benefits of RDTs are less obvious in areas of low malaria transmission. In such areas, the current treatment practice in absence of RDTs was exceedingly poor (7% of malaria patients correctly treated with AL). The introduction of RDTs combined with significant improvements in health worker behavior could reduce these errors. Although this modeling analysis does not address what potential interventions would be needed to improve behavior (e.g., training, supervision, strengthening of drug and RDT supplies, additional personnel) and the costs of such interventions, this paper, however, provides better information on their potential impacts if successful.
Acknowledgments
The authors thank all health workers, patients, and parents of sick children who participated in the initial study. Robert W. Snow is supported by the Wellcome Trust as Principal Research Fellow (#079081). The authors thank David Hamer for comments on the paper. This paper is published with the permission of the director of KEMRI.
Financial support: This study received financial support from USAID, The Wellcome Trust, UK, and the Kenya Medical Research Institute.
APPENDIX–MODELING EXPECTED COSTS AND AL TREATMENT ERRORS
The model of expected costs and AL treatment errors presented here is a direct extension of the decision-tree framework developed previously by our group15 that allows for both RDT and microscopy as diagnostic tools as well as the prescription of other antimalarials (not AL) when AL is not prescribed.
Modeling Expected Costs
Using the basic six-branch framework for describing clinical practice from Figure 1 and Figure 2, expected costs are:
| (1) |
where costs C in equation (1) include the cost of RDTs, blood slides, AL, AM and AB, i = 1, 2R, 2B, 3, 4R, 4B, are the six treatment branches, pi are the probabilities for each branch (percentage of patients managed in each branch). Using the notation in Figures 1 and 2, the branch probabilities are: p1 = (1 − p)(1 − gR − gB); p2R = (1 − p)gR; p2B = (1 − p)gB; p3 = (1 − p)(1 − hR − hB); p4R = (1 − p)hR; and p4B = (1 − p)hB.
Costs Ci for branches 1 and 3 are simply:
| (2) |
λi is the proportion of patients treated with AL, μi is the proportion of patients treated with antibiotics; and νi is the proportion of patients treated with other antimalarials.
For outpatients receiving either an RDT or blood slide (branches 2B, 2R, 4B, and 4R), costs are:
| (3) |
where
| (4) |
and
| (5) |
For branches 2B, 2R, 4B, and 4R, costs include the additional costs of either RDTs or blood slides, whereas the proportion of outpatients prescribed AL (λik) is now a function of the slide positivity rate ( for branches 2B and 2R and for branches 4B and 4R), the proportion of negative tests that are ignored (βik), and the percentage of positive tests that are respected (αik).
To complete the costing model, the final pieces of information required are the routine test positivity rates for blood slides and RDTs for febrile and non-febrile outpatients (, , and ). In general, test positivity rates depend on the true malaria prevalence in the population presenting with and without fever ( for non-febrile patients and for febrile patients) and the sensitivity and specificity of the tests (SENR, SPECR for RDTs and SENB, SPECB for microscopy).
For reference, these routine test positivity rates for RDTs and blood slides without and with fever are calculated as:
| (6) |
| (7) |
| (8) |
| (9) |
Modeling AL Treatment Errors
Errors from AL over-treatment occur because some patients who are prescribed AL do not have malaria, whereas errors from AL under-treatment occur because patients who are not prescribed AL do have malaria. For any number of older children and adult outpatients, n, presenting to a health facility, let E(no) represent the expected number over-treated with AL and E(nu) represent the expected number under-treated with AL.
The expected number of older children and adults over-treated with AL is:
| (10) |
where pi are the branch probabilities, and are the number in each branch treated with AL who do not have malaria, where:
| (11) |
| (12) |
| (13) |
| (14) |
AL over-treatment errors for Branch 1 from equation (11) depend on the number of older children and adults treated with AL, nλ1, and the slide positivity rate of expert microscopy for patients without fever . AL over-treatment errors for Branch 3 from equation (12) depend on the number of older children and adults treated with AL, nλ3, and the slide positivity rate of expert microscopy for patients with fever . The assumption here is that the expert slide positivity rate for patients without and with fever is a best estimate of ‘true’ malaria, so on average percent of older children and adults in Branch 1 do not have malaria and percent of older children and adults in Branch 3 do not have malaria.
For the other branches, however, the number of older children and adults over-treated depends on the number treated with AL who have routine positive and negative tests (RDTs or blood slides) combined with the probability that those treated with negative or positive tests do not have malaria. For example, from equation (13), shows the percentage of non-febrile patients with routine negative tests (either RDT or blood slide) who are treated with AL. The negative predictive value, , shows the percentage of routine negative tests that were also evaluated as negative by expert microscopy. Thus, shows the number of non-febrile patients with routine negative tests who are treated with AL but do not have malaria. Similarly, shows the number of non-febrile patients with routine positive tests who are treated with AL but do not have malaria. In sum, the term in square brackets in equation (13) shows the probability of an AL over-treatment error for Branch 2R and 2B respectively. The interpretation of equation (14) follows the same logic.
To complete the above analysis of AL over-treatment errors, we need to estimate positive and negative predictive values (PPV and NPV) for microscopy and RDTs for patients with and without fever. For k = B or R, PPV and NPV for febrile and non-febrile patients can be calculated as:
| (15) |
| (16) |
| (17) |
| (18) |
Following similar logic, the expected number of patients under-treated with AL for malaria is estimated as:
| (19) |
where
| (20) |
| (21) |
and
| (22) |
| (23) |
The model for expected costs and expected AL treatment errors, as outlined in equations 1-23, can be estimated for any set of assumptions for the basic parameters outlined in Figures 1 and 2 and Table 1.
Footnotes
A supplemental appendix “Modeling expected costs and AL treatment errors” appears online at www.ajtmh.org.
REFERENCES
- 1.World Health Organization . Guidelines for the Treatment of Malaria. World Health Organization; Geneva: 2006. [Google Scholar]
- 2.Olumese P. Global Antimalarial Drug Policy Database. Antimalarial treatment policies for P. falciparum and P. vivax by country in WHO Africa and Eastern Mediterranian region. 2007. [April 2007 Update]. Available at: http://www.who.int/malaria/treatmentpolicies.html. Accessed August 28, 2007.
- 3.Amexo M, Tolhurst R, Barnish G, Bates I. Malaria misdiagnosis: effects on the poor and vulnerable. Lancet. 2004;364:1896–1898. doi: 10.1016/S0140-6736(04)17446-1. [DOI] [PubMed] [Google Scholar]
- 4.Bell DC, Wongsrichanalai C, Barnwell JW. Ensuring quality and access for malaria diagnosis: how can it be achieved? Nat Rev Microbiol. 2006;4(Suppl 9):7–20. doi: 10.1038/nrmicro1474. [DOI] [PubMed] [Google Scholar]
- 5.Goodman C. The Economic Evaluation of Malaria Diagnosis; Working Paper Prepared for Informal Consultation on “Malaria diagnostics at the turn of the century,” organized by WHO and USAID; Geneva. 25–27 October 1999.1999. [Google Scholar]
- 6.Rafael ME, Taylor T, Magill A, Lim JW, Girosi F, Allan R. Reducing the burden of childhood malaria in Africa: the role of improved diagnostics. Nature. 2006;S1:39–48. doi: 10.1038/nature05445. [DOI] [PubMed] [Google Scholar]
- 7.Shillcutt S, Morel S, Goodman C, Coleman P, Bell D, Whitty CJM, Mills A. Cost-effectiveness of malaria diagnostic methods in sub-Saharan Africa in an era of combination therapy. Bull World Health Organ. 2008;86:101–110. doi: 10.2471/BLT.07.042259. [DOI] [PMC free article] [PubMed] [Google Scholar]
- 8.Hamer DH, Ndhlovu M, Zurovac D, Fox M, Yeboah-Antwi K, Chanda P, Sipilinyambe N, Simon JL, Snow RW. Improved diagnostic testing and malaria treatment practices in Zambia. JAMA. 2007;297:2227–2231. doi: 10.1001/jama.297.20.2227. [DOI] [PMC free article] [PubMed] [Google Scholar]
- 9.Barat LM, Chippa J, Kolczak M, Sukwa T. Does the availability of blood slide microscopy for malaria at health centers improve the management of persons with fever in Zambia? Am J Trop Med Hyg. 1999;60:1024–1030. doi: 10.4269/ajtmh.1999.60.1024. [DOI] [PubMed] [Google Scholar]
- 10.Zurovac D, Midia B, Ochola SA, English M, Snow RW. Microscopy and outpatient malaria case management among older children and adults in Kenya. Trop Med Int Health. 2006;11:432–440. doi: 10.1111/j.1365-3156.2006.01587.x. [DOI] [PubMed] [Google Scholar]
- 11.Reyburn H, Mbakilwa H, Mwangi R, Mwerinde O, Olomi R, Drakeley C, Whitty CJM. Rapid diagnostic tests compared with malaria microscopy for guiding outpatient treatment of febrile illness in Tanzania: randomised trial. BMJ. 2007;334:403. doi: 10.1136/bmj.39073.496829.AE. [DOI] [PMC free article] [PubMed] [Google Scholar]
- 12.Zurovac D, Ndhlovu M, Rowe AK, Hamer DH, Thea DM, Snow RW. Treatment of paediatric malaria during a period of drug transition to artemether-lumefantrine in Zambia: cross sectional study. BMJ. 2005;33:734–737. doi: 10.1136/bmj.331.7519.734. [DOI] [PMC free article] [PubMed] [Google Scholar]
- 13.Zurovac D, Ndhlovu M, Sipilanyambe N, Chanda P, Hamer DH, Simon JL, Snow RW. Paediatric malaria case-management with artemether-lumefantrine in Zambia: a repeat cross-sectional study. Malaria J. 2007;6:31. doi: 10.1186/1475-2875-6-31. [DOI] [PMC free article] [PubMed] [Google Scholar]
- 14.Zurovac D, Ngigi J, Akhwale W, Hamer DH, Snow RW. Translation of artemether-lumefantrine treatment policy into paediatric clinical practice: an early experience from Kenya. Trop Med Int Health. 2008;13:99–107. doi: 10.1111/j.1365-3156.2007.01980.x. [DOI] [PMC free article] [PubMed] [Google Scholar]
- 15.Zurovac D, Larson BA, Akhwale W, Snow RW. The financial and clinical implications of adult malaria diagnosis using microscopy in Kenya. Trop Med Int Health. 2006;11:1185–1194. doi: 10.1111/j.1365-3156.2006.01674.x. [DOI] [PubMed] [Google Scholar]
- 16.Skarbinski J, Ouma P, Causer P, Kariuki S, Barnwell J, de Oliveira AM, Zurovac D, Larson B, Snow RW, Rowe AK, Laserson K, Akhwale W, Slutsker L, Hamel M. Introduction of malaria rapid diagnostic tests, new guidelines, and artemether-lumefantrine in Kenya: a cluster randomized trial. Submitted. [PubMed] [Google Scholar]
- 17.de Oliveira AM, Skarbinski J, Ouma P, Kariuki S, Barnwell J, Otieno K, Onyona P, Causer L, Laserson K, Akhwale W, Slutsker L, Hamel M. Malaria rapid diagnostic test use and performance by facility based health workers in western Kenya; Proceedings of the 56th annual meeting of the American Society of Tropical Medicine and Hygiene; Philadelphia, USA. 4–8 November 2007; 2007. Abstract 338. [Google Scholar]
- 18.Reyburn H, Ruanda J, Mwerinde O, Drakeley C. The contribution of microscopy to targeting antimalarial treatment in a low transmission area of Tanzania. Malar J. 2006;5:4. doi: 10.1186/1475-2875-5-4. [DOI] [PMC free article] [PubMed] [Google Scholar]
- 19.Stow NW, Torrens JK, Walker J. An assessment of the accuracy of clinical diagnosis, local microscopy and a rapid immunochromatographic card test in comparison with expert microscopy in the diagnosis of malaria in rural Kenya. Trans R Soc Trop Med Hyg. 1999;93:519–520. doi: 10.1016/s0035-9203(99)90359-0. [DOI] [PubMed] [Google Scholar]
- 20.Bell D, Go R, Miguel C, Walker J, Cacal L, Saul A. Diagnosis of malaria in a remote area of the Philippines: comparison of techniques and their acceptance by health workers and the community. Bull World Health Organ. 2001;79:933–941. [PMC free article] [PubMed] [Google Scholar]
- 21.Mayxay M, Newton PN, Yeung S, Pongvongsa T, Phompida S, Phetsouvanh R, White NJ. An assessment of the use of malaria rapid tests by village health volunteers in rural Laos. Trop Med Int Health. 2004;9:325–329. doi: 10.1111/j.1365-3156.2004.01199.x. [DOI] [PubMed] [Google Scholar]
- 22.Lubell YH, Reyburn H, Mbakilwa H, Mwangi R, Chonya S, Whitty CJM, Mills A. The impact of response to the results of diagnostic tests for malaria: cost-benefit analysis. BMJ. 2008;336:202–205. doi: 10.1136/bmj.39395.696065.47. [DOI] [PMC free article] [PubMed] [Google Scholar]
- 23.Bloland PB, Boriga DA, Ruebush TK, McCormick JB, Roberts JM, Oloo AJ, Hawley W, Lal A, Nahlen B. Longitudinal cohort study of the epidemiology of malaria infections in an area of intense malaria transmission II. Descriptive epidemiology of malaria infection and disease among children. Am J Trop Med Hyg. 1999;60:641–648. doi: 10.4269/ajtmh.1999.60.641. [DOI] [PubMed] [Google Scholar]
- 24.Snow RW, Marsh K. New insights into the epidemiology of malaria relevant for disease control. Br Med Bull. 1998;54:293–309. doi: 10.1093/oxfordjournals.bmb.a011689. [DOI] [PubMed] [Google Scholar]
- 25.Chandramohan D, Carneiro I, Kavishwar A, Brugha R, Desai V, Greenwood BM. A clinical algorithm for the diagnosis of malaria: results of an evaluation in an area of low endemicity. Trop Med Int Health. 2001;6:505–510. doi: 10.1046/j.1365-3156.2001.00739.x. [DOI] [PubMed] [Google Scholar]
- 26.Mwangi TW, Mohammed M, Dayo H, Snow RW, Marsh K. Clinical algorithms for malaria diagnosis lack utility among people of different age groups. Trop Med Int Health. 2005;10:530–536. doi: 10.1111/j.1365-3156.2005.01439.x. [DOI] [PMC free article] [PubMed] [Google Scholar]
- 27.Ministry of Health . National Guidelines for Diagnosis, Treatment & Prevention of Malaria for Health Workers. Republic of Kenya; Nairobi: 2006. [Google Scholar]
- 28.Shanks GD, Hay SI, Omumbo JA, Snow RW. Malaria in Kenya's western highlands. Emerg Infect Dis. 2005;11:1425–1432. doi: 10.3201/eid1109.041131. [DOI] [PMC free article] [PubMed] [Google Scholar]
- 29.Reyburn H, Mbatia R, Drakeley C, Bruce J, Carneiro I, Olomi R, Cox J, Nkya WMMM, Lemnge M, Greenwood BM, Riley EM. Association of transmission intensity and age with clinical manifestations and case fatality of severe Plasmodium falciparum malaria. JAMA. 2005;293:1461–1470. doi: 10.1001/jama.293.12.1461. [DOI] [PubMed] [Google Scholar]
- 30.Idro R, Bitarakwate E, Tumwesigire S, John CC. Clinical manifestations of severe malaria in the highlands of southwestern Uganda. Am J Trop Med Hyg. 2005;72:561–567. [PubMed] [Google Scholar]
- 31.Nosten F, Brasseur P. Combination therapy for malaria: the way forward? Drugs. 2002;62:1315–1329. doi: 10.2165/00003495-200262090-00003. [DOI] [PubMed] [Google Scholar]