

Abstract
The plainfin midshipman fish, Porichthys notatus, is a vocal species of teleost fish that generates acoustic signals for intraspecific communication during social and reproductive behaviors. All adult morphs (females and males) produce single short duration grunts important for agonistic encounters, but only nesting males produce trains of grunts and growls in agonistic contexts and long duration multiharmonic advertisement calls to attract gravid females for spawning. The midshipman fish uses the saccule as the main acoustic endorgan for hearing to detect and locate vocalizing conspecifics. Here, I examined the response properties of evoked potentials from the midshipman saccule to determine the frequency response and auditory threshold sensitivity of saccular hair cells to behaviorally-relevant single tone stimuli. Saccular potentials were recorded from the rostral, medial and caudal regions of the saccule while sound was presented by an underwater speaker. Saccular potentials of the midshipman, like other teleosts, were evoked greatest at a frequency that was twice the stimulus frequency. Results indicate that midshipman saccular hair cells of non-reproductive adults had a peak frequency sensitivity that ranged from 75 (lowest frequency tested) to 145 Hz and were best suited to detect the low frequency components (≤105 Hz) of midshipman vocalizations.
Keywords: Auditory evoked potentials, Tuning, Hair cells, Hearing, Saccule
Introduction
Acoustic communication plays an important role in the social and reproductive behaviors of vocal teleost fishes in the Family Batrachoididae (midshipman and toad fishes). The reproductive success of nocturnally active batrachoidids is often greatly dependent on the detection and localization of the conspecific vocal signals that are produced during intraspecific social communication. A number of investigations have characterized the vocal-acoustic behaviors and neurobiology of these fishes establishing both the midshipman and the toadfish as important models for identifying mechanisms of auditory reception, neural encoding, and vocal production shared by all vertebrates (Bass et al. 1999; Fay and Simmons 1999; Bass and McKibben 2003).
One species of midshipman fish that has been the subject of intensive neuroethological investigation with regard to acoustic communication is the plainfin midshipman Porichthys notatus. This vocalizing species of midshipman generates acoustic signals for intraspecific communication during social and reproductive behaviors. All adult morphs (females and males: types I and II) produce single short duration grunts important for agonistic encounters. However, only type I nesting males produce trains of grunts and growls in agonistic contexts and long duration (>1 min) multiharmonic advertisement (mate) calls, known as “hums”, to attract reproductively active females to their nests (Bass et al. 1999). Females use the auditory sense to detect and locate vocalizing males that produce the multiharmonic hums during the breeding season.
Recent work shows that the frequency sensitivity of auditory primary afferents that innervate the inner ear’s saccule, the main organ of hearing in midshipman, changes seasonally with female reproductive state such that summer reproductive females become better suited than winter non-reproductive females to encode the higher harmonic components of the male’s hum (Sisneros and Bass 2003). Approximately 1 month before the beginning of the summer spawning season, females show peaks in circulating plasma levels of testosterone and 17β-estradiol (Sisneros et al. 2004a), which are now known to induce the female’s reproductive auditory phenotype and enhance their sensitivity to the dominant higher harmonic components of the male’s advertisement call (Sisneros et al. 2004b). In addition, midshipman-specific estrogen receptor alpha has been identified in the saccule’s sensory epithelium which now provides support for a direct steroid effect on the inner ear (Sisneros et al. 2004b). Thus, a prime candidate site where this novel form of steroid-dependent auditory plasticity may occur is at the level of the saccular hair cell receptor.
A first step in the neurophysiological investigation of midshipman auditory hair cells is to determine the response properties of hair cells in the saccule. Toward this end, the focus of this study was to determine the frequency response properties of evoked potentials from hair cells in the saccule of the midshipman fish. Numerous studies have used the evoked potential recording technique to determine the sensitivity and response dynamics of inner ear hair cells in teleost fishes (Piper 1906; Adrian et al. 1938; Zotterman 1943; Furukawa and Ishii 1967; Furukawa et al. 1972). This recording technique was originally used in the plainfin midshipman to establish that the saccule was the main organ of hearing in this species (Cohen and Winn 1967). Among teleost fish in general, saccular potentials are easily identified because they are evoked at twice the auditory stimulus frequency due to the presence of nonlinear and opposite oriented hair cell populations in the fish saccule (Hama 1969; Furukawa and Ishii 1967; Fay 1974; Fay and Popper 1974). This double frequency effect of the evoked potentials was first reported for the lateral line organ of the ruff (Acerina cernua) where the two groups of opposite oriented hair cells produce two evoked potentials during every stimulus cycle (Jielof et al. 1952; Flock 1965; Wersall and Flock 1965). In contrast to auditory end organs, the mammalian cochlea and the crista ampullaris have hair cells that are oriented in the same direction and hence have potentials that are evoked at the same auditory stimulus frequency (de Vries and Bleeker 1949; Tasaki et al. 1954).
The main goal of this study was to characterize the evoked potentials from the inner ear saccule of the plainfin midshipman fish and determine the auditory threshold sensitivity, dynamic range and frequency response of midshipman saccular hair cells to behaviorally relevant single tone stimuli. In this study, I focus on the saccular potentials of non-reproductive fish to establish baseline data for midshipman saccular hair cells with the non-reproductive auditory phenotype. I compare the saccular hair cell frequency response properties to that of the saccular afferent response properties from previous work and interpret my findings as they relate to possible adaptations of the midshipman peripheral auditory system for the detection of conspecific vocalization during social interactions.
Materials and methods
Animals
Plainfin midshipman fish (Porichthys notatus) are known to have three adult reproductive morphs that include females and two male morphs: types I and II (Bass 1996). Type I males build nests, acoustically court females, and provide parental care for fertilized eggs during the breeding season, whereas type II males neither build nests nor acoustically court females, but instead sneak or satellite spawn to steal fertilizations from type I males (Brantley and Bass 1994). Twenty-six adult plainfin midshipman fish, both females and type I males, were collected during the non-reproductive season in late November 2005, mid February 2006, and early March 2006 by otter trawl (R/V Kittiwake, Bio-Marine Enterprises, and the R/V Centennial, Friday Harbor Marine Labs) in Puget Sound near Edmonds, WA, USA and in Bellingham Bay, WA, USA. All the non-reproductive animals included in this study were collected outside of the breeding season in offshore sites and designated as type I males or females were well above the previously reported size range of anatomically identified type I males (SL ≥ 10.5 cm) and females (SL ≥ 8.5 cm) collected from nest sites during the summer breeding season (Brantley et al. 1993; Bass et al. 1996; Grober et al. 1994; Foran and Bass 1998). Only one male (SL = 10.8 cm) in this study was smaller than the reported upper size limit for type II males (approximately 13–14 cm SL) (Brantley et al. 1993; Grober et al. 1994). Thus, it is a low probability that the majority of the males used in this study were misidentified as type I males. All animals were maintained in saltwater aquaria at 14–16°C and fed a diet of goldfish every 2–4 days.
Saccular potential measurements
Methods for recording saccular potentials from the midshipman were adapted from similar studies of the goldfish saccule (Furukawa and Ishii 1967; Furukawa et al. 1972; Fay and Popper 1974). Surgical procedures for exposing the saccule followed those in previous studies (McKibben and Bass 1999; Sisneros and Bass 2003). Briefly, fish were anesthetized by immersion in a 0.025% ethyl p-aminobenzoate saltwater bath followed by an intramuscular injection of pancuronium bromide (approximately 0.5 mg/kg) and 0.25% buvipvacaine (approximately 1 mg/kg) for immobilization and analgesia, respectively. The inner ear saccule was then exposed by dorsal craniotomy (Fig. 1). The cranial cavity was filled with teleost Ringer’s solution to prevent drying and enhance clarity. A 2-cm dam of denture cream was built up around the cranial cavity, which then allowed the animal to be lowered just below the water surface. Animals were then positioned such that the saccule was 10 cm above the surface of an underwater loudspeaker that was embedded in sand on the bottom of a 30 cm diameter, 24 cm high Nalgene tank (similar in design to that used by Fay 1990). The tank was housed inside an acoustic isolation chamber (Industrial Acoustics, New York, NY, USA) on a vibration isolation table, and all the recording and stimulus generation equipment were located outside the chamber. Fish were perfused continuously with chilled fresh seawater (14–15°C) through the mouth and over the gills during the experiments and the condition of the animal was monitored by watching the blood flow in the dorsal vasculature of the brain.
Fig. 1.
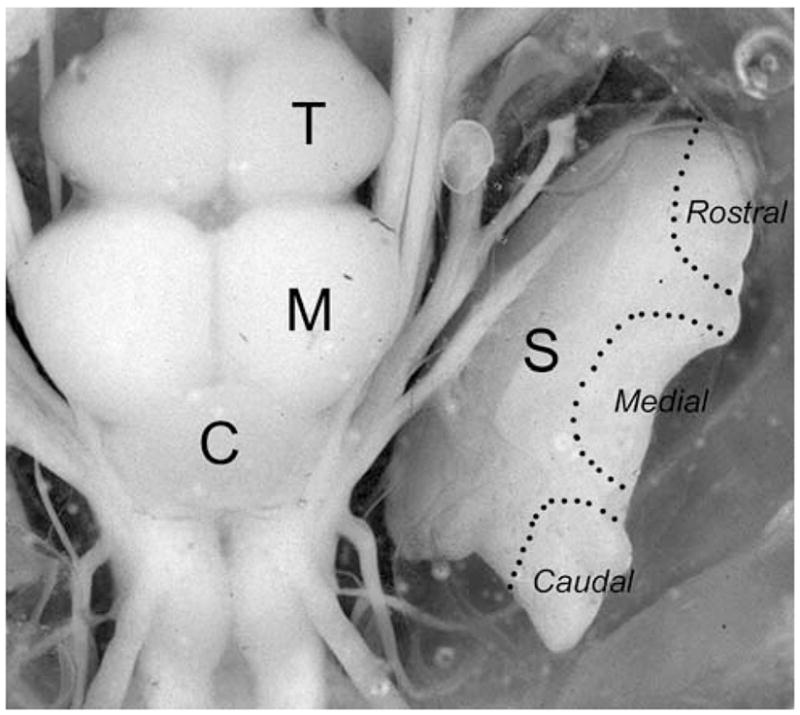
Dorsal view of the plainfin midshipman brain and inner ear. The saccule has been deflected laterally to expose the view of the nerves. Regions of the saccule (S) marked by a dotted outline indicate the lateral area on the rostral, medial and caudal regions of the saccule that were used to recorded the auditory evoked potentials. C cerebellum; M midbrain; T telecephalon
Acoustic stimuli were generated via the reference output signal of a lock-In amplifier (Stanford Research Systems SR830) that was input to an audio amplifier and an underwater speaker (UW-30, Telex Communications, Burnsville, MN, USA). The frequency response of the underwater loudspeaker was measured using a minihydrophone (Bruel and Kjaer 8103) in the position normally occupied by the head of the fish. Relative sound measurements were then made using a spectrum analyzer (Stanford Research Systems SR780), calibrated by peak-to-peak voltage measurements on an oscilloscope, and then adjusted with Mat-lab software so that the sound pressures at all tested frequencies (75–385 Hz) used were of equal amplitude within ±2 dB. Although the midshipman inner ear may be primarily sensitive to particle motion, the determination of sound level in terms of displacement or particle motion is difficult. Perhaps the most confounding difference between particle motion and pressure measurements is the directionality of particle motion. Measurements of pressure differences between various points in the experimental tank were made in previous studies that confirmed the primary axis of particle motion was vertical and orthogonal to the surface plane of the underwater speaker (McKibben and Bass 1999) and that the reflections from the tank walls and water surface did not alter the sound pressure waveform of the acoustic signal (Bodnar and Bass 1997, 1999). The relationship between particle motion and pressure in small tanks is complex (Parvulescu 1967; Fay and Popper 1980) and the quantification or equalization of these two measures is at best difficult. Recent evidence indicates that many primary afferent neurons that innervate the midshipman saccule respond to vertical stimuli or dorsoventral acceleration and that the iso-intensity response curves based on pressure are similar in shape to iso-intensity curves based on particle motion (Weeg et al. 2002), which indicates that the use of a constant pressure stimulus does not result in a misrepresentation of the saccular tuning properties in the midshipman fish. If the midshipman ear is indeed primarily particle motion-sensitive, then the two measures of sound will be proportional but with a different proportionality at each frequency depending on the sound source and tank acoustics. The determination of sound level in terms of the pressure in this study should provide an interpretable measure of sound stimuli that can be used to compare with other fish species (for extended discussion, see McKibben and Bass 1999; Weeg et al. 2002, also for recent review of underwater sound fields, see Bass and Clark 2003).
Basic auditory stimuli consisted of 8–10 repetitions of single 500 ms duration tones with fall and rise times of 50 ms. Each repetition was presented at a rate of 1 every 1.5 s. Pure tone stimuli were presented at 10 Hz increments from 75 to 145 Hz and at 20 Hz increments from 165 to 385 Hz. To measure iso-intensity responses, pure tone stimuli were presented at a sound pressure of 130 dB re 1 μPa, which is consistent with levels for type I male midshipman calls within and near their nest (Bass and Clark 2003). To measure threshold tuning responses, pure tone stimuli were presented at sound pressures from 100 to 145 dB re 1 μPa in incremental steps of 3 dB.
Saccular potentials were recorded with glass micro-electrodes (tip diameter: 1–2 μm) filled with 3 M KCl (1–10 MΩ). Electrodes were visually guided and placed into the endolymph of the saccule approximately 2–5 mm away from the closet hair cell bed in one of three positions (rostral, medial, and caudal) on either the left or right saccular macula (see Fig. 1). Analog saccular potentials were preamplified (100×) (Getting 5A), inputted into a digital signal processing Lock-in amplifier (SR830, Stanford Research Systems), and then stored on a PC computer running a custom data acquisition Matlab software control program. The lock-in amplifier yields a DC RMS (root mean square) voltage output signal that is proportional to the component of the signal whose frequency is exactly locked to the reference frequency. The reference frequency was set to the second harmonic of the stimulation frequency signal (i.e., 2× fundamental frequency) since the maximum evoked potential from the saccule of teleost fish ordinarily occurs at twice the stimulus sound frequency due to the presence of nonlinear and opposite oriented hair cell populations within the saccule (Zotterman 1943; Furukawa and Ishii 1967; Cohen and Winn 1967; Hama 1969). Noise signals at frequencies other than the reference frequency are rejected by the lock-in amplifier and do not affect the measurements.
The RMS amplitudes of the iso-intensity saccular potentials were measured at 130 dB re 1 μPa and the frequency response profiles were then constructed using normalized saccular potential data. The magnitude of the saccular potentials will vary depending on the distance between recording electrode and the sensory receptor hair cells. Thus, in order to control for differences in the absolute magnitude of saccular potentials recorded from different animals and recording regions on the saccular macula (i.e., rostral, medial, and caudal areas of the macula), the signal averaged saccular potential data were normalized and expressed relative to a value of 0 dB that was assigned to the maximum evoked saccular potential recorded at the best frequency (BF) for each record. The BF was defined as the stimulation frequency that produced the greatest saccular potential response. Iso-intensity profiles were collected for three recording regions that include rostral, medial, and caudal areas of the saccule. The peak frequency response of the saccular potentials was determine for each saccular recording region and then summarized in plots. This analytical method allows the comparison of the relative positions of the peak frequency responses and profiles for the three recording regions of the saccule.
Threshold tuning curves were constructed by characterizing the input–output measurements of the RMS amplitudes of the evoked saccular potentials over the range of stimulus intensities, in incremental steps of 3 dB, from 100 to 145 dB re 1 μPa at the tested stimulus frequencies (see above). In addition, background noise measurements were also recorded for 8–10 repetitions of the stimulus interval at each of the tested frequencies from 75 to 385 Hz (see above) with no auditory stimulus present and were then used to establish subthreshold saccular potential response levels. Background noise measurements were performed prior to the recording of each threshold tuning curve. Auditory threshold at each stimulus frequency was designated as the lowest stimulus intensity that evoked a saccular potential that was at least 2 SD above the background noise measurement. The frequency that evoked the lowest saccular potential threshold was defined as the best frequency.
Statistical analysis
The effect of the recorded saccular region (rostral, medial and caudal) on the iso-intensity BF and the effect of sex (type I male vs. female) on iso-intensity BF were determined by a one-way ANOVA. The effects of recorded saccular region (rostral, medial and caudal) and frequency on auditory threshold were determined by a two-way ANOVA followed by the least significant difference (LSD) post-hoc comparison test for planned pairwise multiple comparisons. For all tests, α was set at 0.05. Statistical analyses were carried out using the software program Statistica for Windows (StatSoft, Inc.).
Results
Iso-intensity frequency response
The RMS amplitudes of saccular potentials to single tone stimuli from 75 to 385 Hz at 130 dB re 1 μPa were recorded from the saccular hair cells of 29 adult midshipman fish: 6 type I males (mean standard length (SL) = 16.4 ± 4.5 SD cm) and 23 females (mean SL = 12.7 ± 1.0 SD cm). As described in previous teleost saccular potential studies, the midshipman saccular potentials were always evoked maximally at twice the stimulus frequency rather than at the same stimulus frequency (Fig. 2). Figure 3 shows representative iso-intensity curves of the saccular potentials to tones of 130 dB (re 1 μPa) recorded from the rostral, medial and caudal regions of the saccule. The frequency that evoked the greatest saccular potential was defined as the best frequency (BF). The iso-intensity saccular potential response curves generally consisted of profiles that had BFs ≤ 85 Hz with saccular potential values declining rapidly above BF to their lowest values at 185–385 Hz (Fig. 3). BFs ranged from 75 Hz to 145 Hz with the majority (>63%) of BFs at 75 Hz, the lowest frequency tested, for each of the saccular regions (Fig. 4a).
Fig. 2.

Representative examples of iso-intensity curves of the saccular potentials evoked at the same stimulus frequency (H1, the first harmonic or fundamental frequency, open circle) and at twice the stimulus frequency (H2, second harmonic, filled circle) from the saccule in response to single tones at 130 dB (re 1 μPa). Both examples were taken from the same recording position in the saccule. All saccular potentials are plotted as mean ± 1 SD. Note that most of the SD bars are obscured by the symbols
Fig. 3.

Representative examples of iso-intensity curves of the saccular potentials recorded from the rostral, medial and caudal regions of the saccule in response to single tones at 130 dB (re 1 μPa). All saccular potentials are plotted as mean ± 1 SD. Note that most of the SD bars are obscured by the symbols
Fig. 4.

a Best frequency histograms of the evoked potentials based on the iso-intensity response curves recorded from the rostral, medial and caudal regions of the midshipman saccule. The distribution of the best frequencies of the saccular potentials is based on the saccule’s response to iso-intensity tones of 130 dB (re 1 μPa). The numbers of animals and records for each saccular region are indicated in parentheses. b Best frequency (BF) histogram of the evoked potentials recorded from the midshipman saccule based on the saccule’s response to iso-intensity tones of 130 (re 1 μPa). The histogram includes the distributions of BFs from all recorded saccular regions (derived from a) and the second highest evoked saccular potential peak (2°) for records that had more than one prominent peak in the iso-intensity response curves
Because the mean BF did not differ among the rostral (mean = 82 ± 13 SD Hz, n = 21 animals, 33 records), medial (mean = 82 ± 16 SD Hz, n = 21, 41) and caudal (mean = 78 ± 8 SD Hz, n = 20, 34) regions of the saccule (one-way ANOVA, F = 1.15, df = 2, P = 0.32) and there were no differences in the mean BF between type I males (mean = 78 ± 7 SD Hz, n = 6 animals, 27 records) and females (mean = 81 ± 14 SD Hz, n = 23, 81) (one-way ANOVA, F = 1.69, df = 1, P = 0.20), the iso-intensity saccular potential data were first normalized and expressed relative to a value of 0 dB for the BF for each record, and then were pooled and summarized in Fig. 5. In general, the recorded saccular potentials were greatest at 75 Hz, which was the BF for the majority (71%) of the records regardless of the region (Fig. 4b). In addition to the BF (primary peak sensitivity), a secondary peak was also observed in many of the iso-intensity response plots (52 of the 108 iso-intensity records, see representative examples in Fig. 3) that had a smaller response around 135–145 Hz (mean = 140 ± 21 SD Hz, range = 95–205 Hz; Fig. 4b). The sensitivity (gain) of the saccular potentials rapidly declined above 75 Hz with the exception of a slight elevated peak at 145 Hz that was followed again by a precipitous drop in relative gain to the lowest levels at 305–385 Hz (Fig. 5).
Fig. 5.

Frequency response of the saccular potentials recorded from the midshipman saccule based on the response to iso-intensity tones of 130 dB (re 1 μPa). Peak frequency sensitivity is 75 Hz, the lowest frequency tested. In order to control for absolute sensitivity of different recording positions and compare across different animals, data were normalized to a relative value of 0 dB assigned to the peak response for each record and then expressed in relative dB re Best Frequency Sensitivity. All data are plotted as mean ± 1 SD and the numbers animals and records are indicated in parentheses
Threshold tuning curves
Auditory threshold tuning curves were determined for whole populations of hair cells in the rostral, medial and caudal regions of the saccule from 18 adult midshipman fish. Figure 6 shows representative tuning curves recorded from the rostral, medial and caudal saccular regions. Threshold tuning curves for the saccular potentials generally consisted of profiles with lowest thresholds (100–121 dB re 1 μPa) at frequencies ≤145 Hz that steadily increased to the highest thresholds (145–148 dB re 1 μPa) at frequencies ≥285 Hz (Fig. 6). The frequency that evoked the lowest threshold saccular potential was defined as BF. Best frequencies ranged from 75 Hz to 145 Hz with the majority (>64%) of BFs at 75 Hz, the lowest frequency tested, for each of the saccular regions (Fig. 7). There were no differences in BFs among the rostral (mean = 78 ± 9 SD Hz, n = 11), medial (mean = 91 ± 22 SD Hz, n = 11) and caudal (mean = 83 ± 15 SD Hz, n = 11) regions of the saccule (one-way ANOVA, F = 2.04, df = 2, P = 0.14). However, there were significant threshold differences at various frequencies of the tuning curves from the three saccular regions. The threshold saccular potential tuning curves for the rostral, medial and caudal regions of the saccule are summarized in the plots shown in Fig. 8. In general, the threshold tuning curves from each saccular region showed a rapid increase in auditory threshold above 75 Hz up to the highest thresholds at 385 Hz. There were significant differences in the threshold intensities at frequencies from 75 to 80Hz and from 145 to 185 Hz among the three saccular regions (two-way ANOVA, effect of saccular region, LSD pos-hoc comparison test, F = 16.56, df = 2, 20, P < 0.001). At frequencies of 75 and 80 Hz, the average saccular potential threshold for the rostral region of the saccule was 6.3 dB (2.1×) and 5.4 dB (1.9×) higher, respectively, than that of the caudal saccular region. Similarly, at frequencies from 145 to 185 Hz, the average saccular potential threshold of the rostral saccular region was a 6.3–8.0 dB (2.1–2.5×) higher than that of the medial region of the saccule. In contrast, there was no difference in average saccular potential thresholds between the medial and caudal regions of the saccule except at 80 Hz, where the average saccular potential threshold of the medial saccular region was 5.1 dB (1.8×) higher than that of the caudal region. In sum, these data show that the caudal saccular region was more sensitive and had lower saccular potential thresholds than the rostral region from 75 to 80 Hz and the medial region at 80 Hz while the medial saccular region was more sensitive and had lower saccular potential thresholds than the rostral region from 145 to 185 Hz.
Fig. 6.

Representative examples of individual auditory threshold tuning curves based on the evoked potentials recorded from the rostral, medial and caudal regions of the midshipman saccule. Auditory threshold at each stimulus frequency was determined as the lowest stimulus intensity in dB (re 1 μPa) that evoked a saccular potential that was at least 2 SD above the background noise measurement
Fig. 7.

Best frequency histograms of the evoked potentials based on the tuning curves recorded from the rostral, medial and caudal regions of the midshipman saccule. The distribution of the best frequencies of the saccular potentials is based on the individual auditory threshold tuning curves. The numbers of animals and records for each saccular region are indicated in parentheses, respectively
Fig. 8.

Auditory threshold tuning curves based on the evoked potentials recorded from the rostral, medial and caudal regions of the midshipman saccule. All data are plotted as mean ± 1 SD and the numbers of animals and records for each saccular region are indicated in parentheses. Auditory threshold at each stimulus frequency was determined as the lowest stimulus intensity in dB (re 1 μPa) that evoked a saccular potential that was at least 2 SD above the background noise measurement
Discussion
The aim of this study was to determine the frequency response and auditory threshold sensitivity of midshipman saccular hair cells to behaviorally relevant stimuli using the evoked potential recording technique. The results from this study add considerable new quantitative data about the threshold sensitivity, dynamic range and frequency response characteristics of hair cells in the midshipman saccule. In this discussion I compare the frequency response and sensitivity of the midshipman saccule with that of other auditory evoked potential studies on teleost fishes and then assess the saccular potentials of the midshipman fish in relation to the encoding of vocal communication signals for this species.
Origin of the saccular potentials
Results from this study confirm that the saccular potentials of the midshipman fish, like other teleosts, are evoked greatest at twice the stimulus frequency rather than at the same frequency of auditory stimulation (Fig. 2). This observation was first reported for the lateral line organ in the ruff (Acerina cernua) and also for the saccule of the perch (Perca fluviatilis) by Jielof et al. (1952). Furikawa and Ishii (1967) also documented a similar observation for the goldfish saccule in which the saccular potentials were evoked greatest at twice the frequency of the sound stimulus. In contrast to the double frequency effect of the evoked potentials from the lateral line and saccule, the evoked potentials of the semicircular canals (de Vries and Bleeker 1949) and the cochlea (Tasaki et al. 1954) are known to be evoked greatest at the same frequency of the stimulus. These differences in the evoked potential responses among the different receptor organs can be accounted for by the differences in the spatial orientation of hair cells within the receptor organs (Flock 1965; Flock and Wersall 1962, 1963; Lowenstein and Sand 1940; Wersall and Flock 1965; Hama 1969). In the crista ampullaris of the semicircular canals and in the cochlea, the hair cells are all oriented in the same direction and hence the recorded potentials are evoked greatest at the same frequency of stimulation. In the lateral line and the saccule, there are two groups of hair cells that are oriented in opposite directions across a striola which produce two summed evoked potentials for every auditory stimulus cycle (i.e., the evoked double frequency effect) (Flock 1965; Wersall and Flock 1965). As pointed out by Fay (1974), the double frequency effect of the teleost saccular potentials is also greatly dependent on the existence of a nonlinearity in the generation of the saccular potential waveform to avoid the complete cancellation of two sinusoidal waveforms 180° out of phase with each other. Similar frequency doubling effects of auditory evoked potentials have also been observed in other teleost hearing threshold studies that use the auditory brainstem response (ABR) recording technique where a double frequency component of the ABR was used to determine if an auditory evoked potential was present (Mann et al. 2001; Higgs et al. 2003; Egner and Mann 2005; Casper and Mann 2006). This study takes advantage of the double frequency response of the teleost saccular potentials by using a lock-in amplifier to yield an amplified output signal that is exactly referenced or “locked” to the 2nd harmonic of the stimulus frequency (i.e., an evoked response that is twice the stimulus frequency). Thus, the saccular potentials recorded in this study represent the evoked potentials that originate from at least two regional populations of hair cells with opposite orientations within the saccule.
Iso-intensity frequency response of saccular potentials
The iso-intensity saccular potential records indicate that the saccular hair cells from non-reproductive midshipman were most sensitive to frequencies ≤105 Hz at the behaviorally relevant sound intensity of 130 dB (re 1 μPa), an intensity that is consistent with known levels for midshipman hums recorded near the nests of type I males (Bass and Clark 2003). The iso-intensity responses of midshipman saccular hair cells were characterized so that they could be compared to that of the responses of primary auditory afferents characterized at similar iso-intensities in previous studies (McKibben and Bass 1999, Sisneros and Bass 2003). The iso-intensity response curves for the saccular potentials (Fig. 3) were similar to the iso-intensity profiles plotted for auditory afferent spike rate at the same iso-intensity of 130 dB re 1 μPa (Sisneros and Bass 2003). Previous studies by McKibben and Bass (1999) and Sisneros and Bass (2003) also reported a secondary cluster of BFs around 140 Hz in non-reproductive midshipman fish which is congruent with the iso-intensity frequency response of saccular hair cells reported here (Fig. 5). Furthermore, the distribution of BFs of the saccular potentials from this study and that of the saccular primary afferent data from previous midshipman studies (McKibben and Bass 1999; Sisneros and Bass 2003) is remarkably similar to the distribution of BFs of the saccular primary afferents for the toadfish (Opsanus tau), which has bimodal with peaks at 74 and 140 Hz (Fay and Edds-Walton 1997b).
Threshold tuning of saccular potentials
In general, the threshold tuning records indicate that the lowest auditory thresholds for saccular potentials occurred at the lowest frequencies tested around 75–105 Hz. Slight differences in frequency tuning were observed for the rostral, medial and caudal regions of the saccule. The regional threshold differences observed from 75 to 85 Hz and from 145 to 185 Hz may reflect differences related to the relative number, distribution and orientation of hair cells found in each region of the saccule. Such regional differences in the frequency sensitivity of hair cells do occur in the saccule of goldfish. Fay (1978) and Furukawa and Ishii (1967) found evidence that the caudal region of the goldfish saccule was most responsive to low frequencies and the rostral region to high frequencies. These differences have been hypothesized to be related to the differences in morphology of the hair cells found in the caudal and rostral regions of the saccule. Platt and Popper (1984) showed that the ciliary bundles of hair cells were significantly longer in the caudal region of saccule than in the rostral region. Alternatively, the slight regional differences in frequency sensitivity along the midshipman saccule maybe related to hair cell orientation in the midshipman saccular epithelium. Given that many primary afferent neurons that innervate midshipman saccular hair cells respond to vertical stimuli or dorsoventral acceleration, it is likely that hair cells found in each region of the saccule have hair orientation patterns that are responsive to stimuli in the vertical axis and the slight regional differences maybe related to the proportion of vertically oriented hair cells among the different regions. Recent evidence indicates that midshipman fish have a higher proportion of saccular afferents with vertically oriented best axes than that of toadfish (Fay and Edds-Walton 1997a; Edds-Walton et al. 1999; Weeg et al. 2002). This difference between the toadfish and midshipman suggests a possible difference in the orientation of hair cells in the saccular epithelium between species. In the toadfish Opsanus tau, there is no evidence for regional differences in frequency sensitivity along the saccule (Fay and Edds-Walton 1997a) despite regional differences in hair cell orientation (Edds-Walton and Popper 1995). Future histological studies that examine the morphology, distribution and orientation of hair cells in the midshipman saccule will be required to determine how different hair cell morphologies and characteristics are related to the physiological response properties of hair cells in the midshipman peripheral auditory system.
The threshold tuning profiles presented in this study indicate that the midshipman hearing range is similar to that reported for the closely related toadfish and other “hearing generalist” fish. Previous studies with the oyster toadfish (Opsanus tau) have reported broad tuning from less than 50–250 Hz with some variation in the high cut-off frequencies based on afferent filter function using reverse correlation (Fay and Edds-Walton 1997b) while behavioral conditioning experiments indicate thresholds from around 100 dB (re 1 μPa) below 100 Hz to 140 dB (re 1 μPa) at 500 Hz (Fish and Offutt 1972). Most of the available data for other hearing generalists consists of audiograms from behavioral conditioning experiments and a limited number of physiological studies based on auditory afferents and the auditory brainstem response (see reviews: Hawkins 1981; Popper and Fay 1993; Lu 2004; also Fine et al. 1981; Kenyon 1996; Buchser et al. 2003; Egner and Mann 2005). Although not directly comparable, the data from these studies indicate a hearing range that is consistent for most hearing generalists and similar to that reported here for the midshipman fish. In contrast, “hearing specialists” such as the goldfish and zebrafish have hearing ranges that extend beyond 1,000 Hz (Fay and Ream 1986, Higgs et al. 2002), but can also have auditory afferents with best frequencies at or below 200 Hz (Fay 1978). As suggested by Fay and Ream (1986), the maintenance of low frequency (≤200 Hz) encoding of saccular afferents may be a general characteristic found in all fish auditory systems.
Conspecific vocalizations and the functional significance of the saccule’s frequency tuning
The plainfin midshipman fish is known to produce three types of conspecific vocal signals for intraspecific communication (Ibarra et al. 1983; Brantley and Bass 1994; Bass et al. 1999; Bass and McKibben 2003). All the adult morphs including females and both type I and II males can produce short duration (50–200 ms), broadband isolated “grunts” during non-spawning contexts (Brantley and Bass 1994) whereas only the nesting type I males are capable of producing long lasting “grunt trains” at repetition rates that range from 97 to 110 Hz to fend off potential intruders during agonistic encounters (Bass et al. 1999; Bass and McKibben 2003). Nesting type I males are also the only adult morph known to produce the two other types of midshipman vocalizations, the growl and the hum. Growls are relatively long in duration (>1 s) and have a multiharmonic component with a fundamental frequency (f0) of 59–116 Hz that gradually changes over the duration of the call. Growls are mainly produced during agonistic encounters with other type I males early in the breeding season when males are territorial and establishing their nest sites (Bass et al. 1999; Bass and McKibben 2003). The “hum” is a long duration (>1 min) multiharmonic advertisement call that is produced by nesting type I males during the breeding season to attract gravid females for spawning. It has a f0 that ranges from 90 to 100 Hz with several prominent harmonics that range up to 400 Hz.
Results from this study indicate that the saccular hair cells of non-reproductive midshipman fish are most sensitive to the fundamental frequency components of the midshipman vocalizations. The frequency sensitivity of the saccular hair cells is similar to that previously obtained for the auditory primary afferent neurons of non-reproductive adult midshipman fish (Sisneros and Bass 2003, 2005). In contrast, the saccular afferents of reproductive adult females show enhanced sensitivity to higher frequencies that correspond to the dominant higher harmonic components of the hum and growl, which is likely to increase the probability of conspecific mate detection and localization [see Bass and Clark (2003), Sisneros and Bass (2003) and Sisneros et al. (2004b) for further discussion; saccular afferent encoding of reproductive type I and II males has yet to be studied]. Future studies that investigate the frequency sensitivity of the saccular cells from reproductive adult midshipman will provide valuable insight into whether seasonal changes in saccular afferent tuning are complemented by similar changes in auditory tuning at the level of the hair cell receptor.
Acknowledgments
I thank M. Marchaterre for the photograph used in Figure 1, K-S Leon for field and laboratory assistance, and A. Bass, K-S Leon, the reviewer R. Fay and an anonymous reviewer for helpful comments that greatly improved the manuscript. I also thank the Captain Mark Anderson and the crew of R/V Centennial and Captain Charlie Eaton and the crew of the R/V Kittiwake for field assistance. The development of the saccular potential recording technique used in this study was supported by a Grass Foundation summer 2003 fellowship at the Marine Biological Laboratory, a Royalty Research Fund grant from the University of Washington, and the support of A.H. Bass at Cornell University (NIH NIDCD DC00092). All experimental procedures followed National Institute of Health guidelines for the care and use of animals and were approved by the University of Washington Institutional Animal Care and Use Committee.
References
- Adrian ED, Craik KJW, Sturdy RS. The electrical response of the auditory mechanism in cold blooded vertebrates. Proc R Soc Lond B. 1938;125:435–455. [Google Scholar]
- Bass AH. Shaping brain sexuality. AM Sci. 1996;84:352–363. [Google Scholar]
- Bass AH, Clark CW. The physical acoustics of underwater sound communication. In: Simmons AM, Fay RR, Popper AN, editors. Springer handbook of auditory research: Acoustic Communication. Springer; New York: 2003. pp. 15–64. [Google Scholar]
- Bass AH, McKibben JR. Neural mechanisms and behaviors for acoustic communication in teleost fish. Prog Neurobiol. 2003;69:1–26. doi: 10.1016/s0301-0082(03)00004-2. [DOI] [PubMed] [Google Scholar]
- Bass AH, Horvath BJ, Brothers EB. Nonsequential developmental trajectories lead to dimorphic vocal circuitry for males with alternative reproductive tactics. J Neurobiol. 1996;30:493–504. doi: 10.1002/(SICI)1097-4695(199608)30:4<493::AID-NEU5>3.0.CO;2-Z. [DOI] [PubMed] [Google Scholar]
- Bass AH, Bodnar D, Marchaterre MA. Complementary explanations for existing phenotypes in an acoustic communication system. In: Hauser MD, Konishi M, editors. The design of animal communication. MIT; Cambridge: 1999. pp. 493–514. [Google Scholar]
- Bodnar D, Bass AH. Temporal coding of concurrent acoustic signals in auditory midbrain. J Neurosci. 1997;17:7553–7564. doi: 10.1523/JNEUROSCI.17-19-07553.1997. [DOI] [PMC free article] [PubMed] [Google Scholar]
- Bodnar D, Bass AH. Midbrain combinatorial code for temporal and spectral information in concurrent acoustic signals. J Neurophysiol. 1999;81:552–563. doi: 10.1152/jn.1999.81.2.552. [DOI] [PubMed] [Google Scholar]
- Brantley RK, Bass AH. Alternative male spawning tactics and acoustic signals in the plainfin midshipman fish, Porichthys notatus (Teleostei, Batrachoididae) Ethology. 1994;96:213–232. [Google Scholar]
- Brantley RK, Tseng J, Bass AH. The ontogeny of inter-and intrasexual vocal muscle dimorphisms in a sound-producing fish. Brain Behav Evol. 1993;42:336–349. doi: 10.1159/000114170. [DOI] [PubMed] [Google Scholar]
- Buchser WJ, Lu Z, Xu Z, Evoy WH. Frequency response of saccular afferents in a teleost fish. Soc Neurosci Abstr. 2003;93:7. [Google Scholar]
- Casper BM, Mann DA. Evoked potential audiograms of the nurse shark (Ginglymostoma cirratum) and the yellow stingray (Urobatis jamaicensis) Environ Biol Fish. 2006;76:101–108. [Google Scholar]
- Cohen MJ, Winn HE. Electrophysiological observations on hearing and sound production in the fish, Porichthys notatus. J Exp Zool. 1967;165:355–369. doi: 10.1002/jez.1401650305. [DOI] [PubMed] [Google Scholar]
- de Vries H, Bleeker JDJW. The microphonic activity of the labyrinth of the pigeon. Part II: the response of the cristae in the semicircular canals. Acta Otolaryngol. 1949;37:298–306. doi: 10.3109/00016484909120249. [DOI] [PubMed] [Google Scholar]
- Edds-Walton PL, Popper AN. Hair cell orientation patterns on the saccules of juvenile and adult toadfish, Opsanus tau. Acta Zool. 1995;76:257–265. doi: 10.1111/j.1463-6395.1995.tb00998.x. [DOI] [PubMed] [Google Scholar]
- Edds-Walton PL, Fay RR, Highstein SM. Dendritic arbors and central projections of physiologically characterized auditory fibers from the saccule of toadfish, Opsanus tau. J Comp Neurol. 1999;411:212–238. [PubMed] [Google Scholar]
- Egner SA, Mann DA. Auditory sensitivity of sergeant major damselfish Abudefduf saxatilis from post-settlement juvenile to adult. Mar Ecol Prog Ser. 2005;285:213–222. [Google Scholar]
- Fay RR. Sound Reception and processing in the carp: saccular potentials. Comp Biochem Physiol. 1974;49A:29–42. doi: 10.1016/0300-9629(74)90539-8. [DOI] [PubMed] [Google Scholar]
- Fay RR. Coding of information in single auditory-nerve fibers of the goldfish. J Acoust Soc Am. 1978;63:136–146. doi: 10.1121/1.381705. [DOI] [PubMed] [Google Scholar]
- Fay RR. Suppression and excitation in auditory nerve fibers of the goldfish, Carassius auratus. Hear Res. 1990;48:93–110. doi: 10.1016/0378-5955(90)90201-y. [DOI] [PubMed] [Google Scholar]
- Fay RR, Edds-Walton PL. Directional response properties of saccular afferents of the toadfish, Opsanus tau. Hear Res. 1997a;111:1–21. doi: 10.1016/s0378-5955(97)00083-x. [DOI] [PubMed] [Google Scholar]
- Fay RR, Edds-Walton PL. Diversity in frequency response properties of saccular afferents of the toadfish, Opsanus tau. Hear Res. 1997b;113:235–246. doi: 10.1016/s0378-5955(97)00148-2. [DOI] [PubMed] [Google Scholar]
- Fay RR, Simmons AM. The sense of hearing in fishes and amphibians. In: Fay RR, Popper AN, editors. Springer handbook of auditory research: Comparative hearing: fish and amphibians. Springer; Berlin Heidelberg New York: 1999. pp. 268–318. [Google Scholar]
- Fay RR, Popper AN. Acoustic stimulation of the ear of the goldfish (Carassius auratus) J Exp Biol. 1974;61:243–260. doi: 10.1242/jeb.61.1.243. [DOI] [PubMed] [Google Scholar]
- Fay RR, Popper AN. Structure and function in teleost auditory systems. In: Popper AN, Fay RR, editors. Comparative studies of hearing in vertebrates. Springer; Berlin Heidelberg New York: 1980. pp. 3–42. [Google Scholar]
- Fay RR, Ream TJ. Acoustic response and tuning in saccular nerve fibers of the goldfish (Carassius auratus) J Acoust Soc Am. 1986;79:1883–1895. doi: 10.1121/1.393196. [DOI] [PubMed] [Google Scholar]
- Foran CM, Bass AH. Preoptic AVT immunoreactive neurons of a teleost fish with alternative reproductive tactics. Gen Comp Endocrinol. 1998;111:271–282. doi: 10.1006/gcen.1998.7113. [DOI] [PubMed] [Google Scholar]
- Fine ML. Mismatch between sound production and hearing in the oyster toadfish. In: Tavolga WN, Popper AN, Fay RR, editors. Hearing and sound communication in fishes. Springer; Berlin Heidelberg New York: 1981. pp. 257–261. [Google Scholar]
- Fish JF, Offutt GC. Hearing thresholds from toadfish, Opsanus tau, measured in the laboratory and field. J Acoust Soc Am. 1972;51:1318–1321. doi: 10.1121/1.1912977. [DOI] [PubMed] [Google Scholar]
- Flock A. Electron microscopic and electrophysiological studies on the lateral line canal organ. Acta Otolaryngol Suppl. 1965;199:1–90. [PubMed] [Google Scholar]
- Flock A, Wersall J. A study of the orientation of the sensory hairs of the receptor cells in the lateral line organs of fish, with special reference to the function of the receptors. J Cell Biol. 1962;15:19–27. doi: 10.1083/jcb.15.1.19. [DOI] [PMC free article] [PubMed] [Google Scholar]
- Flock A, Wersall J. Morphological polarization and orientation of the hair cells in the sensory epithelia of the labyrinth and the lateral line organ. J Ultrastruct Res. 1963;8:193–194. [Google Scholar]
- Furukawa T, Ishii Y. Neurophysiological studies on hearing in goldfish. J Neurophysiol. 1967;30:1377–1403. doi: 10.1152/jn.1967.30.6.1377. [DOI] [PubMed] [Google Scholar]
- Furukawa T, Ishii Y, Matsuura S. An analysis of microphonic potentials of the sacculus of goldfish. Jpn J Physiol. 1972;22:603–616. doi: 10.2170/jjphysiol.22.603. [DOI] [PubMed] [Google Scholar]
- Grober MS, Fox SH, Laughlin C, Bass AH. GnRH cell size and number in a teleost fish with two male reproductive morphs: sexual maturation, final sexual status and body size allometry. Brain Behav Evol. 1994;43:61–78. doi: 10.1159/000113625. [DOI] [PubMed] [Google Scholar]
- Hama K. A study on the fine structure of the saccular macula of the goldfish. Z Zellforsch Mikrosk Anat. 1969;94:155–171. doi: 10.1007/BF00339353. [DOI] [PubMed] [Google Scholar]
- Hawkins AD. The hearing abilities of fish. In: Tavolga WN, Popper AN, Fay RR, editors. Hearing and sound communication in fishes. Springer; Berlin Heidelberg New York: 1981. pp. 109–133. [Google Scholar]
- Higgs DM, Souza MJ, Wilkins HR, Presson JC, Popper AN. Age- and size-related changes in the inner ear and hearing ability of the adult zebrafish (Danio rerio) J Assoc Res Otolaryngol. 2002;3:174–184. doi: 10.1007/s101620020035. [DOI] [PMC free article] [PubMed] [Google Scholar]
- Higgs DM, Rollo AK, Souza MJ, Popper AN. Development of form and function in peripheral auditory structures of the zebrafish (Danio rerio) J Acoust Soc Am. 2003;113:1145–1154. doi: 10.1121/1.1536185. [DOI] [PubMed] [Google Scholar]
- Ibarra RM, Penny LT, Ebeling AW, van Dykhuizen G, Caillet G. The mating call of the plainfin midshipman, Porichthys notatus. In: Noakes DLG, Lindquist DG, Helfman GS, Ward JA, editors. Predators and prey in fishes. Junk; Hague: 1983. pp. 205–212. [Google Scholar]
- Jielof R, Spoor A, deVries HI. The microphonic activity of the lateral line. J Physiol. 1952;116:137–157. doi: 10.1113/jphysiol.1952.sp004695. [DOI] [PMC free article] [PubMed] [Google Scholar]
- Kenyon TN. Ontogenetic changes in the auditory sensitivity of damelfishes (Pomacentridae) J Comp Physiol A. 1996;179:553–561. [Google Scholar]
- Lowenstein O, Sand A. The mechanism of the semicircular canal. A study of the responses of single-fiber preparations to angular accelerations and to rotation at constant speed. Proc R Soc Lond B. 1940;129:256–275. [Google Scholar]
- Lu Z. Neural mechanisms of hearing in fish. In: von der Emde G, Mogdan J, Kapoor BG, editors. The senses of fish: adaptations for the reception of natural stimuli. Narosa Publishing House; New Delhi: 2004. pp. 147–17. [Google Scholar]
- Mann DA, Higgs DM, Tavolga WN, Souza MJ, Popper AN. Ultrasound detection by clupeiform fishes. J Acoust Soc Am. 2001;109:3048–3054. doi: 10.1121/1.1368406. [DOI] [PubMed] [Google Scholar]
- McKibben JR, Bass AH. Peripheral encoding of behaviorially relevant acoustic signals in a vocal fish:single tones. J Comp Physiol A. 1999;184:563–576. doi: 10.1007/s003590050356. [DOI] [PubMed] [Google Scholar]
- Parvulescu A. The acoustics of small tanks. In: Tavolga WN, editor. Marine bioacoustics. Pergamon Press; Oxford: 1967. pp. 7–14. [Google Scholar]
- Piper H. Aktionsstrome vom Gehororgan der Fische bei Schallreizung. ZentralblyPhysiol. 1906;20:293–297. [Google Scholar]
- Platt C, Popper AN. Variation in lengths of cillary bundles on hair cells along the macula of the sacculus in two species of teleost fishes. Scan Electron Microsc. 1984;4:1915–1924. [PubMed] [Google Scholar]
- Popper AN, Fay RR. Sound detection and processing by fish: critical review and major research questions. Brain Behav Evol. 1993;41:14–38. doi: 10.1159/000113821. [DOI] [PubMed] [Google Scholar]
- Sisneros JA, Bass AH. Seasonal plasticity of peripheral auditory frequency sensitivity. J Neurosci. 2003;23:1049–1058. doi: 10.1523/JNEUROSCI.23-03-01049.2003. [DOI] [PMC free article] [PubMed] [Google Scholar]
- Sisneros JA, Bass AH. Ontogenetic changes in the response properties of individual, primary auditory afferents in the vocal plainfin midshipman fish Porichthys notatus Girard. J Exp Biol. 2005;208:3121–3131. doi: 10.1242/jeb.01742. [DOI] [PubMed] [Google Scholar]
- Sisneros JA, Forlano PM, Knapp R, Bass AH. Seasonal variation of steroid hormone levels in an intertidal-nesting fish, the vocal plainfin midshipman. Gen Comp Endocrinol. 2004a;136:101–116. doi: 10.1016/j.ygcen.2003.12.007. [DOI] [PubMed] [Google Scholar]
- Sisneros JA, Forlano PM, Deitcher DL, Bass AH. Steroid-dependent auditory plasticity leads to adaptive coupling of sender and receiver. Science. 2004b;305:404–407. doi: 10.1126/science.1097218. [DOI] [PubMed] [Google Scholar]
- Tasaki I, Davis H, Eldredge DH. Exploration of cochlear potentials in the guinea pig with a microelectrode. J Acoust Soc Am. 1954;26:765–773. [Google Scholar]
- Weeg M, Fay RR, Bass AH. Directionality and frequency tuning of primary saccular afferents of a vocal fish, the plainfin midshipman (Porichthys notatus) J Comp Physiol A. 2002;188:631–641. doi: 10.1007/s00359-002-0338-2. [DOI] [PubMed] [Google Scholar]
- Wersall J, Flock A. Functional anatomy of the vestibular and lateral line organs. In: Neff WD, editor. Contributions to sensory physiology. Academic Press; New York: 1965. pp. 39–61. [DOI] [PubMed] [Google Scholar]
- Zotterman Y. The microphonic effect of teleost labyrinths and its biological significance. J Physiol. 1943;102:313–318. doi: 10.1113/jphysiol.1943.sp004037. [DOI] [PMC free article] [PubMed] [Google Scholar]