

Abstract
Lesion-overlap difference maps have been used in studies designed to test anatomical hypotheses regarding brain systems critical for various cognitive and behavioral tasks, including naming and recognition of concrete entities (Damasio et al., 2004). To date the interpretation of these results has focused on areas of maximum lesion overlap differences. Here we explore formal methods for statistical thresholding and power analysis. We derive exact voxelwise statistics describing the behavior of lesion overlap difference maps and lesion proportion difference maps under the null hypothesis of no association between lesion and deficit, and we apply the statistics to a large subset of the subjects previously reported in (Damasio et al., 2004), in order to reassess the lesion correlates of deficits in naming and recognition for five categories of concrete entities. The thresholded maps confirmed many of the results reported previously, but also revealed some differences. Differences in spatial distribution of the lesion correlates of impaired naming of unique versus nonunique entities were confirmed in the inferotemporal region (IT), although overlapping components across categories became apparent in left IT. Additionally, the left inferior frontal gyrus (IFG) was implicated in naming both categories of nonunique natural entities (animals and fruits/vegetables). In corresponding power analyses, we estimated where significant effects could be found under an assumption of maximal effect size given the observed spatial distribution of lesions. Such “effective coverage maps” are valuable for the interpretation of the results, notably because of heterogeneity in lesion coverage encountered in lesion studies. We strongly suggest that when inferential statistics are used in voxelwise lesion-deficit statistical mapping, these or other power maps be included in the reports.
Keywords: language, naming, inferotemporal cortex, statistics, lesion method
The critical role played by specific large-scale neural systems in specific domains of human cognition and behavior can be probed by examining the relationship between acquired brain damage and acquired impairments (Damasio and Damasio, 1989). Lesion-deficit relationships are often assessed using group-level voxel-wise analyses based on structural MRI (Bates et al., 2003; Damasio et al., 2004; Karnath et al., 2004a; Tyler et al., 2005). The specific approach developed by our group, the “MAP-3” analysis (Frank et al., 1997; Damasio et al., 2004), has been used to generate lesion overlap and lesion overlap difference maps between groups of subjects with and without a deficit of interest, across a variety of domains (Damasio et al., 1996; Tranel et al., 1997; Adolphs et al., 2000; Barrash et al., 2000; Tranel et al., 2001; Adolphs et al., 2002; Tranel et al., 2003a; Damasio et al., 2004). For example the MAP-3 approach was employed in a large study of the neural underpinnings of the retrieval of conceptual knowledge and names for concrete entities (Damasio et al., 2004), in which two hypotheses were tested: (A) The retrieval of words denoting concrete entities depends upon the integrity of regions in higher-order cortices of the left temporal lobe, which are partially segregated depending on the conceptual category of the concrete entities. (B) The retrieval of conceptual knowledge pertaining to the same concrete entities depends on regions distinct from those implicated in naming, also partially segregated based on conceptual category, and located predominantly in the right hemisphere. The results of the lesion analysis in that report partially supported both hypotheses. Partial spatial segregation of neural systems involved in lexical retrieval was supported by several observations. Deficits in naming unique entities (famous faces) as opposed to nonunique entities (animals, fruits and vegetables, musical instruments and tools) were associated with lesions largely concentrated in the left temporal pole. Lesions in left posterior lateral IT were associated with deficits in naming animals, tools and musical instruments; lesions in the left fronto-parietal operculum were associated with deficits in naming tools and musical instruments; and a sector of ventral anterior IT was associated with deficits in naming animals and musical instruments. Recognition results included the findings that lesions in right temporal pole and angular gyrus were associated with deficits in recognizing famous faces; that mesial occipital lesions on either side and ventral posterior IT were associated with deficits in recognition of animals; and that anterior temporal regions in both hemispheres as well as right lateral IT and right angular gyrus were associated with deficits in recognition of fruits and vegetables. Left posterior lateral IT lesions were found to be associated with deficit in recognizing tools.
Thus in the 2004 report there was evidence of partial segregation of neural systems critical for retrieval of names and concepts for concrete entities. The differences could not be simply characterized as one-to-one relationships between categories and regions in posterior IT. For example, although a previous and more limited analysis had suggested that regions important for naming tools and animals are segregated in posterolateral and ventral IT, respectively (Damasio et al, 1996), posterolateral IT appeared important for naming both animals and tools, and regions outside IT were implicated in lexical retrieval for certain categories, namely the inferior frontal gyrus for animals and the inferior parietal lobule for tools.
The method in the 2004 report was limited by (1) basic normalization issues with descriptive lesion overlap difference maps, (2) the absence of formal inferential statistics, and (3) a limited assessment of the differential spatial distribution of statistical power across brain regions and conditions. In this report we explore how much these issues might have influenced the previous conclusions.
(1) As explained in detail in the methods section, simple lesion overlap difference maps can present, for basic arithmetical reasons, systematic paradoxical behaviors with respect to the relationships between lesions and deficits that they are meant to represent. Because they do not account for uneven numbers of subjects with deficit vs. no deficit, the relative topographical pattern of values that lesion difference maps portray can potentially be misleading. In regions in which there is a significant positive correlation between lesion and deficit, very low, null or even negative values of lesion overlap difference can be observed under some circumstances, as explained in the Methods section 1.1.
With adequate inferential statistics, the formally thresholded results will be insensitive to the biases in the M3 descriptive measure, because the probability distributions corresponding to the null hypothesis account for this bias. Nevertheless in lesion studies it is important to have a well-behaved descriptive parameter as an indicator of the magnitude of the effect, or for exploratory purposes when, as discussed below, satisfactory power cannot be achieved. Thus, alternatives to lesion overlap difference maps may be preferred. For example, lesion proportion difference maps, defined as the proportion of subjects with a lesion among those with a deficit minus the proportion of subjects with a lesion among those with no deficit, have been used (Karnath et al., 2004b) (we also refer to those maps in this report as “proportional MAP-3” or just PM3). PM3 notably accounts for uneven numbers of subjects with deficits versus no deficits. Other measures of the same type could be proposed but we will focus on M3 and PM3 in this report.
(2) Beyond the issue of well behaved descriptive statistics, the development of inferential statistics for lesion overlap difference maps and lesion proportion difference maps will make it possible to reassess previously reported results. As with other MAP-3 studies (Damasio et al., 1996; Tranel et al., 1997; Adolphs et al., 2000; Adolphs et al., 2002), a formal statistical criterion for significance was not available to threshold the lesion-overlap difference maps in (Damasio et al., 2004). Recent reports have advanced a variety of inferential statistical methods for group-level lesion studies (Bates et al., 2003; Karnath et al., 2004a; Tyler et al., 2005). Notably, chi-square distributions have been used with measures similar to lesion proportion differences. In the 2004 study of Damasio et al, the locations of the maximal differences between the number of subjects with a lesion and a deficit and the number of subjects with a lesion and no deficit were taken to identify regions critical for the support of normal processes. An excess of five impaired subjects in the lesion-difference map was used as a uniform cutoff across all voxels and all categories of concrete entities. Although a reasonable heuristic, the use of the topography of maximal descriptive statistics and of a uniform cutoff to establish lesion-deficit relationships has a limited inferential value. It is also potentially misleading in lesion studies in which lesion coverage is spatially heterogeneous. Not only might local maxima be interpreted as significant when they are not, but perimaximal effects might be ignored when they are in fact significant. This can potentially result in a failure to appreciate important lesion-deficit relationships. Moreover, given that artificially low or negative values can be observed in lesion overlap difference maps (commonly due to an imbalance in the proportion of deficits versus no deficits in the sample), the risk of false negatives when using a uniform positive cutoff is increased.
(3) Finally, in addition of defining well behaved descriptive statistics and inferential methods for controlling type I error (false positives), it is also vital to provide methods for estimating statistical power in the empirical context of lesion studies. This is important both to decide on a realistic threshold and to guide interpretation of the results. Indeed, human lesion studies are “data-starved.” Even large operational lesion registries such as ours provide numbers of subjects which turn out to be limited with respect to the constraints of statistical lesion-deficit mapping. Although whole-brain lesion studies at times include samples of the order of 80–150 subjects, the actual number of subjects with a lesion at a given brain location is necessarily smaller.
Moreover, the lesion coverage is inevitably heterogeneous across voxels, being strongly influenced by the preferential distribution of damage characterizing neurologic diseases (see Figure 1 and Supplementary Material Figure 1). As a result not all voxels include enough observations to yield adequate statistical power at a given threshold. Other parameters of the sample, such as the total number of subjects included in a given analysis, and, among them, the proportion that present a deficit, also affect “effective coverage,” which we define as the map of where effects could possibly be detected at a given significance threshold, i.e. for the maximal lesion-deficit relationships authorized by the sampling parameters (see Methods section 1.3). Effective coverage is only suggested by raw lesion coverage maps, and is hardly ever acknowledged formally (i.e. with an image, voxel by voxel).
Figure 1. Lesion Coverage A.
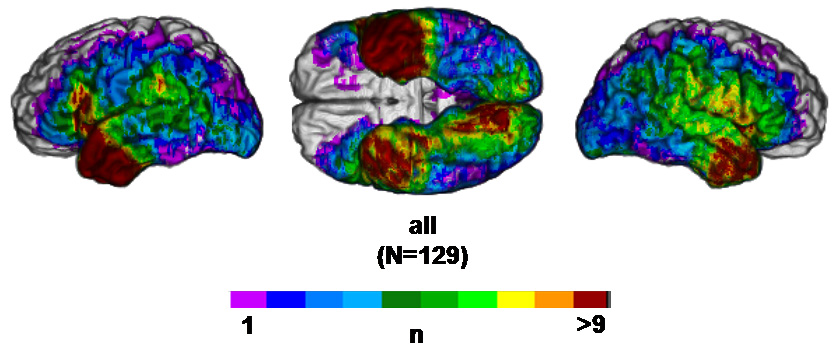
Left lateral, ventral and right lateral views of the reference brain showing the number of subjects in the sample (N=129) with a lesion at a given voxel.
Because of the limited effective coverage encountered in lesion studies, in many cases the use of stringent thresholds will result in a dramatic loss of sensitivity and in an increased bias regarding which parts of the brain can show significant effects: the higher the threshold, the sparser the effective coverage (see Figure 2 and 3) and the greater the potential anatomic bias. This issue is particularly germane in the current study in which anatomic segregation of neural systems is hypothesized.
Figure 2. M3 effective coverage maps for deficits in recognition and naming, thresholded at p<0.001.
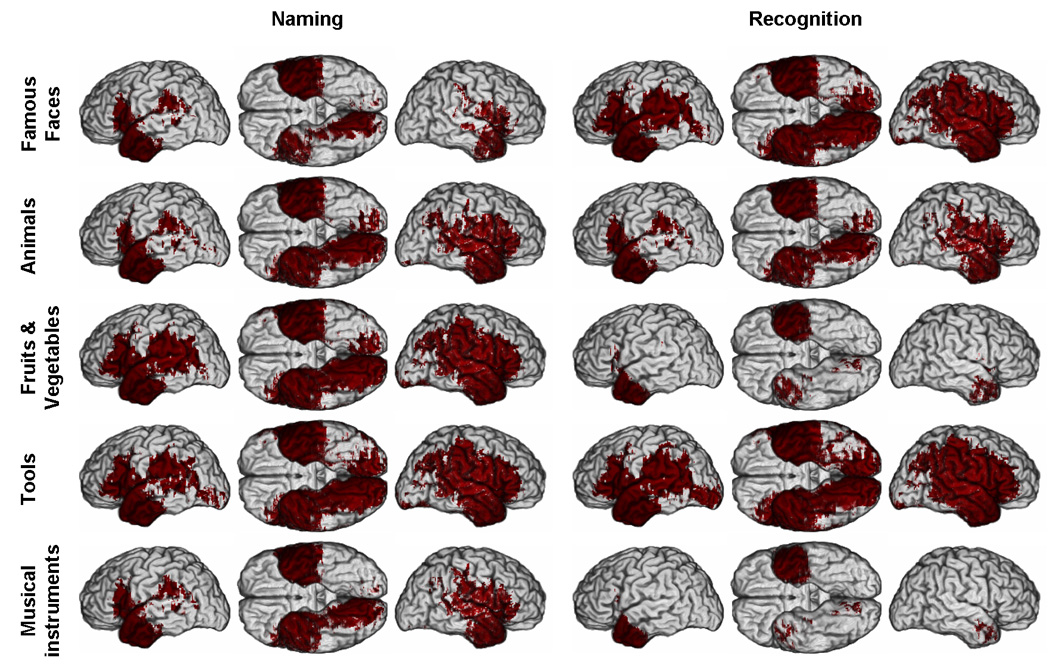
Red color indicates where a significant difference between the number of subjects with a lesion and a deficit and the number of subjects with a lesion and no deficit can potentially be detected. Each row of brains corresponds to a given category of concrete entities. The three first columns correspond to results related to naming performance and the three last columns to results related to recognition performance. In each group of three columns, three views of the brain are presented: left lateral (left), ventral view of both hemispheres (middle), and right lateral (right). (See Supplementary Material online for parallel PM3 and reduced model maps).
Figure 3. M3 effective coverage maps for deficits in recognition and naming, thresholded at p<0.05.
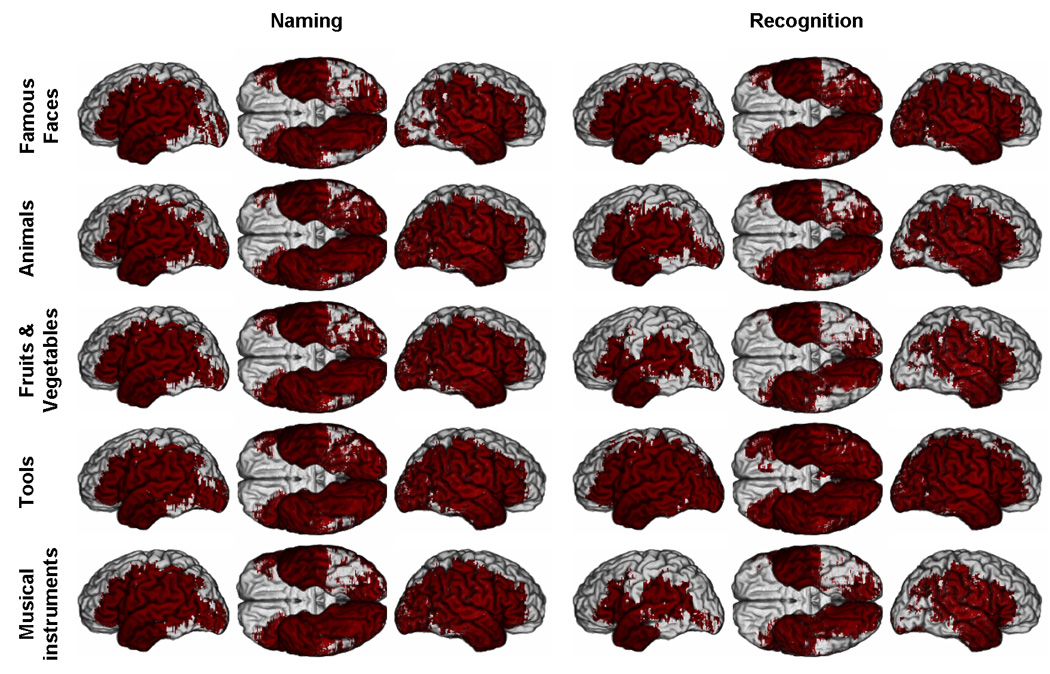
Red color indicates where a significant difference between the number of subjects with a lesion and a deficit and the number of subjects with a lesion and no deficit can potentially be detected. (Same conventions as Figure 2. See Supplementary Material online for parallel PM3 and reduced model maps).
In this article, we have three related aims. The first aim is to derive analytic expressions of the probability mass functions governing lesion overlap difference maps and lesion proportion difference maps, at the voxel-level, when the null hypothesis of statistical independence between a lesion and deficit is true. The results provide an exact inferential statistical method to threshold those maps and uniformly control voxelwise type I error (false positives). The statistical framework we use is similar to that used in a Fisher exact test, but applied here specifically to the M3 and PM3 statistics. The second aim is to propose strategies of interpretation and reporting standards for lesion-deficit statistical mapping studies, acknowledging quantitatively the limited power of human lesion studies and the relationship of power to anatomic sampling heterogeneity. Based on the derived statistical models, we use maps of “effective coverage” (ECMs) to a) select significance thresholds that are not associated with overly restricted effective coverage, and b) map the regions where no effects could have been found even under the strongest lesion-deficit relationships, so as to guide the interpretation of results. The third aim is to demonstrate the use of this approach by reassessing the lesion-deficit relationships for naming and recognition in the five categories of concrete entities studied in (Damasio et al., 2004).
The application of the new inferential statistical methods to this dataset continues to support many of the findings in the original report, but provides less support for the hypothesis of spatial segregation of category-related systems located in the left temporal lobe and important for lexical retrieval. In addition, due to the paradoxical behaviors discussed above, the regions of significant relationships in lesion difference maps do not always correspond to local maxima in the descriptive maps, whereas regions of significant relationships in lesion proportion difference maps are straightforwardly related to local maxima in the descriptive maps.
1 MATERIAL AND METHODS
1.1 Biased original measure (M3) and alternative measure (PM3)
For a given sample of N subjects, with a number of subjects with a lesion (NL) at a given voxel v, and a number of subjects with a deficit (ND) in the sample, the lesion overlap difference map (M3), is defined as:
| (1) |
the number of subjects, NLD, with a lesion (L) at v and a deficit (D) minus the number of subjects, NL~D, with a lesion (L) at v and no deficit (~D) (the ‘~’ sign indicates negation).
This is equivalent to:
| (2) |
that is the joint proportion of subjects with a lesion and a deficit Prop(L,D) minus the joint proportion of subjects with a lesion and no deficit Prop(L,~D), times the number N of subjects in the sample. When the null hypothesis of statistical independence of lesion and deficit is true (i.e. the presence of a lesion at a given location does not influence the rate at which a deficit will appear and conversely), the expected difference is equal to:
| (3) |
i.e. the difference of the products of the expected marginal proportions. Thus the expected observed M3 will be equal to:
| (4) |
(through Bayes theorem).
As mentioned in the introduction, lesion overlap difference maps can present paradoxical behaviors with respect to the relationships between lesions and deficits that they are meant to represent, for basic arithmetical reasons. When no lesion-deficit relationship exists, the expected measure of lesion overlap difference will be (i) shifted from zero to an amount proportional to the difference between the proportions of subjects with a deficit versus no deficit in the sample, (ii) locally inflated proportionally to the proportion of lesions at voxel v in the sample, and (iii) globally inflated proportionally to the total number of subjects in the sample. Because the observed lesion overlap differences depend on the difference between the number of subjects with a deficit ND and no deficit N~D in the sample, artificially low, null or even negative values of lesions overlap differences can sometimes be observed. This will commonly happen when the number of subjects with a deficit in the sample is lower than the number of subjects without deficits. Likewise, small differences between lesion-deficit relationships across conditions or across voxels can be amplified for the same reason. Finally, the observed lesion overlap differences are proportional to the number NL of subjects with a lesion at voxel v in the sample. Thus differences in values of lesion overlap difference between two regions can arise solely from differences in lesion coverage at the level of those two regions, even in cases in which the probability of a deficit resulting from a lesion is actually the same for the two regions. For these reasons the relative topographical pattern of values that lesion difference maps portray can be misleading.
Another measure, the “lesion proportion difference”, defined as the proportion of subjects with a lesion among those with a deficit minus the proportion of subjects with a lesion among those with no deficit, can be used (as was implicitly done by Karnath et al., 2004b). We refer to these maps in this report as PM3). PM3 maps are obtained by dividing the first and second terms of equation (1) by ND and N~D respectively. As we demonstrate (see also Supplementary material), PM3 as a descriptive measure has generally a more straightforward relationship to its statistical significance than M3, in particular because the probability distributions corresponding to the null hypothesis tend to be better centered around zero.
Thus at a given voxel, the lesion proportion difference map (PM3) is defined as:
| (5) |
the proportion of subjects with a lesion and a deficit relative to all subjects with a deficit minus the proportion of subjects with a lesion and no deficit relative to the all subjects with no deficit. PM3 accounts for uneven numbers of subjects with deficits versus no deficits, solving problem (i) and also cancels the global effect of N, solving problem (iii). Other measures of the same type could be proposed but we will focus on these two in this report
1.2 Analytical form of the null distributions of M3 and PM3
The exact statistical framework that we develop here is analogous to that used in a Fisher exact test, but adapted to the specific statistics presented above, such that a direct link between unthresholded descriptive measures of interest and the corresponding thresholded maps is preserved.
Meaningful specific null hypotheses for M3 and PM3 must be derived based on the general null hypothesis of statistical independence between lesion and deficit at the level of the parent distribution (i.e. population) from which the subject sample is taken. In other words, at the level of the parent distribution, there is a certain proportion of subjects with a deficit p(D) and a certain proportion of subjects with a lesion at a given voxel p(L), but the probability of having a lesion does not affect the probability of having a deficit and vice versa, so that the expected proportion of subjects with a lesion and a deficit p(L,D) is equal to the product of the marginal proportions p(D)p(L).
For M3, it is thus necessary to determine the distribution of the probability:
| (6) |
of observing a given value of M3 = NLD − NL~D = X, when deficit and lesion are two statistically independent variables.
Similarly, for PM3, it is necessary to determine the distribution of the probability:
| (7) |
of observing a given value of under the same circumstances.
Since NL~D = NL − NLD, the M3 equation can be rewritten as:
| (8) |
and thus:
| (9) |
Similarly, since NL~D = NL − NLD , and N~D = N − ND, then:
| (10) |
and thus:
| (11) |
For a given sample size N, M3 and PM3 are uniquely defined given a set of values NLD = x1, NL = x2, and ND = x3.
The probability of any value of M3 or PM3 when the null hypothesis is true will be a direct function of the joint probability P(NLD, NL, ND) of NLD, NL, and ND (formally M3 depends only on NLD, and NL so that P(M3=X) will remain constant if ND varies without affecting NLD). Now:
| (12) |
Since NL and ND are independent under the null hypothesis, the product rule may be applied:
| (13) |
The conditional probability of a number of subjects NLD having both a lesion and a deficit in a sample of N subjects given NL and ND can be computed exactly using a specific form of the hypergeometric distribution (See Supplementary Material online for sketch of derivation):
| (14) |
where. The symbol “!” stands for the factorial of the preceding term.
P(NL) and P(ND) in (13) explicitly model the effect of sampling N subjects from a parent population on the observed number of NL subjects with a lesion at voxel v and ND subjects with a deficit, respectively. This population can only be defined in the most general terms: in our case, it is the ideal population of all the subjects with a focal brain lesion (or at least the type of focal brain lesions observed in a given institution over a certain period of time). Only rough assumptions can be made about the size of the actual population of persons with a focal brain damage. Just to take a number, about 5,500,000 stroke survivors are alive today in the US and perhaps half of them would be eligible for a particular neuroscientific study. At a global scale, the number would be obviously much larger. The point is that such a number is large enough for the population to be validly assumed infinite for practical statistical purposes. Based on this assumption we can use the binomial distribution to define P(NL) and P(ND). Thus:
| (15) |
and,
| (16) |
Finally,
| (17) |
In practice p(L) and p(D), respectively the proportions in the population of subjects with a lesion at voxel v and that of subjects with a deficit, can be estimated using the observed proportions in the sample, based on a standard criterion of maximum likelihood.
The actual probability of observing M3 = X (respectively PM3 = Y) when the null hypothesis is true is then calculated using the sum rule by integrating P(NLD, NL, ND) over the subset of possible combinations of NLD=x1, NL=x2, ND=x3 which leads to M3 = X (respectively PM3 = Y). In other words, the probability of M3 (respectively PM3) being equal to a given value X (respectively Y) is defined by the sum of the joint probabilities of NLD, NL, ND over the subset of the partition of the “cube” (3 dimensional matrix of values) defined by the possible values of NLD, NL, ND, which is crossed by the isosurface S(M3 = X) (respectively S(PM3=Y)):
| (18) |
and
| (19) |
Relatively efficient numerical solutions can be found to compute these values exactly.
The actual probability mass function of P(M3) is defined by applying (18) to all possible values of M3, while P(PM3) is defined by applying (19) to all possible values of PM3.
Finally, the cumulative form of the resulting probability mass functions is used in order to define a threshold of significance.
In the following, we will refer to probability mass functions computed based on formula (17) as based on the “full model,” since their computation includes all the terms describing the process of sampling. We will refer to probability mass functions computed based on the conditional term only (hypergeometric distribution) as based on the “reduced model.” The reduced model approach represents a solution for the null hypothesis which exhaustively models random permutations of the relationships between lesion and deficit observed in the sample. It provides the exact solution of the distribution of probability that would be estimated using a procedure of resampling of the observed data, in which the relationships between deficit and lesion would be randomized. Such permutation is limited in term of its inferential value, since it does not model the sampling from the population, but corresponds to a standard exact “one cell” statistical approach. On the other hand, the full model, more accurate in principle, requires knowledge or inference regarding the parameters of the population p(L) and p(D). These parameters are unknown, but following a standard heuristic in statistics, we can employ the fact that the corresponding proportions in the observed sample have maximum likelihood to be observed when they are equal to the population parameters, and constitute unbiased estimates of these parameters.
The choice between a “full model” or a “reduced model” approach is somewhat arbitrary. Both approaches present advantages and inconveniences, and in practice, both provide similar results. In our analyses, we will use the full model for M3, given that M3 was used in the original study (parallel results obtained with PM3 and the reduced model can be found in the Supplementary Material online). More generally, detailed derivations and all the simulations validating the inferential statistics are included in the Supplementary Material online. It can be noted that this general analytical framework can be applied to any measure which depends on the same parameters.
1.3 Dataset
The subjects, experimental protocol, MRI acquisition and MAP3 processing method are extensively described in (Damasio et al., 2004) and are briefly reviewed here.
Subjects
The data set used in this study is the same as the one used in Damasio (2004), with the exception of 10 subjects who were not included in the current study. The data for two subjects were not available and after review of the radiological material, sometimes with improved scans, 8 subjects were found to have some possible damage in the hemisphere opposite to the main lesion, most of it minor, but as we continued to want to use only unilateral lesions we decided to exclude those subjects. The remaining 129 subjects were assumed to have left hemisphere language dominance based on the neuropsychological data. They had normal intelligence, no difficulty attending to and perceiving visual stimuli, no severe aphasia that would preclude the scoring of the naming protocols used in this study, and an average of 12 years of formal education. All had been selected from the Patient Registry of the University of Iowa's Division of Behavioral Neurology and Cognitive Neuroscience, and had given informed consent in accordance with University and Federal requirements. Lesions were caused by either cerebrovascular disease, herpes simplex encephalitis, or temporal lobectomy. All subjects had been characterized neuropsychologically and neuroanatomically in the chronic epoch (at least three months post onset of lesion), according to the standard protocols of the Benton Neuropsychology Laboratory (Tranel, 1996) and the Laboratory of Human Neuroanatomy and Neuroimaging (Damasio and Damasio, 1989; Damasio, 1995; Frank et al., 1997). Fifty-five normal controls, matched to the brain-damaged subjects on key demographics (age, education, and gender distribution), were used to define norms for performance in recognition and naming in five conceptual categories (see for details see Damasio et al., 2004).
Stimuli and Procedure
Pictures of unique and nonunique concrete entities corresponding to five different conceptual categories were used: black and white photographs of famous faces (n=133); black and white photographs and line drawing of animals (n=90), tools and utensils (n=104), fruits and vegetables (n=67), and musical instruments (n=16). For all categories, the same entity (e.g. a hammer) was only shown once.
The task was for the subject to produce the name of the object (or person) presented as a visual stimulus. When the name could not be produced, or a paraphasia occurred, the examiner would prompt the subject to produce a description of the item, as specifically as possible. Sessions were audiotaped. No time limits were imposed. Written transcriptions of audiotaped subjects’ responses were used to score performance in naming and recognition. An item was scored as correctly named when subjects produced the expected name. An item was scored as correctly recognized when subjects produced the expected name (correct naming being taken to imply correct recognition), or when two independent raters, blind to the experimental item presented, were able to identify the stimulus based on the verbal description provided by the subject. Thus the “recognition” task involved production of sufficiently accurate conceptual knowledge for the entities in question so as to convey the concept to a third person. When raters could not identify a stimulus correctly, the item was scored as incorrectly recognized and excluded from the calculation of the naming score, in an attempt to dissociate naming and recognition deficits.
For each participant, and each category of concrete entity, recognition performance was defined as the percentage of items correctly recognized in the set of stimuli corresponding to that category. Naming performance was defined as the percentage of items correctly named out of the set of items a given participant had correctly recognized in a particular category. Subjects achieving less than 50% correct recognition were excluded from the naming analysis for that category. Subjects with a naming score (respectively a recognition score) two standard deviations or more below the mean naming score (respectively mean recognition score) of the normal comparison subjects were considered as having a ‘deficit’ in the corresponding category. Subjects with a naming score (respectively a recognition score) falling in the range of 1.5 to 2 standard deviations below the mean were considered as in a “gray zone” (i.e. borderline) and were excluded from the analysis for the corresponding categories (see Damasio et al., 2004). These criteria led to different numbers of subjects for the analyses of naming and recognition in the various conceptual categories.
Neuroanatomical data quantification and analysis
T1-weighted MRIs of the brains of most subjects were acquired using a 1.5 Tesla General Electric Signa scanner with a 3D SPGR sequence yielding 1.5 – 1.7 mm contiguous T1-weighted coronal cuts. In some subjects for whom an MRI could not be acquired, computerized axial tomography (CT) was used. Brain scans and neuropsychological evaluations were obtained in the chronic epoch, defined as three months or more post-lesion onset.
Lesion delineation and transfer onto a reference brain was achieved using the MAP3 method, in which the boundaries of the lesions of a given subject are identified and manually transferred onto a standard normal brain with reference to homologous anatomical landmarks (See Supplementary Material online for details). Lesion delineation and transfer were done using Brainvox (Damasio and Frank, 1992; Frank et al, 1997). This procedure requires anatomical expertise and circumvents the problems of inter-individual registration encountered with lesion data, and the problems of combining subjects scanned with different imaging modalities.
For each category of concrete entity and each dependent variable, i.e. the presence or absence of a deficit in recognition or naming, M3 and PM3 overlap difference maps were created using Matlab (MathWorks, Inc., Natick, MA). These maps were thresholded using the inferential statistical methods described above, using the “full model” and the “reduced model” approaches.
We also built “effective coverage maps” (ECMs) to delineate where significant effects at a given threshold could be possibly detected. To do so we first constructed maps of the maximum lesion-deficit relationship permitted by the sample, as illustrated by the following example. In a hypothetical dataset of 100 subjects, in which 8 subjects had a deficit, if there were a voxel at which 10 lesions overlapped, the maximum permitted relationship at that voxel would the case in which the 10 lesions corresponded to all 8 subjects with a deficit and 2 additional subjects without a deficit (e.g. M3 = 8-2 = 6, and PM3 = 8/8 – 2/(100-8) = 0.98). Maps of such maximally permitted statistics, for M3 and PM3, were then thresholded as described above to build the ECMs. Hereafter, when there is enough power to detect maximal effects at a given threshold, we will say, for short, that there is “no basic problem with statistical power”.
2 RESULTS
2.1 Lesion Coverage
Figure 1 presents a map of the lesion coverage provided by our sample of 129 subjects. The lesion coverage is heterogeneous, and dominated by coverage of the middle cerebral artery territories, i.e. the most common vascular territory involved in ischemic stroke, which was in turn the dominant lesion mechanism in the sample. Anterior temporal lobectomies were also well-represented in the sample. See Supplementary Figure 1 for a more detailed presentation of these maps down by lesion mechanism.
2.2 M3 “Effective Coverage” Maps
Figure 2 and 3 present thresholded maximum M3 maps, i.e. ECMs. We looked at two different thresholds: a one-tailed uncorrected threshold corresponding to α< 0.001 (Figure 2) and a less stringent one-tailed uncorrected threshold corresponding to α < 0.05 (Figure 3).
At α < 0.001, the effective coverage was very limited, in particular for the left hemisphere, and varied considerably depending on the task and category tested. The only region consistently covered in both sides of the brain, all tasks and all categories was the temporal pole. Right perisylvian and ventral occipito-temporal regions often but not systematically presented adequate effective coverage.
At α < 0.05, the effective coverage appeared much broader and encompassed most of the territories included in the actual lesion coverage maps. Still, for all categories in the naming task, the ventral posterior inferotemporal cortex, especially on the left (see Figure 3), had critically low effective coverage. The same problem was observed in the recognition task with the exception of the category tools (Effective coverage maps for PM3 and the reduced model were similar and can be found in the Supplementary Material).
Given the restriction of effective coverage for the more stringent threshold, and based on the arguments presented in the introduction, we decided to use the uncorrected threshold of p < 0.05 as the criteria for significance for the remaining analyses.
2.3 Unthresholded Results
Figure 4 presents unthresholded lesion overlap difference maps (M3). As reported in the original study with a slightly larger sample (Damasio et al., 2004), deficits in naming were significantly associated with left-lateralized lesions. Deficits in naming unique entities, as opposed to nonunique entities, were associated with lesions largely concentrated in the left temporal pole. Lesions in left lateral posterior IT were associated with deficits in naming animals and deficits in naming tools; a sector of ventral anterior IT was associated with deficits in naming animals and musical instruments; partially overlapping with the region implicated in naming famous faces. Outside the temporal lobe, lesions in the inferior frontal gyrus appeared associated with deficits in naming animals. Regarding recognition, lesions in right angular gyrus were associated with deficits in recognizing famous faces, fruits and vegetables, and musical instruments (these were also associated with lesions in the supramarginal gyrus). Lesions in the right ventral temporal pole were associated with deficits in recognizing famous faces and fruits and vegetables. Lesions in left temporal pole were associated with deficits in recognizing fruits and vegetables only. Lesions in both mesial occipital regions and right ventral posterior IT were associated with deficits in recognizing animals and musical instruments; and left posterior lateral IT lesions were associated with deficit in recognizing tools.
Figure 4. M3 (lesion overlap difference) maps for deficits in naming and recognition.
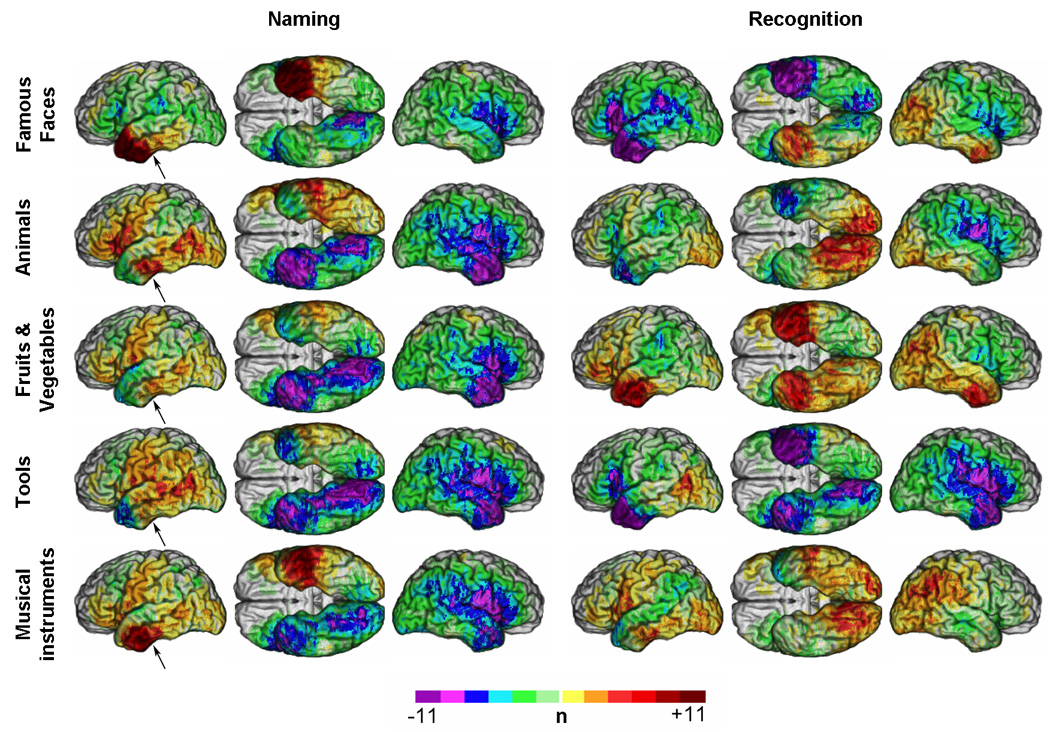
Unthresholded M3 results overlaid on a reference brain. Positive values (see colorbar) indicate a greater number of subjects with a lesion and a deficit than a lesion and no deficit. Negative values indicate a greater number of subjects with a lesion and no deficit than a lesion and a deficit. (Same conventions as Figure 2). Arrows indicate one of the regions discussed for which discrepencies were observed between M3 and PM3.
Figure 5 presents unthresholded lesion proportion difference maps (PM3). The unthresholded results differ from those obtained with M3 in some important ways. For example, using PM3, left posterior lateral IT lesions show an association with deficits in naming fruits and vegetables, in addition to tools and animals. Likewise maxima now appear in the inferior frontal gyrus for naming fruits and vegetables in addition to animals, and maxima appear for all categories in left anterior IT, whereas such maxima were found only for famous faces, animals and musical instruments with M3. Regarding recognition, lesions in the right angular gyrus and right temporal pole now appear more clearly to be selectively associated with a deficit in recognizing famous faces. Deficits in recognition of tools continue to be strongly associated with lesions in the left hemisphere, in posterior lateral IT. Defective recognition for fruits and vegetables and for musical instruments maintains only a weak association with bilateral temporal polar regions in the case of fruits and vegetables; no associations are seen for musical instruments.
Figure 5. PM3 (lesion proportion difference) maps for deficits in naming and recognition.
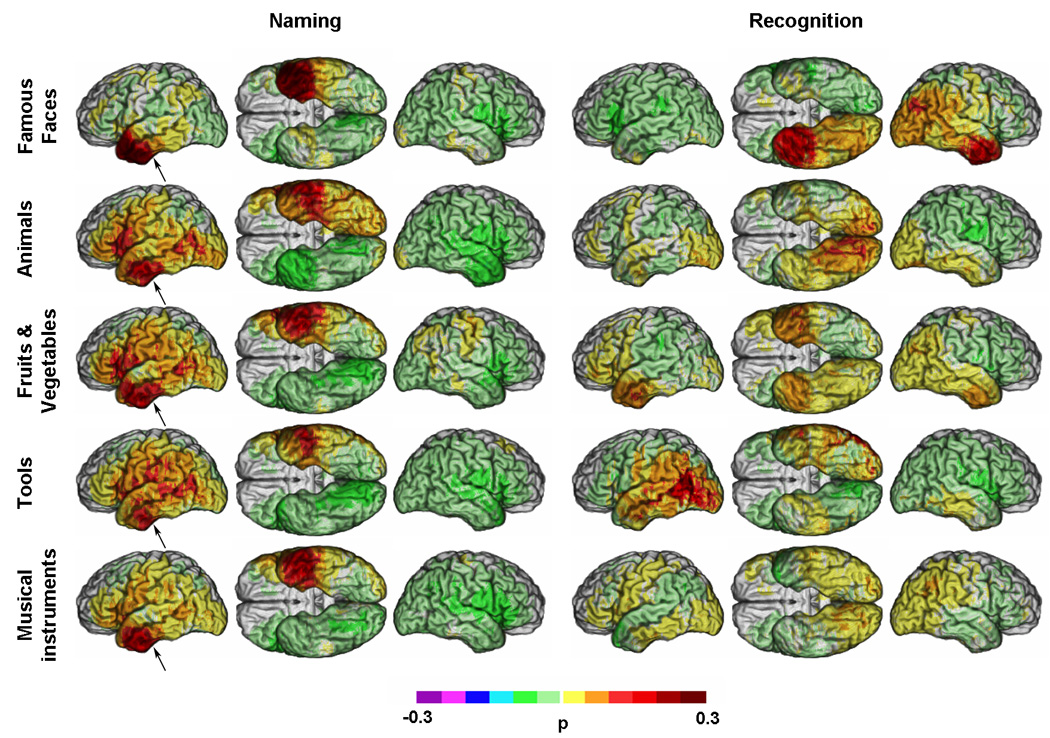
Unthresholded PM3 results overlaid on a reference brain. Positive values (see colorbar) indicate a greater proportion of subjects with a lesion and a deficit among those with a deficit than a lesion and no deficit among those with no deficit. Negative values (see colorbar) indicate a lower proportion of subjects with a lesion and a deficit among those with a deficit than a lesion and no deficit among those with no deficit. (Same conventions as Figure 2). Arrows indicate one of the regions discussed for which discrepencies were observed between M3 and PM3.
2.4 Thresholded Results (p < 0.05)
Figure 6 and Figure 7 present the results of the thresholded M3 and PM3 analyses, respectively, using the uncorrected threshold corresponding to α < 0.05 (one-tailed) and the full model approach.
Figure 6. Thresholded lesion overlap difference maps for deficits in naming and recognition (p < 0.05).
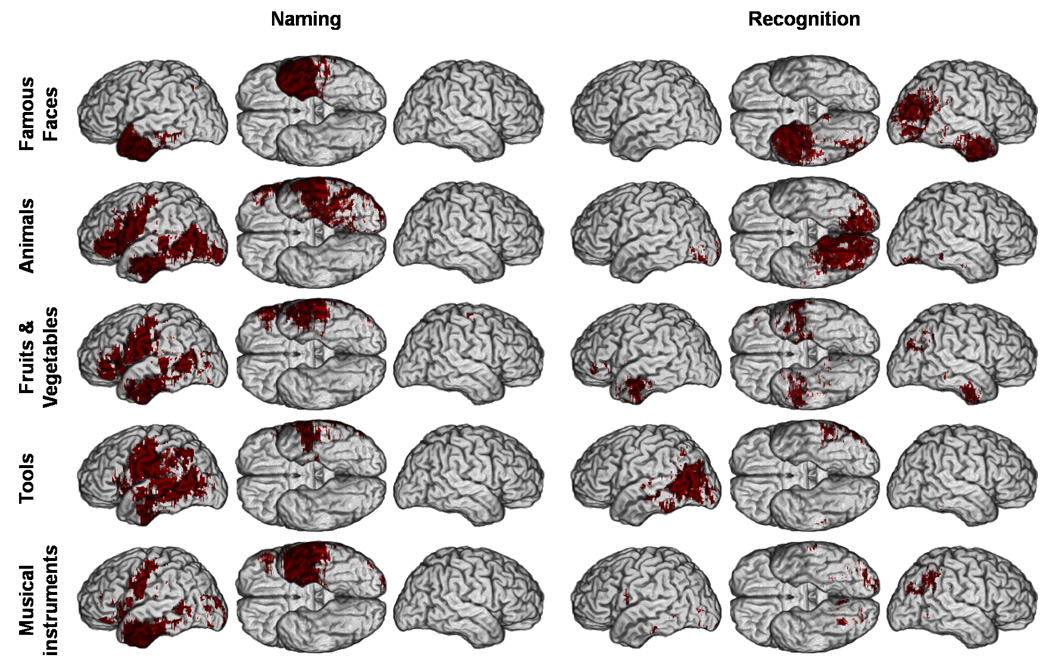
Thresholded M3 results overlaid on a reference brain. Dark red indicates a significant difference between the number of subjects with a lesion and a deficit versus the number of subjects with a lesion and no deficit. (Same conventions as Figure 2).
Figure 7. Thresholded lesion proportion difference maps for deficits in naming and recognition (p < 0.05).
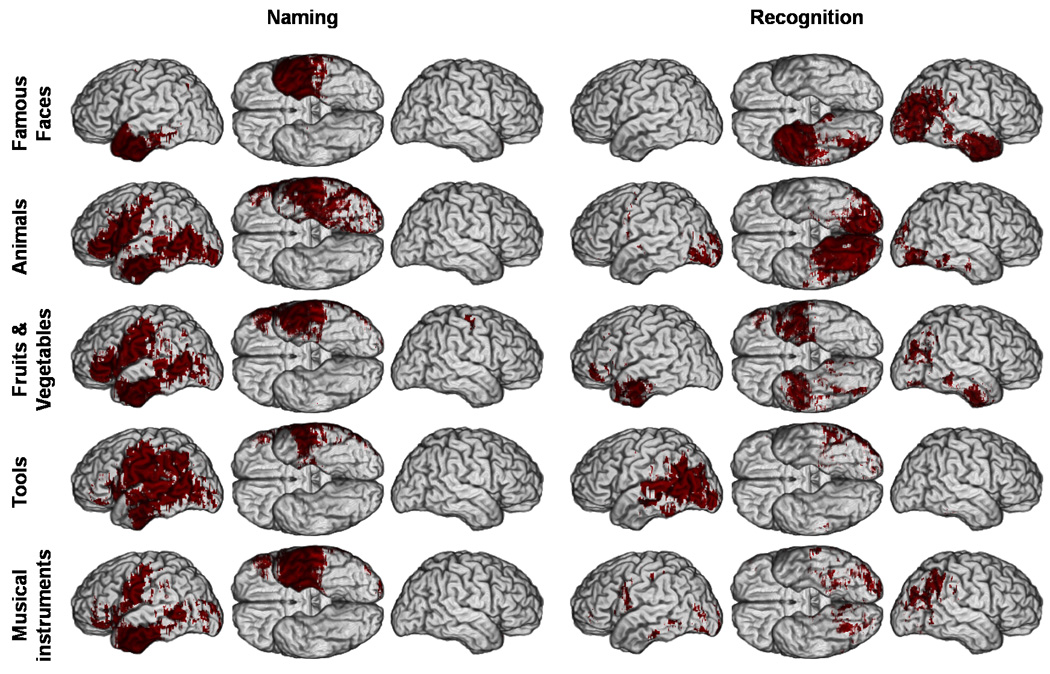
Thresholded PM3 (p < 0.05) results overlaid on a reference brain. Dark red indicates a significant difference between the proportion of subjects with a lesion and a deficit among those with a deficit versus the proportion of subjects with a lesion and no deficit among those with no deficit. (Same conventions as Figure 2).
Unlike the unthresholded M3 and PM3 maps (Figure 4 and 5), the thresholded M3 and PM3 maps were concordant (Figure 6 and Figure 7). The distribution of significant effects in thresholded PM3 maps was completely concordant with the corresponding pattern of descriptive maxima in the unthresholded PM3 maps (Figure 5 and Figure 7). However, some discrepancies were apparent between the patterns of the unthresholded and thresholded M3 maps (Figure 4 and Figure 6). After thresholding, lesions in anterior ventral IT, descriptively associated with higher unthresholded M3 values for famous faces, animals and musical instruments appeared significantly associated with deficits in naming for all five categories of concrete entities. Likewise, the left posterior lateral IT region which presented large descriptive M3 values mainly for animals and tools (Figure 4) showed significant effects of lesion - naming deficit associations for all categories of non unique entities, although to a lesser extent for musical instruments. Ventral rolandic lesions were associated with significant effects of lesion-naming deficit associations for all four categories of non unique entities. Lesions in the inferior frontal gyrus, which in descriptive M3 maps appeared mainly associated with deficits in naming animals, were significantly associated with both categories of nonunique natural entities (i.e., animals and fruits/vegetables). Regarding recognition, lesions in right angular gyrus, which appeared in the descriptive M3 maps to be associated with deficits in recognizing famous faces, fruits/vegetables, and musical instruments, were found after thresholding to be mostly associated with deficits in recognizing famous faces, although some very restricted effects could still be seen with the two other categories in the same region. Finally, in the thresholded maps, the mesial occipital regions and right ventral posterior IT appeared predominantly associated with deficits in recognizing animals.
Concordance between the thresholded maps and the distribution of local maxima in the M3 maps was seen for deficits in naming persons, which were associated with lesions in the left temporal pole, and for deficits in recognizing persons, which were associated with lesions in the right temporal pole and angular gyrus. Lesions in the left inferior parietal lobule were significantly associated with deficits in naming tools only, a relationship that was reflected in a modest maximum in the descriptive maps.
Concordance was found for deficits in recognition of tools associated with lesions in the left posterior lateral IT; and for deficits in the recognition of animals associated with bilateral mesial occipital lesions and right posterior ventral IT lesions. There was partial concordance for the weak effect of the association between deficits in the recognition of fruits and vegetables and lesions in both temporal polar regions. (See Supplementary Material online for results with the reduced model, which are very similar).
Discussion
The lesion method in cognitive neuroscience is concerned with establishing reliable correlations between circumscribed regions of brain damage and specific changes in behavior and/or cognition. The lesion method uses brain lesions that result from neurologic disease to probe hypothesized large-scale systems supporting behavior and cognition (Damasio and Damasio, 1989; Damasio, 2000). The hypothesis that is tested is that a particular neural region is a necessary component of the neural system supporting a particular function. Conceptualized in this way, the lesion method is compatible with contemporary distributed systems models of brain function. Groups of subjects with similar damage are required to best establish this support, as are comparison subjects with damage elsewhere.
A prevalent and productive approach to voxelwise group-level lesion studies (including analyses we have performed in the past) has been to construct descriptive statistical maps (e.g. lesion overlap, lesion difference, lesion proportion, etc.) summarizing lesion-deficit associations, with the purpose of identifying the region(s) critical for the support of a particular function (Cancelliere and Kertesz, 1990; Damasio et al., 1996; Tranel et al., 1997; Adolphs et al., 2000; Barrash et al., 2000; Haaland et al., 2000; Adolphs et al., 2002; Dronkers et al., 2004; Heberlein et al., 2004). The region of maximal lesion overlap/difference is related to the deficit and typically hypothesized to be critical for the normal function. This inference has typically been made without formal statistical support at the voxel level.
Implementing an analysis of lesion-deficit correlation at the group level requires operationalizing both “deficit” and “lesion.” These constructs can be treated either dichotomously or continuously. Our approach treats both dichotomously. Behavioral measures are treated dichotomously when the hypothesis is that a region is critical for normal function. In related work, Karnath, Rorden and colleagues (Karnath et al, 2004; Rorden and Karnath, 2004) recently demonstrated voxelwise chi-square tests for the significant association of lesion and deficit. They also developed Voxel-based Analysis of Lesions (VAL) for analyzing dichotomized behavioral and lesion measures while covarying for lesion size or other covariates with logistic regression. This work can be thought of as an extension of MAP3-like approaches to allow modeling of confounding sources of variance. When investigations seek to characterize the degree of involvement of neural systems in higher function, as opposed to detecting a critical role, and if continuous behavioral measures are available, analyses employing continuous behavioral variables would be appropriate and may be more powerful (e.g. Voxel-based Lesion-Symptom Mapping, VLSM (Bates et al., 2003).
A detailed discussion of the treatment of “lesion” as a dichotomous vs. continuous construct is beyond the scope of our manuscript. There are pragmatic and conceptual reasons to support the approach of using dichotomous lesion variables. We note a recently proposed method (Tyler et al., 2005) that treats both lesion and behavioral data continuously. The theoretical and practical limitations (Mehta et al, 2006) of this method are incompletely explored. Other investigators have applied related approaches, i.e. “voxel based morphometry (VBM),” to investigating lesion-deficit relationships in degenerative conditions such as Alzheimer disease and semantic dementia, but also in focal lesions, such as herpes simplex encephalitis. We find the tissue segmentation and image registration operations that are required in the VBM processing pipeline to be problematic in the presence of focal lesions (cf. Mehta et al, 2003).
Here we develop an exact inferential statistic for the lesion overlap difference measure used in a previously published large MAP3 study (Damasio et al., 2004). We developed a parallel exact statistic for lesion proportion difference maps. Lesion-deficit relationships based on the latter measure could also be tested indirectly with a classic parametric chi-square test (e.g. Karnath et al., 2004b). However, since an exact statistic can be used for M3 and PM3, there is no reason to use an approximation such as a chisquare test with potential limits of validity. The statistical framework we used is similar to a Fisher exact test, but describes the specific sampling behavior of M3 and PM3 maps, under the null hypothesis of no lesion-deficit relationship. In this sense it is not redundant with a Fisher exact test, although the results obtained with the two approaches will be similar, as ultimately the significance of the effects are driven by the underlying two-by-two contingency table. Of note, our statistical framework can be easily adapted to most measures that can be derived from a two-by-two contingency table.
The use of these tests allowed us to reassess lesion-deficit relationships in a dataset acquired to probe the neural systems important for retrieving names and conceptual knowledge for concrete entities, and specifically to reassess the evidence for the partial segregation of these systems. It also allowed us to encourage formal attention to the issue of statistical power in lesion studies. Our effective coverage maps guided our interpretation of the results by dividing negative findings into those in which there is sufficient power and those where there is not, supporting or restricting the possibility of certain interpretative inferences.
Similarity and differences between previous and current results
Overall, this re-analysis continues to support the hypothesis, formulated in the original study (Damasio et al., 2004), that naming deficits are mostly related to lesions in the left hemisphere. It also corroborates the associations of:
deficits in recognition of persons with lesions in the right temporal pole and angular gyrus, and deficits in naming persons with lesions in the left temporal pole;
deficits in recognition of tools with left posterior IT lesions, in the region also associated with naming deficits for tools;
deficits in recognition of animals with lesions in bilateral mesial occipital and right posterior ventral IT, and deficits in naming animals with lesions in left anterior ventral IT, posterior lateral IT and inferior frontal gyrus / inferior pre-central gyrus.
We also found a significant association between damage in the left inferior parietal lobule and deficits in naming tools. This association was not evident in descriptive M3 maps, which presented only modest local maxima for tools in this region. We note that this relationship seems category-related, since significant effects were not found in this area for the other categories, and maps of effective coverage indicated no basic problem of statistical power in this area for any of them.
The thresholding of the M3 maps also highlights some substantial differences between the results reported here and the earlier findings. Notably, the thresholded results show that certain regions, not associated with M3 maxima, are associated with significant lesion-deficit relationships when the liberal threshold of p<0.05 is used. These findings include the following:
The anterior ventral IT sector identified on unthresholded M3 with impaired naming for animals and musical instruments is now associated with impairments in all categories;
Overlapping locations of lesions in left posterior IT and in the left ventral rolandic region are associated with deficits in naming for all categories of nonunique entities, although the association with deficits in naming musical instruments is less extensive;
Lesions in the left inferior frontal gyrus, previously seen only in association with deficits in animal naming, are now found to be associated with impariments in naming both animals and fruits/vegetables. Such association was not found for deficits in naming famous faces or nonunique manmade entities (musical instruments and tools). Furthermore, maps of effective coverage did not find a basic problem of statistical power at the chosen threshold for any category. This suggests that the left inferior frontal gyrus might be important for naming nonunique natural entities. We note that all these results were also suggested by unthresholded PM3 maps and confirmed by thresholded PM3 maps.
Interpretation of the differences
The discrepancies which sometimes appeared between locations of significant effects in thresholded maps and locations of local maxima in unthresholded M3 maps did not result from a mere difference in stringencies between the explicitly chosen threshold in the thresholded maps and the implicit thresholds corresponding to the maxima in the unthresholded M3 maps. The discrepencies also arise because the values of unthresholded lesion overlap difference maps (M3) are skewed with respect to their significance (or strength of depicted lesion-deficit association) due to basic normalization issues. As explained in the Methods section 1.1, M3 values with the same level of significance can be very different. The shift of the central tendency of the null distribution with respect to zero varies across voxels and between tests (i.e. effects of different categories of stimuli), as it depends strongly on lesion coverage and proportions of subject with and without deficit in the sample (which varied between tests in this study). For example, we found that there was a region in anterior IT for which all five categories were associated with significant effects related to deficit in naming at the chosen threshold, although this is something that could not be inferred from the consideration of the maxima on the unthresholded M3 maps (Figure 4).
This intrinsic bias does not exist in PM3. As a result, null distributions of PM3 are better centered around zero and therefore there is congruence between the sign of the observed maxima and the direction of their statistical significance. Thus the IT region mentioned above showed clear positive values for all categories in the PM3 unthresholded maps, agreeing with the thresholded results of the M3 and PM3 maps. Nevertheless, the exact inferential statistical framework was necessary to demonstrate the significance of this relationship. Thus, both the descriptive and the thresholded PM3 maps support the partial segregation found earlier, and add regions in which lesions disrupt naming of most categories tested. This suggests that the naming processes share a basic circuitry, and recruit additional regions depending on the category involved.
Limits placed on interpretation by limited effective coverage
Substantial portions of the brain were not associated with enough statistical power to show significant effects, even for the most liberal threshold (p < 0.05 uncorrected). The lack of power in some regions, such as the anterior cerebral artery territory (ACA), is not unexpected. Lesions in this territory are seen less frequently than those in other vascular territories, and subjects with damage in the ACA territory very often have bilateral lesions and would therefore be excluded by the criteria used in the study. Our study was designed to test hypotheses about correlates of recognition and naming impairments in the perisylvian region and therefore this lack of coverage in the ACA territory did not cause a fundamental scientific problem. However, the regions of critically low statistical power included part of the left posterior ventral and mesial IT, which is pertinent to studies of lexical retrieval (Murtha et al., 1999; Graves et al., 2007). Our data thus cannot be used to make inferences about the degree to which these regions may be critical for name retrieval. As a consequence it is not possible to reconcile our lesion results with those of functional imaging studies that have implicated this region in naming (Murtha et al., 1999; Tranel et al., 2003b; Tranel et al., 2005; Graves et al., 2007). Interestingly, the more anterior sector of IT that we do implicate corresponds to a region where magnetic susceptibility effects cause signal dropout in echoplanar fMRI. If low effective coverage in posterior IT turns out to reflect the natural distribution of lesions at the level of the population, we are confronted with reciprocal weaknesses between lesion and fMRI methods with respect to their sensitivity in these regions. Special methods to image these regions in fMRI experiments, e.g. susceptibility-mitigating MRI pulse sequences, can be used, but the anatomic sampling issues with the lesion method might be more difficult to solve. Low effective coverage also affected the weight of the evidence for lateralization of systems critical for recognizing animals. Specifically, the evidence for rightward lateralization in our dataset turns out to be weakened by low effective coverage on the left, such that we are unable to definitively exclude the presence of a correlation on the left.
General Statistical Issues
Implications of low statistical power in lesion studies
The lack of statistical power calls for a substantial increase in the number of subjects included in lesion-studies, if both sensitivity and specificity are to be achieved at every voxel. Unfortunately the sample size increase called for might be an order of magnitude, or more, and this will be challenging to achieve for obvious reasons.
If globally satisfactory effective coverage is not present, explicitly determining effective coverage can at least help avoid being misled by a topographical distribution of effects which may reflect the topography of statistical power, as opposed to the boundaries of relevant functional-anatomical systems, or the heterogeneity of power across conditions. Because of the crucial insight provided by effective coverage maps (or more generally power maps), we strongly suggest that when inferential statistics are used in voxelwise lesion-deficit statistical mapping, these or other power maps be included in the reports (see below). The ECMs we used were generated from maximum effect coverage maps based on our statistical models, but analogous maps (or maps of statistical power) could in principle be created for any type of statistical approaches applied to lesion-deficit statistical mapping. Maps of the minimal lesion overlap difference (or lesion proportion differences) necessary to reach a given threshold could also be easily generated. These maps would describe, voxelwise, the magnitude of the effect needed to reach statistical significance at a certain threshold.
We selected a low threshold for significance (one-tailed, uncorrected p < 0.05) based on the effective coverage maps, which indicated that higher thresholds would lead to a critical loss in sensitivity (with an increased risk of Type II error), and, importantly, this loss in sensitivity would be regionally heterogeneous. As effective coverage maps indicated, the choice of an alpha of uncorrected 0.001, such as is often used in functional brain imaging, was too stringent, with respect to effective coverage. In other words, low effective coverage, unavoidable at stringent thresholds, defeats the purpose of whole brain analysis, though restricted effective coverage may not be a problem when there are strong a priori anatomic hypotheses. This problem of low effective coverage is exacerbated by attempting to control for family-wise type I error (i.e. control multiple comparison problem). Thus to preserve a reasonable degree of sensitivity and limit the impact of spatial bias due to heterogeneity in effective coverage, more liberal thresholds to maximize effective coverage may be pragmatic. This position is in line with recent recommendations for reporting standards in functional neuroimaging, favoring sensitivity over specificity, notably to avoid illusory focal effects due to high rates of false negatives (Poline et al., 2006). The problem of such artifactually focal effects relates to the more general issue of making inferences about the segregation of neural systems, in which the interpretation of the “location” of significant effects is implicitly influenced by surrounding nonsignificant effects.
The multiple comparisons problem
In our study, the aim of having enough sensitivity led us to relax the constraint of specificity and adopt a standard uncorrected threshold corresponding to p < 0.05. The same alpha threshold was used in the logistic regression in Karnath et al. (2004). It is important to acknowledge that the method proposed here does not include a suitable solution to correct for the problem of multiple comparisons that result from multiple voxel analysis. So far, all proposed lesion-deficit mapping methods using dichotomized lesion variables have the same limitation (Bates et al. 2003; Karnath et al. 2004). Future work should address the impact of multiple comparison correction methods on effective coverage. One possible direction is to evaluate and take advantage of the limited spatial resolution of the lesions encountered in lesion-deficit statistical mapping studies, in order to define further heuristics of control for multiple comparisons which would not lead to a dramatic loss in effective coverage. Another strategy for dichotomized approaches is to adopt the false discovery rate but it might still be too stringent to obtain satisfying effective coverage. The voxel-based correlation (VBC) method proposed by Tyler et al (2005) borrows a technique from functional imaging for correcting for multiple comparisons based on random field theory which is not appropriate for discrete lesion data.
Investigating spatial segregation of systems: a statistical paradox
Comparing independently thresholded maps, using for instance conjunction-disjunction analyses, does not constitute a true statistical test for spatial segregation, since it does not explicitly control for random spatial factors. Unfortunately, there is no better solution so far regarding this issue. The ability to ascertain spatial segregation is related to a more general issue with quantifying the “spatial resolution” of the lesion method. Several related factors are at play here:
The confidence/error to declare a standard space voxel as a lesioned voxel in a given subject (Fiez et al, 2001).
The variable, but usually large size of acquired destructive brain lesions (see also below).
The complex “spatial autocorrelation” of such lesions. For example, since the insula is in the core of the middle cerebral artery territory, insular damage commonly correlates with damage in adjacent locations, and the damage may be co-attributed to the insula by these methods (Hillis et al, 2004).
A full treatment of these issues is beyond the scope of this manuscript, and is an important target of future work.
At the chosen threshold of p < 0.05, we found less evidence for spatial segregation in IT than previously observed (Damasio et al., 1996; Damasio et al., 2004). We used a liberal threshold, and perhaps a more stringent threshold would have supported further spatial segregation. However, we also have to acknowledge that we could not use more stringent threshold because of basic problems with statistical power, as indicated by the ECMs. At more stringent thresholds, heterogeneity in power across conditions (i.e. across the different categories of concrete entities) could have led to spurious effects of spatial segregation. Across conditions there are different numbers of subjects and different proportions of subjects with or without deficits, so that the risk of Type II errors (false negatives) can differ from one condition to the other at the same voxel. Therefore, significant results at a particular brain location, for a particular category of concrete entities, can simply reflect variations in statistical power, rather than a specialization of the region for processing the given category. On the other hand, at lower thresholds significant clusters are larger and thus spatial segregation is less likely to be identified. As a result, when spatial segregation is to be assessed and there are reasons to believe that statistical power might differ across conditions, lowering the threshold of the individual tests will lower the risk of false positives regarding the spatial segregation itself, but may obscure the detection of possible segregation.
Sampling limitations and consequences for lesion-studies
Effective coverage maps can be used to define adequate thresholds based on an informed trade off between sensitivity and specificity. In cases where specific regional hypotheses are formulated, effective coverage maps can be used to define the most stringent possible threshold in which the regions of interest are still covered. This decision cannot be based on raw lesion coverage, since it is neither synonymous with nor proportional to effective coverage.
Inconveniently, both exploratory and hypothesis-driven studies face the basic problem of effective coverage heterogeneity, which is virtually inherent in the lesion method. Vascular lesions are the best material to use for such studies, given the circumscribed nature of the damage. However, the natural distribution of these lesions is very uneven and leaves many coverage “holes” that are difficult to fill, such as the anterior temporal lobe (Crinion et al., 2006). In order to reduce the impact of such limitations, our group has chosen for many years to include in our samples lesions caused by nonischemic mechanisms. We thus include lesions caused by lobectomy, resection of noninvasive tumors, or herpes simplex virus encephalitis (HSV), in addition to stroke lesions, to increase coverage. These additional lesion mechanisms, like ischemic stroke, all result in acquired, destructive, circumscribed, and stable lesions (See Damasio and van Hoesen, 1985) for example, for evidence of the circumscribed, destructive, nature of post herpetic lesions). We exclude lesions that cause poorly circumscribed, incomplete, and actively progressing tissue alteration, such as semantic dementia.
One might wonder whether selective inclusion of subjects with lesions in low coverage areas, if possible, would allow increasing effective coverage without having to increase dramatically the total N. This approach is problematic for the following reasons: First, because of the interactions between the relevant parameters (number of subjects with deficits and number of subjects with lesions at a given voxel) in the determination of power, just increasing the proportion of subjects with a lesion at a voxel will not necessarily increase power (i.e. it is also important that the number of subjects with damage elsewhere and no impairment also increases). Second, in the statistical framework used here, such a selective inclusion would be invalid for the full model approach, in which the statistical procedure explicitly models a process of sampling from a population of reference (that of the subjects with lesion of the same type as included in the sample). As a result, the sample of subjects in the sample must be representative of the population of reference. This concerns in particular the proportion of subjects with a lesion at a given voxel and the proportion of subjects with a deficit. Only an unbiased sampling with respect to the population of reference allows an unbiased estimate (through maximum likelihood) of these proportions. Therefore the only way to increase power validly is to increase the total N using the same criteria of inclusion.
Estimates of the N necessary to reach a certain level of statistical power can be computed. Such computations could potentially be used to determine the feasability of studies, and to inform the allocation of resources and the strategies of cooperation between centers. Such multicenter research could be envisioned, but the adequate standardization of behavioral and lesion mapping protocols is not necessarily easy to implement.
Controlling for lesion size?
The method proposed here does not permit an explicit control for lesion size. Because lesion size tends to be large and may interact with location of lesion due to the nature of the causative disease processes, localizing ability may be reduced and spatially heterogeneous. We and others have used approaches such as logistic regressions (cf. Karnath et al, 2004a; Naqvi et al., 2007), which allow inclusion of regressors quantifying lesion size, and we have proposed weighting lesion maps by the degree of impairment (Frank et al., 1997). However, controlling for lesion size is not straightforward, since a meaningful concept of lesion size must simultaneously take account of lesion location. In other words, what counts is not the raw size of the lesion, but the extent of the lesion in the neural system that supports a process of interest. Thus the use of omnibus lesion size regressors can be misleading. If, for instance, a process disrupted because of brain damage is lateralized, and a lesion size regressor is entered in the regression model, it is likely that this regressor won’t explain much variance and reduce much confound, since many large lesions in the noncritical hemisphere will not be associated with deficit. This will reduce critically the correlation between the lesion-size regressor and deficits, even if such a correlation exists in the critical hemisphere.
M3 versus PM3, Full Model versus Reduced Model
The different statistical approaches we have discussed lead to similar results (full or reduced model, M3 or PM3). We briefly discuss the choice of one versus the other.
Full-Model versus Reduce-Model Approaches
The decision to adopt the full model versus the reduced model is not necessarily straightforward. On the one hand, if one is confident with using the maximum likelihood criterion for estimating the parameters of the binomial formula, one should use the full model ,as it accounts for the effect of sampling from a population on the observed samples. The reduced model provides an exact statistical framework modeling an exhaustive process of resampling within the observed sample. This latter approach tends however to produce lower statistical power (See Supplementary Material online) and to under-represent certain types of samples, as it depends only on the observed sample and assumes certain parameters to be constant (namely, the number of deficits in the sample and the number of lesions at a given voxel). These parameters are, in fact, variables when the process of sampling from the parent population is fully taken into account.
M3 versus PM3 Approaches
As discussed above, considering unthresholded maps, PM3 might appear a better solution than the previously used M3, as it is unbiased and show local maxima distribution which better reflect significance.
Although PM3 has the advantage that its null distributions are centered around zero, there are some potential disadvantages of using PM3. PM3 null distributions behave in a more complex manner than those of M3, which are generally smooth and symmetrical. PM3 null distributions often show multiple modes and lobes and a strong asymmetry, which might not be desirable because this can lead to important jumps in the thresholded results for small changes in the chosen threshold (see Supplementary Material online). Despite these complexities of the distribution, in practice the thresholded PM3 maps are corroborated by thresholded M3 maps. We recommend using PM3 because the relationship between its descriptive and thresholded modes is much more transparent.
Suggested practical strategy to approach lesion-deficit statistical mapping in the context of low statistical power
In order to control or at least acknowledge limitations due to statistical power, and make informed decision regarding the choice of a realistic threshold based on a trade off between sensitivity and specificity, we propose the following strategy for lesion studies that use voxelwise lesion-deficit statistical mapping. First, such studies could be based on and could start their reports with effective coverage maps or other indirect or direct assessment of statistical power. This would help to identify the regions of the brain where statement could be supported at a given threshold. The effective coverage maps can be used to adaptively choose a particular significance threshold. The stringency of the threshold that may be used will practically depend on whether a priori anatomic hypotheses correspond to regions of satisfactory effective coverage. In the case of exploratory studies (e.g whole brain analysis) lower thresholds with a higher risk of type I error are likely to be required. Second, the data could be thresholded according to the choice initially made, and be interpreted in the context of such maps. Another option is to use multiple and report the results for the different thresholds along with the corresponding effective coverage maps. This would allow fine-tuned and well informed assessment of the statistical significance of the results.
Conclusions
We developed exact inferential statistics for the lesion proportion difference PM3 and the lesion difference M3 for lesion studies in cognitive neuroscience. A related key development is the definition of “effective coverage,” a proxy for statistical power. We demonstrate the importance of considering effective coverage in designing and interpreting lesion studies.
Lesion proportion difference (PM3) is an unbiased descriptive statistic and PM3 maps straightforwardly reflect the pattern of local maxima after significance thresholding. It should be preferred to the simple lesion difference (M3) as a measure of lesion-deficit relationships.
Group-level lesion mapping studies are profoundly influenced by the heterogeneous sampling of the analysis space. Type I error rates can be controlled by appropriate inferential statistics, but homogeneity of statistical power cannot be practically achieved. There is an unavoidable trade-off between effective coverage and control of type I error. We strongly suggest that, when lesion-deficit relationships are explored with inferential statistics over an extended search volume, or the whole brain, that presentation of voxelwise maps of effective coverage, or another proxy for power be incorporated in the report
The application of the methods to a lesion study of the correlates of impaired recognition and naming of concrete entities supported most of the findings in the original study (Damasio et al., 2004). 1) Naming deficits are mostly related to lesions in the left hemisphere. 2) Deficits in recognition of persons’ faces are associated with lesions in the right temporal pole and angular gyrus, while deficits in naming persons from faces are associated with lesions in the left temporal pole. 3) Deficits in both recognition and naming of tools are associated with left posterior IT lesions. 4) Deficits in recognition of animals are associated with lesions in both mesial occipital regions and in right posterior ventral IT. Deficits in naming animals are associated with lesions in left anterior ventral IT, posterolateral IT and inferior frontal gyrus / inferior pre-central gyrus.
The new approaches enabled us to appreciate other relationships not apparent in descriptive M3 maps. For example, we found a significant association between damage in the left inferior parietal lobule and deficits in naming tools. Generally, the evidence for segregation of neural regions implicated in deficits in naming in some conceptual categories appeared reduced under the new analysis, especially for categories of nonunique entities. Specifically: 1) A sector of left anterior IT is associated with naming impairments in all five categories of concrete entities that we tested. 2) Sectors of left posterior IT and the left ventral rolandic region are associated with naming impairments in all four categories of nonunique entities that we tested. 3) A sector of the left inferior frontal gyrus appears to be associated with naming impariments for both animals and fruits/vegetables, suggesting that the left inferior frontal gyrus might be important for naming nonunique natural entities. These findings identify specific shared and segregated components of neural systems critical for lexical retrieval for categories of concrete entities.
Supplementary Material
Footnotes
Publisher's Disclaimer: This is a PDF file of an unedited manuscript that has been accepted for publication. As a service to our customers we are providing this early version of the manuscript. The manuscript will undergo copyediting, typesetting, and review of the resulting proof before it is published in its final citable form. Please note that during the production process errors may be discovered which could affect the content, and all legal disclaimers that apply to the journal pertain.
References
- Adolphs R, Damasio H, Tranel D. Neural systems for recognition of emotional prosody: a 3-D lesion study. Emotion. 2002;2:23–51. doi: 10.1037/1528-3542.2.1.23. [DOI] [PubMed] [Google Scholar]
- Adolphs R, Damasio H, Tranel D, Cooper G, Damasio AR. A role for somatosensory cortices in the visual recognition of emotion as revealed by threedimensional lesion mapping. J Neurosci. 2000;20:2683–2690. doi: 10.1523/JNEUROSCI.20-07-02683.2000. [DOI] [PMC free article] [PubMed] [Google Scholar]
- Barrash J, Damasio H, Adolphs R, Tranel D. The neuroanatomical correlates of route learning impairment. Neuropsychologia. 2000;38:820–836. doi: 10.1016/s0028-3932(99)00131-1. [DOI] [PubMed] [Google Scholar]
- Bates E, Wilson SM, Saygin AP, Dick F, Sereno MI, Knight RT, Dronkers NF. Voxel-based lesion-symptom mapping. Nat Neurosci. 2003;6:448–450. doi: 10.1038/nn1050. [DOI] [PubMed] [Google Scholar]
- Cancelliere AE, Kertesz A. Lesion localization in acquired deficits of emotional expression and comprehension. Brain Cogn. 1990;13:133–147. doi: 10.1016/0278-2626(90)90046-q. [DOI] [PubMed] [Google Scholar]
- Crinion JT, Warburton EA, Lambon-Ralph MA, Howard D, Wise RJ. Listening to narrative speech after aphasic stroke: the role of the left anterior temporal lobe. Cereb Cortex. 2006;16:1116–1125. doi: 10.1093/cercor/bhj053. [DOI] [PubMed] [Google Scholar]
- Damasio AR, Van Hoesen GW. The limbic system and the localisation of herpes simplex encephalitis. J Neurol Neurosurg Psychiatry. 1985;48:297–301. doi: 10.1136/jnnp.48.4.297. [DOI] [PMC free article] [PubMed] [Google Scholar]
- Damasio H. Human brain anatomy in computerized images. Oxford, New York: Oxford University Press; 1995. [Google Scholar]
- Damasio H, Damasio A. Lesion analysis in neuropsychology. New York: Oxford University Press; 1989. [Google Scholar]
- Damasio H, Frank R. Three-dimensional in vivo mapping of brain lesions in humans. Arch Neurol. 1992;49:137–143. doi: 10.1001/archneur.1992.00530260037016. [DOI] [PubMed] [Google Scholar]
- Damasio H, Grabowski TJ, Tranel D, Hichwa RD, Damasio AR. A neural basis for lexical retrieval. Nature. 1996;380:499–505. doi: 10.1038/380499a0. [DOI] [PubMed] [Google Scholar]
- Damasio H, Tranel D, Grabowski T, Adolphs R, Damasio A. Neural systems behind word and concept retrieval. Cognition. 2004;92:179–229. doi: 10.1016/j.cognition.2002.07.001. [DOI] [PubMed] [Google Scholar]
- Dronkers NF, Wilkins DP, Van Valin RD, Jr, Redfern BB, Jaeger JJ. Lesion analysis of the brain areas involved in language comprehension. Cognition. 2004;92:145–177. doi: 10.1016/j.cognition.2003.11.002. [DOI] [PubMed] [Google Scholar]
- Fiez JA, Damasio H, Grabowski TJ. Lesion segmentation and manual warping to a reference brain: intra and inter observer reliability. Hum Brain Mapp. 2000;9:192–211. doi: 10.1002/(SICI)1097-0193(200004)9:4<192::AID-HBM2>3.0.CO;2-Y. [DOI] [PMC free article] [PubMed] [Google Scholar]
- Frank RJ, Damasio H, Grabowski TJ. Brainvox: an interactive, multimodal visualization and analysis system for neuroanatomical imaging. Neuroimage. 1997;5:13–30. doi: 10.1006/nimg.1996.0250. [DOI] [PubMed] [Google Scholar]
- Graves WW, Grabowski TJ, Mehta S, Gordon JK. A neural signature of phonological access: distinguishing the effects of word frequency from familiarity and length in overt picture naming. J Cogn Neurosci. 2007;19:617–631. doi: 10.1162/jocn.2007.19.4.617. [DOI] [PubMed] [Google Scholar]
- Haaland KY, Harrington DL, Knight RT. Neural representations of skilled movement. Brain. 2000;123(Pt 11):2306–2313. doi: 10.1093/brain/123.11.2306. [DOI] [PubMed] [Google Scholar]
- Heberlein AS, Adolphs R, Tranel D, Damasio H. Cortical regions for judgments of emotions and personality traits from point-light walkers. J Cogn Neurosci. 2004;16:1143–1158. doi: 10.1162/0898929041920423. [DOI] [PubMed] [Google Scholar]
- Hillis AE, Work M, Barker PB, Jacobs MA, Breese EL, Maurer K. Re-examining the brain regions crucial for orchestrating speech articulation. Brain. 2004 Jul;127(Pt 7):1479–1487. doi: 10.1093/brain/awh172. [DOI] [PubMed] [Google Scholar]
- Karnath HO, Fruhmann Berger M, Kuker W, Rorden C. The anatomy of spatial neglect based on voxelwise statistical analysis: a study of 140 patients. Cereb Cortex. 2004a;14:1164–1172. doi: 10.1093/cercor/bhh076. [DOI] [PubMed] [Google Scholar]
- Karnath HO, Fruhmann Berger M, Zopf R, Kuker W. Using SPM normalization for lesion analysis in spatial neglect. Brain. 2004b;127:E10. doi: 10.1093/brain/awh111. author reply E11. [DOI] [PubMed] [Google Scholar]
- Murtha S, Chertkow H, Beauregard M, Evans A. The neural substrate of picture naming. J Cogn Neurosci. 1999;11:399–423. doi: 10.1162/089892999563508. [DOI] [PubMed] [Google Scholar]
- Naqvi NH, Rudrauf D, Damasio H, Bechara A. Damage to the insula disrupts addiction to cigarette smoking. Science. 2007;315:531–534. doi: 10.1126/science.1135926. [DOI] [PMC free article] [PubMed] [Google Scholar]
- Poline JB, Strother SC, Dehaene-Lambertz G, Egan GF, Lancaster JL. Motivation and synthesis of the FIAC experiment: Reproducibility of fMRI results across expert analyses. Hum Brain Mapp. 2006;27:351–359. doi: 10.1002/hbm.20268. [DOI] [PMC free article] [PubMed] [Google Scholar]
- Rorden C, Karnath HO. Using human brain lesions to infer function: a relic from a past era in the fMRI age? Nat Rev Neurosci. 2004;5:813–819. doi: 10.1038/nrn1521. [DOI] [PubMed] [Google Scholar]
- Tranel D. The Iowa-Benton school of neuropsychological assessment. In: Grant I, Adams KM, editors. Neuropsychological assessment of neuropsychiatric disorders. 2nd ed. New York: Oxford University Press; 1996. pp. 81–101. [Google Scholar]
- Tranel D, Damasio H, Damasio AR. A neural basis for the retrieval of conceptual knowledge. Neuropsychologia. 1997;35:1319–1327. doi: 10.1016/s0028-3932(97)00085-7. [DOI] [PubMed] [Google Scholar]
- Tranel D, Adolphs R, Damasio H, Damasio A. A neural basis for the retrieval of words for actions. Cognitive Neuropsychology. 2001;18:655–670. doi: 10.1080/02643290126377. [DOI] [PubMed] [Google Scholar]
- Tranel D, Grabowski TJ, Lyon J, Damasio H. Naming the same entities from visual or from auditory stimulation engages similar regions of left inferotemporal cortices. J Cogn Neurosci. 2005;17:1293–1305. doi: 10.1162/0898929055002508. [DOI] [PubMed] [Google Scholar]
- Tranel D, Kemmerer D, Damasio H, Adolphs R, Damasio A. Neural correlates of conceptual knowledge for actions. Cognitive Neuropsychology. 2003a;20:409–432. doi: 10.1080/02643290244000248. [DOI] [PubMed] [Google Scholar]
- Tranel D, Damasio H, Eichhorn GR, Grabowski T, Ponto LL, Hichwa RD. Neural correlates of naming animals from their characteristic sounds. Neuropsychologia. 2003b;41:847–854. doi: 10.1016/s0028-3932(02)00223-3. [DOI] [PubMed] [Google Scholar]
- Tyler LK, Marslen-Wilson W, Stamatakis EA. Dissociating neuro-cognitive component processes: voxel-based correlational methodology. Neuropsychologia. 2005;43:771–778. doi: 10.1016/j.neuropsychologia.2004.07.020. [DOI] [PubMed] [Google Scholar]
Associated Data
This section collects any data citations, data availability statements, or supplementary materials included in this article.