Abstract
We study the distributions of citations received by a single publication within several disciplines, spanning broad areas of science. We show that the probability that an article is cited c times has large variations between different disciplines, but all distributions are rescaled on a universal curve when the relative indicator cf = c/c0 is considered, where c0 is the average number of citations per article for the discipline. In addition we show that the same universal behavior occurs when citation distributions of articles published in the same field, but in different years, are compared. These findings provide a strong validation of cf as an unbiased indicator for citation performance across disciplines and years. Based on this indicator, we introduce a generalization of the h index suitable for comparing scientists working in different fields.
Keywords: bibliometrics, analysis, h index
Citation analysis is a bibliometric tool that is becoming increasingly popular to evaluate the performance of different actors in the academic and scientific arena, ranging from individual scholars (1–3), to journals, departments, universities (4), and national institutions (5), up to whole countries (6). The outcome of such analysis often plays a crucial role in deciding which grants are awarded, how applicants for a position are ranked, and even the fate of scientific institutions. It is then crucial that citation analysis is carried out in the most precise and unbiased way.
Citation analysis has a very long history and many potential problems have been identified (7–9), the most critical being that often a citation does not—nor it is intended to—reflect the scientific merit of the cited work (in terms of quality or relevance). Additional sources of bias are, to mention just a few, self-citations, implicit citations, the increase in the total number of citations with time, or the correlation between the number of authors of an article and the number of citations it receives (10).
In this work we consider one of the most relevant factors that may hamper a fair evaluation of scientific performance: field variation. Publications in certain disciplines are typically cited much more or much less than in others. This may happen for several reasons, including uneven number of cited papers per article in different fields or unbalanced cross-discipline citations (11). A paradigmatic example is provided by mathematics: the highest 2006 impact factor (IF) (12) for journals in this category (Journal of the American Mathematical Society) is 2.55, whereas this figure is 10 times larger or more in other disciplines (for example, in 2006, New England Journal of Medicine had IF 51.30, Cell had IF 29.19, and Nature and Science had IF 26.68 and 30.03, respectively).
The existence of this bias is well-known (8, 10, 12) and it is widely recognized that comparing bare citation numbers is inappropriate. Many methods have been proposed to alleviate this problem (13–17). They are based on the general idea of normalizing citation numbers with respect to some properly chosen reference standard. The choice of a suitable reference standard, which can be a journal, all journals in a discipline, or a more complicated set (14), is a delicate issue (18). Many possibilities exist also in the detailed implementation of the standardization procedure. Some methods are based on ranking articles (scientists, research groups) within one field and comparing relative positions across disciplines. In many other cases relative indicators are defined, that is, ratios between the bare number of citations c and some average measure of the citation frequency in the reference standard. A simple example is the Relative Citation Rate of a group of articles (13), defined as the total number of citations they received, divided by the weighted sum of impact factors of the journals where the articles were published. The use of relative indicators is widespread, but empirical studies (19–21) have shown that distributions of article citations are very skewed, even within single disciplines. One may wonder then whether it is appropriate to normalize by the average citation number, which gives only very limited characterization of the whole distribution. We address this issue in this article.
The problem of field variation affects the evaluation of performance at many possible levels of detail: publications, individual scientists, research groups, and institutions. Here, we consider the simplest possible level, the evaluation of citation performance of single publications. When considering individuals or research groups, additional sources of bias (and of arbitrariness) exist that we do not tackle here. As reference standard for an article, we consider the set of all articles published in journals that are classified in the same Journal of Citation Report scientific category of the journal where the publication appears (see details in Methods). We take as normalizing the quantity for citations of articles belonging to a given scientific field to be the average number c0 of citations received by all articles in that discipline published in the same year. We perform an empirical analysis of the distribution of citations for publications in various disciplines and we show that the large variability in the number of bare citations c is fully accounted for when cf = c/c0 is considered. The distribution of this relative performance index is the same for all fields. No matter whether, for instance, Developmental Biology, Nuclear Physics, or Aerospace Engineering are considered, the chance of having a particular value of cf is the same. Moreover, we show that cf allows us to properly take into account the differences, within a single discipline, between articles published in different years. This provides a strong validation of the use of cf as an unbiased relative indicator of scientific impact for comparison across fields and years.
Variability of Citation Statistics in Different Disciplines
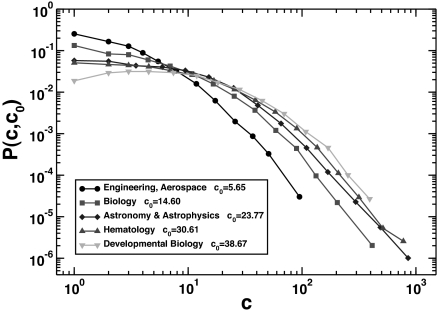
First, we show explicitly that the distribution of the number of articles published in some year and cited a certain number of times strongly depends on the discipline considered. In Fig. 1 we plot the normalized distributions of citations to articles that appeared in 1999 in all journals belonging to several different disciplines according to the Journal of Citation Reports classification.
Fig. 1.
Normalized histogram of the number of articles P(c,c0) published in 1999 and having received c citations. We plot P(c,c0) for several scientific disciplines with different average number c0 of citations per article.
From this figure it is apparent that the chance of a publication being cited strongly depends on the category the article belongs to. For example, a publication with 100 citations is ≈50 times more common in Developmental Biology than in Aerospace Engineering. This has obvious implications in the evaluation of outstanding scientific achievements: the simple count of the number of citations is patently misleading to assess whether a article in Developmental Biology is more successful than one in Aerospace Engineering.
Distribution of the Relative Indicator cf
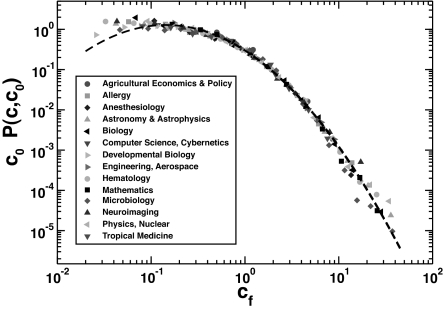
A first step toward properly taking into account field variations is to recognize that the differences in the bare citation distributions are essentially not due to specific discipline-dependent factors, but are instead related to the pattern of citations in the field, as measured by the average number of citations per article c0. It is natural then to try to factor out the bias induced by the difference in the value of c0 by considering a relative indicator, that is, measuring the success of a publication by the ratio cf = c/c0 between the number of citations received and the average number of citations received by articles published in its field in the same year. Fig. 2 shows that this procedure leads to a very good collapse of all curves for different values of c0 onto a single shape. The distribution of the relative indicator cf then seems universal for all categories considered and resembles a lognormal distribution. To make these observations more quantitative, we have fitted each curve in Fig. 2 for cf ≥ 0.1 with a lognormal curve
where the relation σ2 = −2μ, because the expected value of the variable cf is 1, reduces the number of fitting parameters to 1. All fitted values of σ2, reported in Table 1, are compatible within 2 standard deviations, except for one (Anesthesiology) that is, in any case, within 3 standard deviations of all of the others. Values of χ2 per degree of freedom, also reported in Table 1, indicate that the fit is good. This allows us to conclude that, in rescaling the distribution of citations for publications in a scientific discipline by their average number, a universal curve is found, independent of the specific discipline. Fitting a single curve for all categories, a lognormal distribution with σ2 = 1.3 is found, which is reported in Fig. 2.
Fig. 2.
Rescaled probability distribution c0 P(c,c0) of the relative indicator cf = c/c0, showing that the universal scaling holds for all scientific disciplines considered (see Table 1). The dashed line is a lognormal fit with σ2 = 1.3.
Table 1.
List of all scientific disciplines considered in this article
| Index | Subject category | Year | Np | c0 | cmax | σ2 | χ2/df |
|---|---|---|---|---|---|---|---|
| 1 | Agricultural economics and policy | 1999 | 266 | 6.88 | 42 | 1.0 (1) | 0.007 |
| 2 | Allergy | 1999 | 1,530 | 17.39 | 271 | 1.4 (2) | 0.012 |
| 3 | Anesthesiology | 1999 | 3,472 | 13.25 | 282 | 1.8 (2) | 0.009 |
| 4 | Astronomy and astrophysics | 1999 | 7,399 | 23.77 | 1,028 | 1.1 (1) | 0.003 |
| 5 | Biology | 1999 | 3,400 | 14.6 | 413 | 1.3 (1) | 0.004 |
| 6 | Computer science, cybernetics | 1999 | 704 | 8.49 | 100 | 1.3 (1) | 0.004 |
| 7 | Developmental biology | 1999 | 2,982 | 38.67 | 520 | 1.3 (3) | 0.002 |
| 8 | Engineering, aerospace | 1999 | 1,070 | 5.65 | 95 | 1.4 (1) | 0.003 |
| 9 | Hematology | 1990 | 4,423 | 41.05 | 1,424 | 1.5 (1) | 0.002 |
| 10 | Hematology | 1999 | 6,920 | 30.61 | 966 | 1.3 (1) | 0.004 |
| 11 | Hematology | 2004 | 8,695 | 15.66 | 1,014 | 1.3 (1) | 0.003 |
| 12 | Mathematics | 1999 | 8,440 | 5.97 | 191 | 1.3 (4) | 0.001 |
| 13 | Microbiology | 1999 | 9,761 | 21.54 | 803 | 1.0 (1) | 0.005 |
| 14 | Neuroimaging | 1990 | 444 | 25.26 | 518 | 1.1 (1) | 0.004 |
| 15 | Neuroimaging | 1999 | 1,073 | 23.16 | 463 | 1.4 (1) | 0.003 |
| 16 | Neuroimaging | 2004 | 1,395 | 12.68 | 132 | 1.1 (1) | 0.005 |
| 17 | Physics, nuclear | 1990 | 3,670 | 13.75 | 387 | 1.4 (1) | 0.001 |
| 18 | Physics, nuclear | 1999 | 3,965 | 10.92 | 434 | 1.4 (4) | 0.001 |
| 19 | Physics, nuclear | 2004 | 4,164 | 6.94 | 218 | 1.4 (1) | 0.001 |
| 20 | Tropical medicine | 1999 | 1,038 | 12.35 | 126 | 1.1 (1) | 0.017 |
For each category we report the total number of articles Np, the average number of citations c0, the maximum number of citations cmax, the value of the fitting parameter σ2 in Eq.1, and the corresponding χ2 per degree of freedom (df). Data refer to articles published in journals listed by Journal of Citation Reports under a specific subject category.
Interestingly, a similar universality for the distribution of the relative performance is found, in a totally different context, when the number of votes received by candidates in proportional elections is considered (22). In that case, the scaling curve is also well-fitted by a lognormal with parameter σ2 ≈ 1.1. For universality in the dynamics of academic research activities, see also ref. 23.
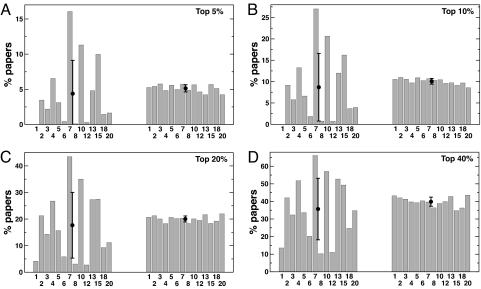
The universal scaling obtained provides a solid grounding for comparison between articles in different fields. To make this even more visually evident, we have ranked all articles belonging to a pool of different disciplines (spanning broad areas of science) according either to c or to cf. We have then computed the percentage of publications of each discipline that appear in the top z% of the global rank. If the ranking is fair, the percentage for each discipline should be ≈z% with small fluctuations. Fig. 3 clearly shows that when articles are ranked according to the unnormalized number of citations c, there are wide variations among disciplines. Such variations are dramatically reduced, instead, when the relative indicator cf is used. This occurs for various choices of the percentage z. More quantitatively, assuming that articles of the various disciplines are scattered uniformly along the rank axis, one would expect the average bin height in Fig. 3 to be z% with a standard deviation
 |
where Nc is the number of categories and Ni the number of articles in the ith category. When the ranking is performed according to cf = c/c0, we find (Table 2) a very good agreement with the hypothesis that the ranking is unbiased, but strong evidence that the ranking is biased when c is used. For example, for z = 20%, σz = 1.15% for cf-based ranking, whereas σz = 12.37% if c is used, as opposed to the value σz = 1.09% in the hypothesis of unbiased ranking. Figs. 2 and 3 allow us to conclude that cf is an unbiased indicator for comparing the scientific impact of publications in different disciplines.
Fig. 3.
We rank all articles according to the bare number of citations c and the relative indicator cf. We then plot the percentage of articles of a particular discipline present in the top z% of the general ranking, for the rank based on the number of citations (A and C) and based on the relative indicator cf (B and D). Different values of z (different graphs) lead to a very similar pattern of results. The average values and the standard deviations of the bin heights shown are also reported in Table 2. The numbers identify the disciplines as they are indicated in Table 1.
Table 2.
Average and standard deviation for the bin heights in Fig. 3
| z | σz (theor) | z (c) | σz (c) | z (cf) | σz (cf) |
|---|---|---|---|---|---|
| 5 | 0.59 | 4.38 | 4.73 | 5.14 | 0.51 |
| 10 | 0.81 | 8.69 | 7.92 | 10.07 | 0.67 |
| 20 | 1.09 | 17.68 | 12.37 | 20.03 | 1.15 |
| 40 | 1.33 | 35.67 | 17.48 | 39.86 | 2.58 |
Comparison between the values expected theoretically for unbiased ranking (first 2 columns), those obtained empirically when articles are ranked according to c (3rd and 4th columns), and according to cf (last 2 columns).
For the normalization of the relative indicator, we have considered the average number c0 of citations per article published in the same year and in the same field. This is a very natural choice, giving to the numerical value of cf the direct interpretation as the relative citation performance of the publication. In the literature this quantity is also indicated as the “item oriented field normalized citation score” (24), an analogue for a single publication of the popular Centre for Science and Technology Studies, Leiden (CWTS), field-normalized citation score or “crown indicator” (25). In agreement with the findings of ref. 11, c0 shows very little correlation with the overall size of the field, as measured by the total number of articles.
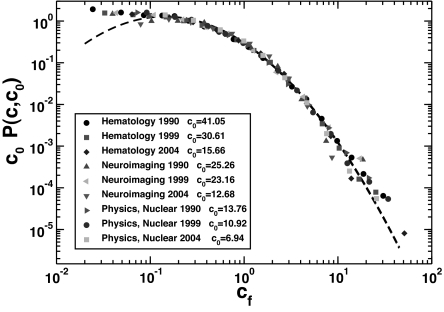
The previous analysis compares distributions of citations to articles published in a single year, 1999. It is known that different temporal patterns of citations exist, with some articles starting soon to receive citations, whereas others (“sleeping beauties”) go unnoticed for a long time, after which they are recognized as seminal and begin to attract a large number of citations (26, 27). Other differences exist between disciplines, with noticeable fluctuations in the cited half-life indicator across fields. It is then natural to wonder whether the universality of distributions for articles published in the same year extends longitudinally in time so that the relative indicator allows comparison of articles published in different years. For this reason, in Fig. 4 we compare the plot of c0P(c,c0) vs. cf for publications in the same scientific discipline that appeared in 3 different years. The value of c0 obviously grows as older publications are considered, but the rescaled distribution remains conspicuously the same.
Fig. 4.
Rescaled probability distribution c0 P(c,c0) of the relative indicator cf = c/c0 for 3 disciplines (Hematology, Neuroimaging, and Nuclear Physics) for articles published in different years (1990, 1999, and 2004). Despite the natural variation of c0 (c0 grows as a function of the elapsed time), the universal scaling observed over different disciplines naturally holds also for articles published in different time periods. The dashed line is a lognormal fit with σ2 = 1.3.
Generalized h Index
Since its introduction in 2005, the h index (1) has enjoyed a spectacularly quick success (28): it is now a well-established standard tool for the evaluation of the scientific performance of scientists. Its popularity is partly due to its simplicity: the h index of an author is h if h of his N articles have at least h citations each, and the other N − h articles have, at most, h citations each. Despite its success, as with all other performance metrics, the h index has some shortcomings, as already pointed out by Hirsch himself. One of them is the difficulty in comparing authors in different disciplines.
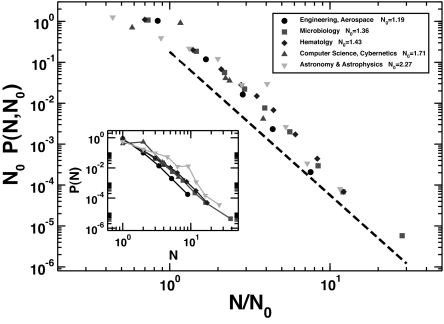
The identification of the relative indicator cf as the correct metrics to compare articles in different disciplines naturally suggests its use in a generalized version of the h index, taking properly into account different citation patterns across disciplines. However, just ranking articles according to cf, instead of on the basis of the bare citation number c, is not enough. A crucial ingredient of the h index is the number of articles published by an author. As Fig. 5 shows, such a quantity also depends on the discipline considered; in some disciplines, the average number of articles published by an author in a year is much larger than in others. However, also in this case, this variability is rescaled away if the number N of publications in a year by an author is divided by the average value in the discipline N0. Interestingly, the universal curve is fitted reasonably well over almost 2 decades by a power-law behavior P(N, N0) ≈ (N/N0)−δ with δ = 3.5 (5).
Fig. 5.
The same distributions as in Inset rescaled by the average number N0 of publications per author in 1999 in the different disciplines. The dashed line is a power law with exponent −3.5. (Inset) Distributions of the number of articles, N, published by an author during 1999 in several disciplines.
This universality allows one to define a generalized h index, hf, that factors out also the additional bias due to different publication rates, thus allowing comparisons among scientists working in different fields. To compute the index for an author, his/her articles are ordered according to cf = c/c0 and this value is plotted versus the reduced rank r/N0 with r being the rank. In analogy with the original definition by Hirsch, the generalized index is then given by the last value of r/N0 such that the corresponding cf is larger than r/N0. For instance, if an author has published 6 articles with values of cf equal to 4.1, 2.8, 2.2, 1.6, 0.8, and 0.4, respectively, and the value of N0 in his discipline is 2.0, his hf index is equal to 1.5. This is because the third best article has r/N0 = 1.5 < 2.2 = cf, whereas the fourth has r/N0 = 2.0 > 1.6 = cf.
Conclusions
In this article we have presented strong empirical evidence that the widely scattered distributions of citations for publications in different scientific disciplines are rescaled on the same universal curve when the relative indicator cf is used. We have also seen that the universal curve is remarkably stable over the years. The analysis presented here justifies the use of relative indicators to compare in a fair manner the impact of articles across different disciplines and years. This may have strong and unexpected implications. For instance, Fig. 2 leads to the counterintuitive conclusion that an article in Aerospace Engineering with only 20 citations (cf ≈ 3.54) is more successful than an article in Developmental Biology with 100 citations (cf ≈ 2.58). We stress that this does not imply that the article with larger cf is necessarily more “important” than the other. In an evaluation of importance, other field-related factors may play a role: an article with an outstanding value of cf in a very narrow specialist field may be less important (for science, in general, or for the society) than a publication with smaller cf in a highly competitive discipline with potential implications in many areas.
Because we consider single publications, the smallest possible entities whose scientific impact can be measured, our results must always be taken into account when tackling other, more complicated tasks, like the evaluation of performance of individuals or research groups. For example, in situations where the simple count of the mean number of citations per publication is deemed to be important, one should compute the average of cf (not of c) to evaluate impact independently of the scientific discipline. For what concerns the assessment of single authors' performance we have defined a generalized h index (1) that allows a fair comparison across disciplines taking into account also the different publication rates.
Our analysis deals with 2 of the main sources of bias affecting comparisons of publication citations. It would be interesting to tackle, along the same lines, other potential sources of bias, as, for example, the number of authors, which is known to correlate with a higher number of citations (10). It is natural to define a relative indicator, the number of citations per author. Is this normalization the correct one that leads to a universal distribution, for any number of authors?
Finally, from a more theoretical point of view, an interesting goal for future work is to understand the origin of the universality found and how its precise functional form comes about. An attempt to investigate what mechanisms are relevant for understanding citation distributions is in ref. 29. Further activity in the same direction would definitely be interesting.
Methods
Our empirical analysis is based on data from Thomson Scientific's Web of Science (WOS; www.isiknowledge.com) database, where the number of citations is counted as the total number of times an article appears as a reference of a more recently published article. Scientific journals are divided in 172 categories, from Acoustics to Zoology. Within a single category a list of journals is provided. We consider articles published in each of these journals to be part of the category. Notice that the division in categories is not mutually exclusive: for example, Physical Review D belongs both to the Astronomy and Astrophysics and to the Physics, Particles and Fields categories. For consistency, among all records contained in the database we consider only those classified as “article” and “letter,” thus excluding reviews, editorials, comments, and other published material likely to have an uncommon citation pattern. A list of the categories considered, with the relevant parameters that characterize them, is reported in Table 1. The category Multidisciplinary Sciences does not fit perfectly into the universal picture found for other categories, because the distribution of the number of citations is a convolution of the distributions corresponding to the single disciplines represented in the journals. However, if one focuses only on the 3 most important multidisciplinary journals (Nature, Science, and PNAS), this category fits very well into the global universal picture. Our calculations neglect uncited articles; we have verified, however, that their inclusion just produces a small shift in c0, which does not affect the results of our analysis. In the plots of the citation distributions, data have been grouped in bins of exponentially growing size, so that they are equally spaced along a logarithmic axis. For each bin, we count the number of articles with citation count within the bin and divide by the number of all potential values for the citation count that fall in the bin (i.e., all integers). This holds as well for the distribution of the normalized citation count cf, because the latter is just determined by dividing the citation count by the constant c0, so it is a discrete variable just like the original citation count. The resulting ratios obtained for each bin are finally divided by the total number of articles considered, so that the histograms are normalized to 1.
Footnotes
The authors declare no conflict of interest.
This article is a PNAS Direct Submission.
References
- 1.Hirsch JE. An index to quantify an individual's scientific research output. Proc Natl Acad Sci USA. 2005;102:16569–16572. doi: 10.1073/pnas.0507655102. [DOI] [PMC free article] [PubMed] [Google Scholar]
- 2.Egghe L. Theory and practise of the g-index. Scientometrics. 2006;69:131–152. [Google Scholar]
- 3.Hirsch JE. Does the h index have predictive power? Proc Natl Acad Sci USA. 2007;104:19193–19198. doi: 10.1073/pnas.0707962104. [DOI] [PMC free article] [PubMed] [Google Scholar]
- 4.Evidence Ltd. The use of bibliometrics to measure research quality in UK higher education institutions. [Accessed Oct. 7, 2008];2007 doi: 10.1007/s00005-009-0003-3. Available at: http://bookshop.universitiesuk.ac.uk/downloads/bibliometrics.pdf. [DOI] [PubMed]
- 5.Kinney AL. National scientific facilities and their science impact on nonbiomedical research. Proc Natl Acad Sci USA. 2007;104:17943–17947. doi: 10.1073/pnas.0704416104. [DOI] [PMC free article] [PubMed] [Google Scholar]
- 6.King DA. The scientific impact of nations. Nature. 2004;430:311–316. doi: 10.1038/430311a. [DOI] [PubMed] [Google Scholar]
- 7.Brooks TA. Evidence of complex citer motivations. J Am Soc Inf Sci. 1986;37:34–36. [Google Scholar]
- 8.Egghe L, Rousseau R. Introduction to Informetrics: Quantitative Methods in Library, Documentation and Information Science. Amsterdam: Elsevier; 1990. [Google Scholar]
- 9.Adler R, Ewing J, Taylor P. Citation statistics. [Accessed Oct. 7, 2008];IMU Report. 2008 http://www.mathunion.org/Publications/Report/CitationStatistics.
- 10.Bornmann L, Daniel H-D. What do citation counts measure? A review of studies on citing behavior. J Docum. 2008;64:45–80. [Google Scholar]
- 11.Althouse BM, West JD, Bergstrom T, Bergstrom CT. Differences in impact factor across fields and over time. 2008 Apr 19; arXiv:0804.3116v1. [Google Scholar]
- 12.Garfield E. Citation Indexing. Its Theory and Applications in Science, Technology, and Humanities. New York: Wiley; 1979. [Google Scholar]
- 13.Schubert A, Braun T. Relative indicators and relational charts for comparative-assessment of publication output and citation impact. Scientometrics. 1986;9:281–291. [Google Scholar]
- 14.Schubert A, Braun T. Cross-field normalization of scientometric indicators. Scientometrics. 1996;36:311–324. [Google Scholar]
- 15.Vinkler P. Model for quantitative selection of relative scientometric impact indicators. Scientometrics. 1996;36:223–236. [Google Scholar]
- 16.Vinkler P. Relations of relative scientometric indicators. Scientometrics. 2003;58:687–694. [Google Scholar]
- 17.Iglesias JE, Pecharroman C. Scaling the h-index for different scientific ISI fields. Scientometrics. 2007;73:303–320. [Google Scholar]
- 18.Zitt M, Ramanana-Rahary S, Bassecoulard E. Relativity of citation performance and excellence measures: From cross-field to cross-scale effects of field-normalisation. Scientometrics. 2005;63:373–401. [Google Scholar]
- 19.Redner S. How popular is your paper? Eur Phys J B. 1998;4:131–134. [Google Scholar]
- 20.Naranan S. Power law relations in science bibliography: A self-consistent interpretation. J Docum. 1971;27:83–97. [Google Scholar]
- 21.Seglen PO. The skewness of science. J Am Soc Inf Sci. 1992;43:628–638. [Google Scholar]
- 22.Fortunato S, Castellano C. Scaling and universality in proportional elections. Phys Rev Lett. 2007;99:138701. doi: 10.1103/PhysRevLett.99.138701. [DOI] [PubMed] [Google Scholar]
- 23.Plerou V, Nunes Amaral LA, Gopikrishnan P, Meyer M, Stanley HE. Similarities between the growth dynamics of university research and of competitive economic activities. Nature. 1999;400:433–437. [Google Scholar]
- 24.Lundberg J. Lifting the crown-citation z-score. J Informetrics. 2007;1:145–154. [Google Scholar]
- 25.Moed HF, Debruin RE, Vanleeuwen TN. New bibliometric tools for the assessment of national research performance—Database description, overview of indicators and first applications. Scientometrics. 1995;33:381–422. [Google Scholar]
- 26.Van Raan AF. Sleeping Beauties in science. Scientometrics. 2004;59:461–466. [Google Scholar]
- 27.Redner S. Citation statistics from 110 years of Physical Review. Phys Today. 2005;58:49–54. [Google Scholar]
- 28.Ball P. Index aims for fair ranking of scientists. Nature. 2005;436:900. doi: 10.1038/436900a. [DOI] [PubMed] [Google Scholar]
- 29.Van Raan AF. Competition amongst scientists for publication status: toward a model of scientific publication and citation distributions. Scientometrics. 2001;51:347–357. Vol. 105 No. 999. [Google Scholar]


