Abstract
Despite >50 years of research work since the discovery of sliding filament mechanism in muscle contraction, structural details of the coupling of cyclic cross-bridge movement to ATP hydrolysis are not yet fully understood. An example would be whether lever arm tilting on the myosin filament backbone will occur in the absence of actin. The most direct way to elucidate such movement is to record ATP-induced cross-bridge movement in hydrated thick filaments. Using the hydration chamber, with which biological specimens can be kept in an aqueous environment in an electron microscope, we have succeeded in recording ATP-induced cross-bridge movement in hydrated thick filaments consisting of rabbit skeletal muscle myosin, with gold position markers attached to the cross-bridges. The position of individual cross-bridges did not change appreciably with time in the absence of ATP, indicating stability of time-averaged cross-bridge mean position. On application of ATP, individual cross-bridges moved nearly parallel to the filament long axis. The amplitude of the ATP-induced cross-bridge movement showed a peak at 5–7.5 nm. At both sides of the filament bare region, across which the cross-bridge polarity was reversed, the cross-bridges were found to move away from, but not toward, the bare region. Application of ADP produced no appreciable cross-bridge movement. Because ATP reacts rapidly with the cross-bridges (M) to form complex (M·ADP·Pi) with an average lifetime >10 s, the observed cross-bridge movement is associated with reaction, M + ATP → M·ADP·Pi. The cross-bridges were observed to return to their initial position after exhaustion of ATP. These results constitute direct demonstration of the cross-bridge recovery stroke.
Keywords: muscle contraction, cross-bridge cycle
Although >50 years have passed since the monumental discovery that muscle contraction results from relative sliding between myosin and actin filaments produced by myosin cross-bridges (1, 2), some significant questions remain to be answered concerning the coupling of cross-bridge movement to ATP hydrolysis. In the cross-bridge model of muscle contraction, globular myosin heads, i.e., the cross-bridges extending from the thick filament, first attach to actin in the thin filament, change their structure to produce relative myofilament sliding (cross-bridge power stroke), and then detach from actin (3, 4).
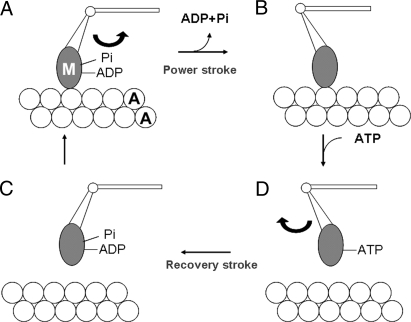
Recent crystallographic, electron microscopic, and X-ray diffraction studies suggest that the distal part of the cross-bridge (M; called the catalytic domain because it contains a nucleotide binding site) is rigidly attached to the thin filament, while its proximal part acting as a lever (the lever arm region) is hinged to M; the lever arm movement around the hinge produces the power stroke (5–9). Based on biochemical studies of actomyosin ATPase (10), it is generally believed that ATP reacts rapidly with M to form a complex M·ADP·Pi, and this complex attaches to actin (A) to exert a power stroke, associated with release of Pi and ADP. After the end of the power stroke, M is detached from A upon binding of next ATP with M. After detachment from A, M performs a recovery stroke, associated with the formation of M·ADP·Pi (Fig. 1). Can a change in lever arm orientation on the thick filaments take place in the absence of actin? Some of the evidence for the lever arm hypothesis is based on experiments with myosin fragments, not connected to the thick filament, and additional mechanisms may be involved in vivo.
Fig. 1.
Schematic diagram of attachment-detachment cycle between the cross-bridge (M) extending from the thick filament and actin (A) in the thin filament. M in the form of M·ADP·Pi attaches to actin to exert a power stroke, associated with release of Pi and ADP (from A to B). After the end of the power stroke, M remains attached to A, taking its postpower stroke configuration (B). Upon binding with ATP, M detaches from A to exert a recovery stroke, associated with reaction M·ATP → M·ADP·Pi (from C to D). M·ADP·Pi again attaches to A to again exert a power stroke (from D to A). M is assumed to attach rigidly to A, while its power and recovery strokes are assumed to result from swinging of the lever arm around the hinge.
The most direct way to study cross-bridge power and recovery strokes is to record the ATP-induced movement of individual cross-bridges in the thick filaments, using the hydration chamber (HC; or gas environmental chamber), with which biological macromolecules can be kept wet to retain their physiological function in an electron microscope with sufficiently high magnifications (11, 12). With this method, Sugi et al. (13) succeeded in recording ATP-induced cross-bridge movement in the myosin–paramyosin core complex, although the results were preliminary and bore no direct relation to the cross-bridge movement in vertebrate skeletal muscle. In the present study, we attempted to measure the ATP-induced cross-bridge movement in vertebrate thick filaments muscle with the HC and succeeded in recording images of the thick filaments, with gold position markers attached to the cross-bridges, before and after application of ATP. Here, we report that, in response to ATP, individual cross-bridges move for a distance (peak at 5–7.5 nm), and at both sides of the filament bare region, across which cross-bridges polarity is reversed, the cross-bridges are observed to move away from, but not toward, the bare region. After exhaustion of ATP, the cross-bridges returned toward their initial position, indicating reversibility of their ATP-induced movement. Because the present experiments were made in the absence of the thin filament, our work constitute a direct demonstration of the cross-bridge recovery stroke in vertebrate muscle thick filaments.
Results
Stability of the Cross-Bridge Position in the Absence of ATP.
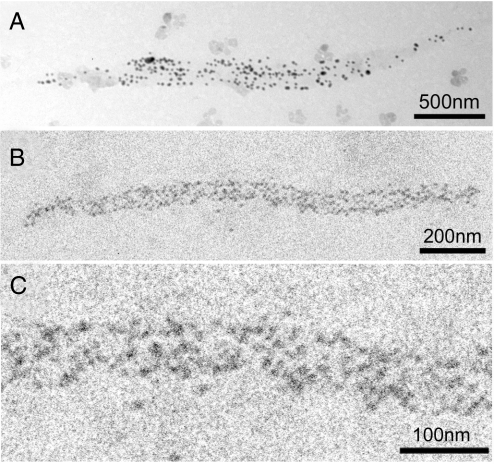
Although the synthetic thick filaments tended to aggregate, we could occasionally find spindle-shaped thick filaments with a number of gold particles attached to the cross-bridges (Fig. 2 A and B). The filament diameter at the middle ranged from 50 to 250 nm, whereas filament lengths ranged from 0.1 to 3.5 μm. The filaments were stiff and tended to form nearly straight rods, although some filaments with diameters <100 nm were wavy in shape. The large filament diameters made it possible to distinguish the filament profile from the background. The image of each gold particle consisted of 20–50 dark pixels with a wide range of gradation (Fig. 2C). Although the particle configuration was irregular in shape, reflecting the electron statistics, it was possible to define the configuration of individual particles. We selected approximately round-shaped particles, separated from adjacent particles, and determined their center of mass position.
Fig. 2.
Typical IP records of a synthetic thick filament with a number of gold particles attached to individual cross-bridges. (A and B) The whole spindle-shaped filament with tapered ends. (C) Enlarged IP record showing part of the thick filament shown in A. Each gold particle consists of 20–50 dark pixels.
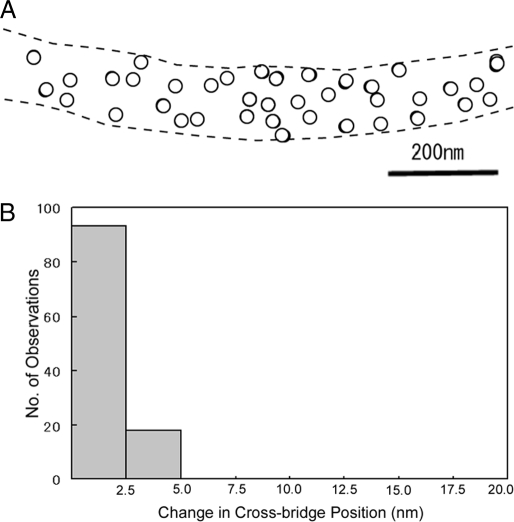
To examine whether the particle (and therefore the cross-bridge) positions are stable in the imaging plate (IP) records or changing with time, we compared the center of mass positions of the same particle between 2 IP records of the same filament, taken at intervals of 5–10min. An example of the results is shown in Fig. 3A, in which a circle of 20-nm diameter is drawn around the center of mass position of each selected particle. The position of each particle, i.e., the position of each cross-bridge, remains almost unchanged with time, if the limit of spatial resolution determined by the pixel size (2.5 × 2.5 nm) is taken into consideration. Fig. 3B is a histogram showing distribution of the distance (D) between the 2 positions of the same particle. Among 120 particles examined on 3 different pairs of IP records, 93 particles exhibit no significant change in position (D < 2.5 nm), and 27 particles exhibit only small position changes (2.5 nm < D > 5 nm). These results indicate that (i) the filaments are firmly fixed to the carbon sealing film, and (ii) despite the thermal fluctuation, the cross-bridge mean position, time averaged >0.1 s, remains almost unchanged with time in the absence of ATP. Similar stability of cross-bridge position has also been observed in myosin–paramyosin core complex filaments (13).
Fig. 3.
Stability of time-averaged cross-bridge mean position in the absence of ATP. (A) Comparison of the cross-bridge position between the 2 IP records of the same filament on the common coordinates. Open and filled circles (diameter, 20 nm) are drawn around the center of mass positions of each gold particle in the first and the second IP records, respectively. In this and subsequent figures, broken lines indicate contour of the filament on which the particles are located. Note that filled circles are barely visible because of the nearly complete overlap of open and filled circles. (B) Histogram showing distribution of distance between the 2 contour of mass positions of the same particles in the first and the second records.
Amplitude of the ATP-Induced Cross-Bridge Movement.
Based on the stability of the cross-bridge position, we examined the cross-bridge movement in response to ATP by comparing 2 IP records of the same filaments, taken before and after ATP application. Because the time of ATP diffusion from the ATP-containing microelectrode to the filaments is <30 s, the second record was taken at 40–60s after the onset of current pulse to the electrode, whereas the first record was taken 2–3 min before the onset of current pulse to the electrode.
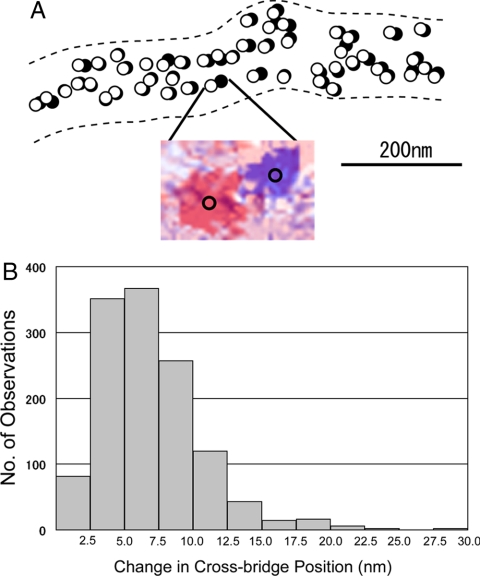
Because it was not easy to focus particles located at both sides of the thick filament bare region, we first examined ATP-induced movement of the cross-bridges located at 1 side of the bare region. In response to ATP, the center of mass positions of particles, i.e., the position of individual cross-bridges, were observed to move in 1 direction nearly parallel to the filament axis (Fig. 4A). Because myosin rods, constituting the filament backbone, should be parallel to the filament axis, the slight deviation in the direction of cross-bridge movement from the filament axis may result from flexibility of the cross-bridge–rod junction.
Fig. 4.
Movement of individual cross-bridges in response to ATP application. (A) Comparison of the cross-bridge position between the 2 IP records, taken before and after ATP application. Open and filled circles (diameter, 20 nm) are drawn around the center of mass positions of the same particles before and after ATP application, respectively. (Inset) An example of superimposed IP records showing the change in position of the same particle, which are colored red (before ATP application) and blue (after ATP application). The center of mass position for each particle image is located at the center of the circle on the particle image. (B) Histogram showing distribution of the amplitude of ATP-induced cross-bridge movement, obtained from the ATP-induced changes in the center of mass position of each gold particle.
The amplitude of ATP-induced cross-bridge movement was measured not only on the filaments, which were completely separated from adjacent filaments, or largely separated from adjacent filaments over a distance >1 μm, but also on the filaments, which clumped and overlapped with adjacent filaments, so that profile of individual filaments was not clear. In such filaments, the cross-bridges also exhibited ATP-induced movement similar to that observed in the separated filaments.
Fig. 4B is a histogram showing distribution of the amplitude of ATP-induced cross-bridge movement, constructed from 1,285 measurements on 8 different pairs of IP records obtained from 8 different filaments. The histogram exhibits a peak at 5–7.5 nm. The average amplitude of ATP-induced cross-bridge movement (excluding values <2.5 nm) was 6.5 ± 3.7 nm (mean + SD, n = 1210).
In the present experimental condition, the particles located on both the upper and the lower side of the filaments are equally in focus in the microscopic field. Whereas the cross-bridges located at the filament upper side may move almost freely in response to ATP, the cross-bridges at the filament lower side would attach to the carbon film, and their ATP-induced movement would be inhibited or markedly reduced in amplitude. This possibility is consistent with the frequent presence of particles that do not move appreciably or move with small amplitudes <5 nm. If this explanation is correct, the mean amplitude of ATP-induced movement of the cross-bridges that can move freely would be >7.5 nm.
Meanwhile, the ATP-induced cross-bridge movement was no longer observed when its ATPase activity had been eliminated by N-ethulmaleimide, in agreement with our previous study (13). The cross-bridges did not move in response to ADP application.
Direction of the ATP-Induced Cross-Bridge Movement at Both Sides of the Thick Filament Bare Region.
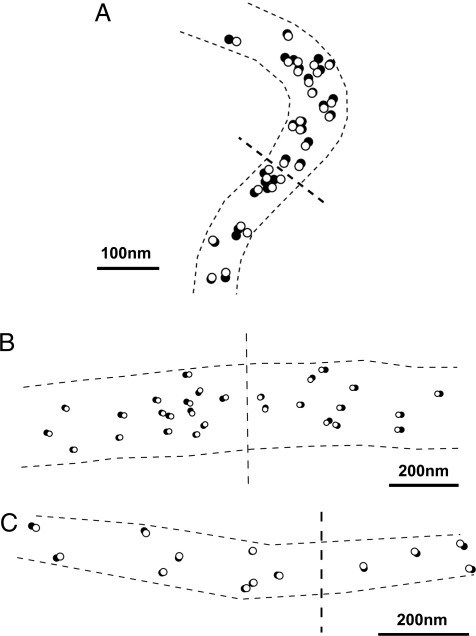
Despite great difficulties in observing particles located around the thick filament bare region, across which the cross-bridge polarity is reversed, we succeeded in recording the ATP-induced cross-bridge movement at both sides of the bare region. Examples of the records are shown in Fig. 5. It can be seen that, in response to ATP, individual cross-bridges were found to move away from, but not toward, the bare region. Similar results were obtained in several other pairs of IP records. Judging from the minimum distance between the 2 particles moving in opposite directions, the bare region width in the synthetic thick filaments was <100 nm in most cases, being much shorter than that of natural thick filament in vertebrate skeletal muscle. This result can be explained as being caused by incomplete lateral alignment of myosin rods constituting the thick filament bare region.
Fig. 5.
Examples of IP records showing the ATP-induced cross-bridge movement at both sides of thick filament bare region, across which the cross-bridge polarity is reversed. Open and filled circles (diameter, 20 nm) are drawn around the center of mass positions of the same particles in the IP record taken before and after ATP application, respectively. Note that the cross-bridges move away from the bare region. The approximate location of the bare region is indicated by broken lines across the center of the filament. The filament is thin and bent in A, whereas the filament is thick and nearly straight in B and C.
As the present experiments are made in the absence of the thin filament, the finding that, in response to ATP, the cross-bridges move away from the thick filament bare region, is consistent with the idea that the observed cross-bridge movement corresponds to the cross-bridge recovery (or preparatory) stroke, coupled with reaction, M + ATP → M·ADP·Pi. This point will be discussed in detail in Discussion. This idea is supported by the result that application of ADP to the filaments produced no appreciable cross-bridge movement.
Reversibility of the ATP-Induced Cross-Bridge Movement.
To ascertain whether the ATP-induced cross-bridge movement is reversible or not, experiments were made in which the images of the same filament were recorded 3 times in the following sequence: (i) before ATP application, (ii) 40- 60 s after the onset of current pulse to the ATP-containing electrode, i.e., during the formation of M·ADP·Pi, and (iii) 5–6 min after ATP application, i.e., after exhaustion of applied ATP. Because the experimental solution bathing the filaments contained hexokinase and d-glucose serving as scavenger for ATP (14, 15), all of the ATP molecules released from the electrode were completely exhausted at the time of recording (iii). The first and the third records are therefore taken in the absence of ATP, whereas the second record is taken when most cross-bridges are in the state, M·ADP·Pi. Attention was focused mainly on the particles, which showed large amplitudes of movement in response to ATP.
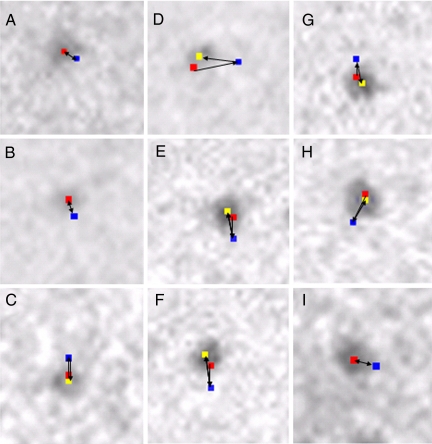
Fig. 6, shows examples of the sequential changes in position of different pixels (2.5 × 2.5 nm) where the center of mass positions of the corresponding different particles are located. Therefore, these pixel positions in the first (red), second (blue), and third (yellow) records can be taken to represent sequential position changes of individual cross-bridges in the 3 IP records.
Fig. 6.
Examples showing sequential changes in position of different pixels (each 2.5 × 2.5 nm) where the center of mass positions of corresponding different particles are located. In each frame, the pixel positions were recorded 3 times, i.e., before ATP application, during ATP application, and after exhaustion of applied ATP. The changes in position of the pixels in the first (red), second (blue), and third (yellow) records indicate changes in the cross-bridge position before ATP application, during ATP application, and after exhaustion of ATP. Direction of each cross-bridge movement is indicated by an arrow. The angle between the filament long axis, on which the particles was located, and the X–Y coordinates of the IP was random. Note that the cross-bridges return toward their initial position after exhaustion of ATP. After exhaustion of ATP, the cross bridge returned almost exactly to its initial position in A, B, and I, and close to its initial position in C–H.
It can be seen that the cross-bridges first move in response to ATP application, associated with reaction M + A → M·ATP → M·ADP·Pi, and then return toward their initial position after complete exhaustion of ATP, i.e., detachment of Pi and ADP from M. When the amplitude of ATP-induced cross-bridge movement was small (≈5 nm), the cross-bridges were observed to return almost exactly to their initial position, as indicated by the complete overlap of the pixel position in the first and the third records, so that yellow pixels were entirely covered by red pixels (Fig. 6 A and B). With larger amplitudes of ATP-induced cross-bridge movement, the cross-bridges were mostly observed to return to the position close to their initial position, as indicated by the small distance between the red and the yellow pixels (<5 nm) (Fig. 6 C–H), although the complete overlap of the red and the yellow pixels was also observed occasionally (Fig. 6I). These results indicate that the ATP-induced cross-bridge movement is reversible; the cross-bridges, in the state of M·ADP·Pi, return toward their initial position after detachment of Pi and ADP from them.
Discussion
Using the HC, with which biological specimens can be kept to retain their function in the electron microscope, we have succeeded in recording both the amplitude and direction of cross-bridge movement in response to ATP in vertebrate muscle thick filaments (Figs. 4–6). The observed cross-bridge movement in the absence of the thin filament may be related to the early observation of ATP-dependent cross-bridge arrangement in insect thick filaments (16). Up to the present time, ATP-dependent order–disorder transition of cross-bridge arrangement has been studied in detail (17–19).
In the present study, only a very small fraction of the cross-bridges on the thick filaments are labeled to record movements of individual cross-bridges and therefore bears no direct relation to these studies, in which information about changes in the cross-bridge arrangement (largely azimuthal) are sampled from all of the cross-bridges in the experimental material.
The present results have been obtained from changes in the time-averaged cross-bridge position on the firmly fixed filament, in which any cross-bridge flexibility is included and also bears no direct relation to the X-ray studies on large random cross-bridge displacements in the whole muscle, in which all of the cross-bridges are sampled for a long time (e.g. refs. 20 and 21).
It is generally believed that the cross-bridge, in the form of M·ADP·Pi, attaches actin (A) in the thin filament to exert a power stroke, associated with the release of Pi and ADP, so that at the end of the power stroke, M forms rigor linkage with A. M then detaches from A upon binding with ATP to exert a recovery stroke, associated with reaction, M·ATP → M·ADP·Pi. Because the thin filament is absent in our experimental system, it seems likely that the ATP-induced cross-bridge movement corresponds to the recovery stroke in the attachment–detachment cycle between M and A (corresponding to the cross-bridge states from C to D in Fig. 1). This view is supported by the present finding that the direction of ATP-induced cross-bridge movement is away from the filament bare region (Fig. 5), the direction opposite to that of power stroke.
So that the cross-bridge repeats the attachment–detachment cycle with actin, the recovery stroke should be the same in amplitude as, but opposite in direction to, the power stroke. As a matter of fact, the cross-bridges that had moved in response to ATP were observed to return toward their initial position after exhaustion of ATP (Fig. 6), providing additional evidence that the ATP-induced cross-bridge movement actually corresponds to the recovery stroke. This result implies that when the cross-bridges return to their initial position after exhaustion of ATP, i.e., detachment of Pi and ADP from M (Fig. 1), they undergo conformational changes similar to those of the power stroke (corresponding to the cross-bridge states from A to B in Fig. 1). These results strongly suggest that, in the absence of ATP, the cross-bridges in the thick filaments take configurations analogous to those at the end of the power stroke.
In the lever arm hypothesis, the cross-bridge catalytic domain (M) is believed to attach rigidly to actin before the cross-bridge movement is produced by tilting of the lever arm (Fig. 1), which implies that the lever arm should tumble around the hinge until M comes to an appropriate position to attach actin. The reversibility of the ATP-induced cross-bridge movement (Fig. 6) suggests that, even in the absence of the thin filament, the lever can make M take its appropriate position to attach actin without being guided by the thin filament. It seems possible that the tumbling of M caused by the hinge region flexibility always takes place around a certain neutral point, as has been suggested concerning cross-bridge thermal motion in the early cross-bridge model (3), which again implies that the cross-bridge configuration in the absence of ATP is analogous to that at the end of the power stroke. Of course, the present results give no information about the actual attachment angle of M to the thin filament. More experimental work is desired.
The amplitude distribution of ATP-induced cross-bridge movement showed a peak at 5–7.5 nm, whereas a small proportion of the cross-bridges examined exhibited amplitudes >12.5 nm (Fig. 4B). In the myofilament-lattice, the stroke of cross-bridges attached to actin is obviously limited to ≈10 nm because of structural constraints of myofilament lattice structure. On this basis, the observed cross-bridge strokes >12.5 nm might bear no direct relation to physiological muscle contraction. Although the ATP-induced cross-bridge movement ≈20 nm has been recorded on the myosin–paramyosin core complex (13), the arrangement of myosin molecules in the above complex differs too far from that in the myosin filament used in the present study. Much more experimental work is needed to solve mechanisms of cross-bridge strokes associated with ATP hydrolysis.
In summary, the present experiments may constitute visualization of the cross-bridge recovery stroke, using the HC system with which both the amplitude and direction of ATP-induced cross-bridge movement in living thick filaments can be recorded electron microscopically. Finally, we emphasize that the HC system will no doubt open horizons in the research field of biological sciences.
Materials and Methods
The HC.
The HC used in the present study was identical to that of Sugi et al. (13). Briefly, the HC is a cylindrical compartment (diameter, 2.0 mm; height, 0.8 mm) with upper and lower windows to pass electron beam. Each window is covered with a thin carbon-sealing film (thickness, 15–20 nm) supported on a copper grid with 9 apertures. The specimen was placed on the lower carbon film together with a thin layer of experimental solution covering it (thickness, < 250 nm), which was in equilibrium with the circulating water vapor in the HC (pressure, 60–80 torr; temperature, 26–28 °C). The HC contains an ATP-containing microelectrode with its tip immersed in the experimental solution. The HC is attached to a 200-kV transmission electron microscope (JEM 2000EX; JEOL).
Synthetic Thick Filaments.
The specimen used was synthetic thick filaments consisting of myosin–myosin rod mixture. Myosin was prepared from rabbit psoas muscle by the method of Perry (22), whereas myosin rod was prepared by chymotryptic digestion of myosin by the method of Margossian and Lowey (23). Both myosin and myosin rod were frozen and stored in 50% (vol/vol) glycerol at −20 °C until used. Myosin and myosin rod were mixed (molar ratio, 1:1) in a solution containing 500 mM KCl, 2 mM MgCl2, 20 mM piperazine-N,N″-bis[2-ethanesulfonic acid], and 1 mM DTT (pH 7.0), and the myosin–myosin rod mixture was slowly polymerized by dialysis against a solution of low ionic strength (KCl concentration in the above solution was reduced from 500 to 120 mM) to obtain bipolar thick filaments (length, ≈1.5–3 μm; diameter at the center, 50–200 nm). The advantages of using the synthetic bipolar filaments are: (i) they are stiff and tend to form nearly straight rods when placed on the carbon film; (ii) their large diameter make it possible to distinguish the filament profile from the background; and (iii) the cross-bridges extending from the upper side of the filaments can move freely without possible constraints arising from attachment to the carbon-sealing film.
Colloidal gold particles (diameter, 20 nm; coated with protein A; EY Laboratories) were attached to the cross-bridges as position markers, using a site-directed antibody (IgG) to the junctional peptide between 50- and 20-kDa segments of myosin heavy chain (24). The antibody mostly attaches to only 1 of the 2 myosin cross-bridges at the region ≈16 nm distant from the cross-bridge–myosin rod junction probably because of steric hindrance, and its attachment angle is variable, probably reflecting disordered structure of the junctional peptide (24). To label the cross-bridges sparsely, so that each cross-bridge can be distinguished from the neighboring ones, the molar ratio between the cross-bridges on the filament and the antibody was chosen to be ≈1:1.4–1.6. Other details of the method have been described (13). The Mg-ATPase activity of synthetic filament samples, measured from time to time during the present work, was 0.14-.15 s−1 at 28 °C and was not appreciably affected after mixing with the antibody. Finally, a small drop of experimental solution (≈5 μL) containing the filaments was put onto the carbon film in the HC, and blotted with filter paper. The final quantity of the solution remaining on the carbon film might be ≈10−6 mL.
Recording of the Filament Image.
To avoid electron beam damage to the specimen, observation and recording were made with a total incident electron dose <10−4C/cm2, being well below the critical dose for the reduction of ATP-induced myofibrillar shortening (25). The filaments were therefore observed with extremely weak beam intensities <5 × 10⁻¹³ A/cm2 at the detector. The actual beam intensity through the filaments with a magnification of 10,000 was 5 × 10−13 × (10,000)2 = 5 × 10⁻⁵ A/cm2. As soon as the filament images, with a number of gold particles serving as position markers for the cross-bridges, were brought in focus, the electron beam was stopped except for the time of recording.
The filament images were recorded with an IP system (PIX system; JEOL) with a magnification of 10,000×. The exposure time was 0.1 s with a beam intensity of 1–2 × 10⁻¹²A/cm2. Because of the limitation of total incident electron dose, recordings of the same filaments can be made only ≈2–4 times.
Application of ATP and ADP.
The application of ATP to the filaments was made iontophoretically by applying a current pulse (intensity, 10 nA; duration, 1 s) from an electronic stimulator to a glass capillary microelectrode filled with 100 mM ATP (resistance, 15–20 Mohm) through a current clamp circuit (14, 15). A positive DC current (2–5 nA) was constantly applied to the electrode to inhibit spontaneous release of ATP. The total amount of ATP released from the electrode was estimated to be 10−14 mol. Assuming the volume of the experimental solution covering the filaments of ≈10−6 mL, the ATP concentration around the filaments was ≈10 μM. The time required for the release ATP to reach the filaments by diffusion was estimated to be <30 s, by recording the ATP-induced myofibrillar shortening in the EC mounted on a light microscope. The application of ADP was also made by using a microelectrode filled with 100 mM ADP. In some experiments, hexokinase (50 units per mL) and d-glucose (2 mM) were added to the experimental solution to eliminate contamination of ATP (14, 15).
Data Analysis.
The filament images recorded on the IP were analyzed with a personal computer. Under a magnification of 10,000×, the pixel size on the IP records was 2.5 × 2.5 nm, and the average number of electrons reaching each pixel during the exposure time was ≈10. Reflecting this electron statistics, each gold particle image consisted of 20–50 pixels. After appropriate contrast enhancement or binarization procedures to obtain clear particle configurations, particles suitable for analysis were selected.
The center of mass position for each selected particle was determined as the coordinates (two significant figures; accuracy, ≈0.6 nm) within a single pixel where the center of mass position was located, and these coordinates representing the position of the particle, i.e., the position of the cross-bridge, were compared between the 2 different IP records of the same filaments. The absolute coordinates common to the 2 records were obtained based on the position of natural markers (bright spots on the carbon film). The distance D between the 2 center of mass positions (with the coordinates X1, Y1 and X2,Y2, respectively) was calculated as D = √{(X1 − X2)2 + (Y1 − Y2)2}.
Acknowledgments.
We thank Drs. K. Sutoh, E. Katayama, K. Fukushima, and Y. Sato for technical help; Drs. K. Nagayama, K. Kinosita, and S. Ishiwata for instructive discussions; and Japan Electron Optics Laboratory Ltd. for generously providing facilities.
Footnotes
The authors declare no conflict of interest.
References
- 1.Huxley AF, Niedergerke R. Interference microscopy of living muscle fibers. Nature. 1954;173:971–9733. doi: 10.1038/173971a0. [DOI] [PubMed] [Google Scholar]
- 2.Huxley HE, Hanson J. Changes in the cross-striations of muscle during contraction and stretch and their structural interpretation. Nature. 1954;173:973–976. doi: 10.1038/173973a0. [DOI] [PubMed] [Google Scholar]
- 3.Huxley AF. Muscle structure and theories of contraction. Prog Biophys Biophys Chem. 1957;7:255–318. [PubMed] [Google Scholar]
- 4.Huxley HE. The mechanism of muscular contraction. Science. 1969;164:1356–1366. [PubMed] [Google Scholar]
- 5.Rayment HM, et al. Structure of the actin-myosin complex and its implications for muscle contraction. Science. 1993;261:58–65. doi: 10.1126/science.8316858. [DOI] [PubMed] [Google Scholar]
- 6.Uyeda TQP, Abramson PD, Spudich JA. The neck region of the myosin motor domain acts as a lever arm to generate movement. Proc Natl Acad Sci USA. 1996;93:4459–4464. doi: 10.1073/pnas.93.9.4459. [DOI] [PMC free article] [PubMed] [Google Scholar]
- 7.Geeves MA, Holmes KC. Structural mechanism of muscle contraction. Annu Rev Biochem. 1999;68:687–728. doi: 10.1146/annurev.biochem.68.1.687. [DOI] [PubMed] [Google Scholar]
- 8.Fischer S, Windschugel B, Horak D, Holmes KC, Smith JC. Structural mechanism of the recovery stroke in the myosin molecular motor. Proc Natl Acad Sci USA. 2005;102:6873–6878. doi: 10.1073/pnas.0408784102. [DOI] [PMC free article] [PubMed] [Google Scholar]
- 9.Huxley HE, Reconditi M, Stewert A, Irving T. X-ray interference studies of cross-bridge action in muscle contraction: Evidence from quick releases. J Mol Biol. 2006;363:743–761. doi: 10.1016/j.jmb.2006.08.075. [DOI] [PubMed] [Google Scholar]
- 10.Lymn RW, Taylor EW. Mechanism of adenosine triphosphate hydrolysis by actomyosin. Biochemistry. 1971;10:4617–4624. doi: 10.1021/bi00801a004. [DOI] [PubMed] [Google Scholar]
- 11.Butler EP, Hale KF. Dynamic Experiments in the Electron Microscope. Amsterdam: North–Holland; 1981. [Google Scholar]
- 12.Fukami A, Fukushima K, Kohyama N. In: Microstructure of Fine-Grained Sediments from Mud to Shale. Bennett RH, Bryant WP, Hubert MH, editors. Heidelberg: Springer; 1991. pp. 321–331. [Google Scholar]
- 13.Sugi H, et al. Dynamic electron microscopy of ATP-induced myosin head movement in living muscle thick filaments. Proc Natl Acad Sci USA. 1997;94:4378–4382. doi: 10.1073/pnas.94.9.4378. [DOI] [PMC free article] [PubMed] [Google Scholar]
- 14.Oiwa K, Chaen S, Sugi H. Measurement of work done by ATP-induced sliding between rabbit muscle myosin and algal cell actin cables in vitro. J Physiol (London) 1991;437:751–763. doi: 10.1113/jphysiol.1991.sp018623. [DOI] [PMC free article] [PubMed] [Google Scholar]
- 15.Oiwa K, Kawakami T, Sugi H. Unitary distance of actin-myosin sliding studied using an in vitro force-movement assay system combined with ATP iontophoresis. J Biochem. 1993;114:28–32. doi: 10.1093/oxfordjournals.jbchem.a124134. [DOI] [PubMed] [Google Scholar]
- 16.Clarke ML, Hofman W, Wray JS. ATP binding and cross-bridge structure in muscle. J Mol Biol. 1986;191:581–585. doi: 10.1016/0022-2836(86)90153-1. [DOI] [PubMed] [Google Scholar]
- 17.Padron R, Craig R. Disorder induced in nonoverlap myosin cross-bridges by loss of adenosine triphosphate. Biophys J. 1989;56:927–933. doi: 10.1016/S0006-3495(89)82738-9. [DOI] [PMC free article] [PubMed] [Google Scholar]
- 18.Xu S, et al. The M·ADP·Pi state is required for helical order in the thick filaments of skeletal muscle. Biophys J. 1999;77:2665–2676. doi: 10.1016/s0006-3495(99)77101-8. [DOI] [PMC free article] [PubMed] [Google Scholar]
- 19.Zoghbi ME, Woodhead JL, Craig R, Padron R. Helical order in tarantura thick filaments requires the “closed” conformation of the myosin head. J Mol Biol. 2004;342:1223–1236. doi: 10.1016/j.jmb.2004.07.037. [DOI] [PubMed] [Google Scholar]
- 20.Poulsen FR, Lowy J. Small angle X-ray scattering from myosin heads in relaxed and rigor frog skeletal muscles. Nature. 1983;303:146–152. doi: 10.1038/303146a0. [DOI] [PubMed] [Google Scholar]
- 21.Lowy J, Poulsen FR. Studies of the diffuse X-ray scattering from contracting frog skeletal muscles. Biophys J. 1990;57:977–985. doi: 10.1016/S0006-3495(90)82617-5. [DOI] [PMC free article] [PubMed] [Google Scholar]
- 22.Perry SV. Myosin adenosine triphosphatase. Methods Enzymol. 1955;2:582–588. [Google Scholar]
- 23.Margossian SS, Lowey S. Hybridization and reconstitution of thick-filament structure. Methods Enzymol. 1982;85:20–55. doi: 10.1016/0076-6879(82)85008-8. [DOI] [PubMed] [Google Scholar]
- 24.Sutoh K, Tokunaga M, Wakabayashi T. Electron microscopic mappings of myosin head with site-directed antibodies. J Mol Biol. 1989;206:357–363. doi: 10.1016/0022-2836(89)90485-3. [DOI] [PubMed] [Google Scholar]
- 25.Suda H, Ishikawa A, Fukami A. Evaluation of the critical electron dose on the contractile activity of hydrated muscle fibers in the film-sealed environmental cell. J Electron Microsc. 1992;41:223–229. [PubMed] [Google Scholar]


