Abstract
Tissue Pulsatility Imaging (TPI) is an ultrasonic technique that is being developed at the University of Washington to measure tissue displacement or strain due to blood flow over the cardiac and respiratory cycles. This technique is based in principle on plethysmography, an older non-ultrasound technology for measuring expansion of a whole limb or body part due to perfusion. TPI adapts tissue Doppler signal processing methods to measure the “plethysmographic” signal from hundreds or thousands of sample volumes in an ultrasound image plane. This paper presents a feasibility study to determine if TPI can be used to assess cerebral vasoreactivity. Ultrasound data were collected transcranially through the temporal acoustic window from four subjects before, during, and after voluntary hyperventilation. In each subject, decreases in tissue pulsatility during hyperventilation were observed that were statistically correlated with the subject’s end-tidal CO2 measurements.
Keywords: ultrasound, tissue pulsatility imaging, brain imaging, tissue Doppler imaging, hyperventilation, hypocapnia, cerebral vasoreactivity
INTRODUCTION
Over the past two decades, there has been a growing research and clinical interest in developing ultrasound (US) methods to measure tissue displacement and strain. Of particular interest have been the measurement of myocardial contractility (Heimdal et al. 1998; Kanai et al. 1999; Kowalski et al. 2001; McDicken et al. 1992) and the measurement of tissue mechanical properties (Gao et al. 1996; Ophir et al. 1991, 1999). Over this period, there have been relatively few publications describing applications of these methods to brain imaging. Moehring et al. (1999) describe a method for measuring brain shifts to detect intracranial bleeding, Selbekk et al. (2005) describe an elastographic method for tumor margin detection during brain surgery, and Kucewicz et al. (2007) describe a method for measuring tissue displacement for functional brain imaging.
Some of the earliest work with measuring tissue motion with US, however, was done on the brain. Comprehensive reviews of this work can be found in Campbell et al. (1970) and White (1992). It was first observed in 1956 (Leksell) that the amplitude of the US signal from the cerebral midline pulsated synchronously with the cardiac cycle. Later it was observed that the cerebral hemispheres pulsated 180° out of phase with each other due to the opposing, centripetal movement of the two hemispheres (Taylor et al. 1961; de Vlieger and Ridder 1959). Campbell et al. (1970) described the influence of various physiological manipulations including breath holding, hyperventilation, Valsalva maneuver, and jugular vein compression on brain motion. Much of this early work was limited, however, by the US hardware available at the time and was not extensively pursued after the 1970’s as research and clinical interests shifted to US blood flow measurement.
At the University of Washington we are developing a Doppler US technique referred to as tissue pulsatility imaging (TPI) that measures the natural pulsatile motion of tissue due to blood flow as a surrogate for blood flow itself (Beach et al. 1992, 1993, 1994; Kucewicz et al. 2004; Kucewicz et al. 2007). During systole, blood flows into the arterial vasculature faster than it leaves through the venous vasculature, causing blood to accumulate and the tissue to expand by a fraction of a percent. During diastole, venous drainage dominates, allowing the tissue to return to its presystolic volume (Campbell et al. 1970; Strandness and Sumner 1975). As with other perfused tissues, changing blood volume causes the brain to expand and relax over the cardiac cycle. Because the volume of the brain is constrained by the fixed volume of the skull, expansion of the brain early in the cardiac cycle compresses the cerebral ventricles forcing cerebrospinal fluid (CSF) out of the skull. Later in the cardiac cycle, brain blood volume decreases drawing CSF back into the skull. This expansion of the brain and compression of the cerebral ventricles causes the brain to move medially during systole and laterally during diastole (Campbell et al. 1970). Additionally, the changing blood volume pushes the brain posteriorly and caudally towards the foramen magnum during systole followed by a rebound during diastole (Maier et al. 1994; Poncelet et al. 1992).
Cerebral vasoreactivity (CVR) is the ability of the cerebral arterioles to respond to changes in arterial CO2 partial pressure (PaCO2) in order to regulate blood flow and oxygen delivery to the brain. Under normal conditions, hypercapnia, an increase in PaCO2, will cause the cerebral arterioles to dilate reducing vascular resistance and increasing cerebral blood flow (CBF). Hypocapnia, a decrease in arterial PaCO2, will cause the cerebral arterioles to constrict increasing vascular resistance and reducing CBF.
Cerebral vasoreactivity is most commonly tested by having subjects breathe increasing concentrations of CO2 or administering acetazolamide to increase PaCO2, or by having subjects voluntarily hyperventilate to decrease PaCO2 (Manno and Koroshetz 1999). Measurement of CVR has been used to evaluate cerebral vascular function over a broad range of clinical applications including to monitor the severity of brain damage after an ischemic event (Dohmen et al. 2007), to predict the risk of a cerebral ischemic event in patients with carotid occlusive disease (Diehl 2002; Kleiser and Widder 1992; Markus and Cullinane 2001; Vernieri et al. 1999, Webster et al. 1995; Yonas et al. 1993), to assess the efficacy of a carotid endarterectomy (Herzig et al. 2004), and to study anxiety disorders (Giardino et al. 2007; Mathew and Wilson 1997) and migraine attacks (Akin and Bilensoy 2006).
Magnetic resonance imaging (MRI) (Kassner and Roberts 2004; Kastrup et al. 2001; Posse et al. 1997), positron emission tomography (PET) (de Boorder et al. 2006, Steiner et al. 2003), and near infrared spectroscopy (NIRS) (Smielewski et al. 1995) techniques have all been used to monitor changes in CBF with changes in PaCO2. The most common method used to assess CVR though, is transcranial Doppler ultrasonography (TCD) (Dahl et al. 1994; Markwalder et al. 1984; Ringelstein et al. 1988; Settakis et al. 2003). TCD provides a low-cost, non-invasive means to measure blood flow velocities in the larger cerebral blood vessels in real-time.
A study was conducted to test the feasibility of using TPI to assess CVR. Brain tissue pulsatility was measured in four subjects through the temporal acoustic window using a standard, general-purpose US scanner. Tissue pulsatility was measured before, during, and after voluntary hyperventilation, and the results were correlated with the subjects’ end-tidal CO2 measurements collected concurrently with US acquisition.
MATERIALS AND METHODS
Subjects
Four subjects, all male, ages 29, 33, 41, and 52, participated in the study. No effort was made to control day of the week, time of day, or caffeine intake. Written informed consent was obtained from all subjects. The research protocol was approved by the University of Washington Human Subjects Committee.
Protocol
During a study, the subject lay supine on a massage table (Stronglite Inc., Cottage Grove, OR, USA) with his head stabilized in a custom-built, padded fixture. Before the study, ECG leads were attached to the subject’s arms, and a cannula was placed in the nostrils to collect expired air. A Terason 4V2 phased-array transducer (Teratech Corp., Burlington, MA, USA) held by an articulated clamp (Manfrotto, Bassano del Grappa, Italy) securely mounted to the table was positioned over the right US temporal window, slightly anterior and superior to the ear. Before locking the clamp in place, the transducer was positioned by an experienced sonographer to image a nearly transverse plane through the cerebral peduncles.
Each study consisted of three phases, a pre-hyperventilation phase lasting 6 min 40 s, a voluntary hyperventilation phase lasting 20 min, and a post-hyperventilation phase lasting 20 min. During the pre and post-hyperventilation phases, the subject was instructed to breath normally through his nostrils to maintain an end-tidal CO2 around 40 mmHg. During the hyperventilation phase, the subject was instructed to breathe rapidly (approximately 1 breath every 2 s) through his nostrils to maintain an end-tidal CO2 around 20 mmHg. Although not explicitly instructed to do so, subjects maintained a relatively constant depth of respiration throughout the hyperventilation phase.
Data acquisition
The data acquisition system (Fig. 1) consisted of a Terason 2000 laptop-based, general-purpose US Scanner (Teratech Corp., Burlington, MA, USA), a personal computer with a Measurement Computing (Middleboro, MA, USA) PCI-DAS 1000 12-bit digitizer sampling at 1 kHz for recording the subject’s ECG and end-tidal CO2 signals, an arbitrary waveform generator (33120A, Agilent Technologies, Palo Alto, CA, USA) for triggering the US scanner and the digitizer, a CO2 monitor (Capnocheck Plus 9004, Smiths Medical PM, Inc., Waukesha, WI, USA), and an ECG monitor (VSM2, Physio-Control, Redmond, WA, USA). The output of the ECG monitor was a TTL (transistor-transistor logic) signal coincident with the subject’s ECG R-wave.
Fig. 1.
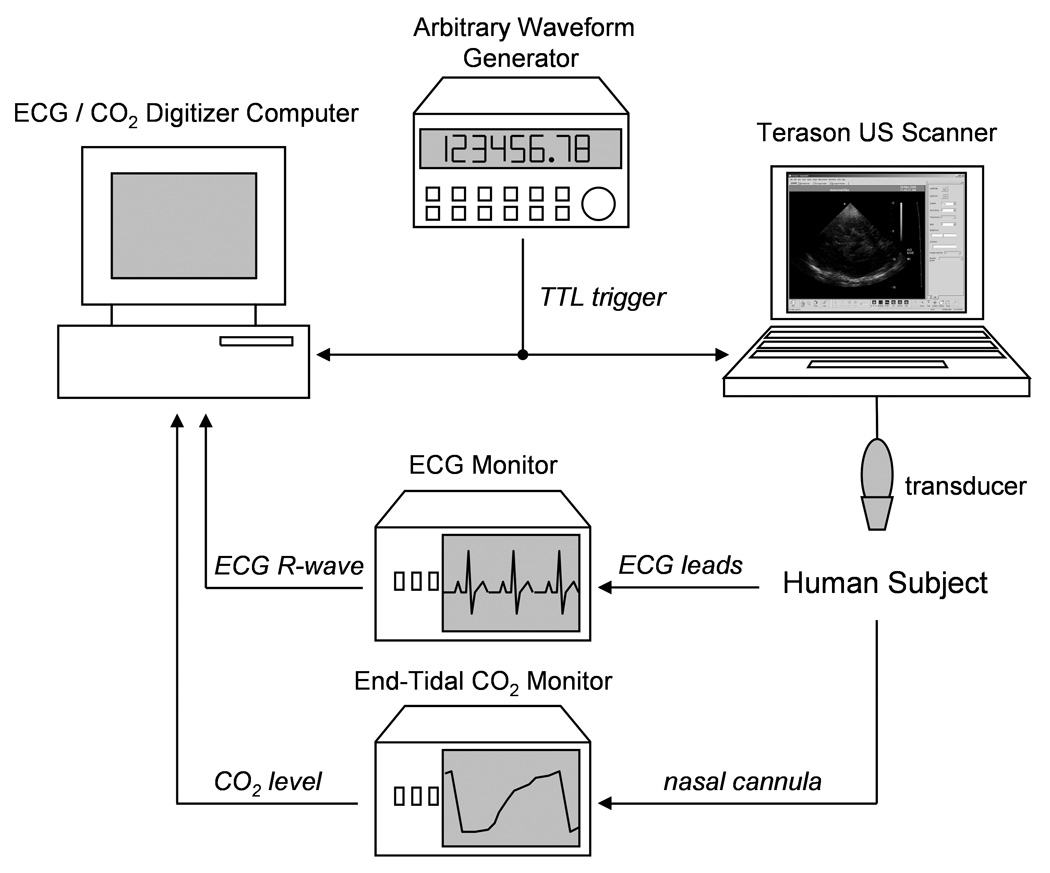
Data collection hardware schematic.
The 4V2 phased array scanhead (90° sector angle, 64 element, 2.5 MHz center frequency, 10 MHz RF sampling frequency, 128 scanlines per frame, approximately 55% fractional bandwidth B-mode pulse) was used for US acquisition. With software provided by the manufacturer, a series of post-beamformed US RF (radiofrequency) frames were collected during B-mode imaging for off-line analysis in MATLAB (The Mathworks, Inc., Natick, MA, USA). The arbitrary waveform generator was programmed to output a 100 ms TTL pulse once every 40 s to trigger the digitizer and US scanner using the US scanner’s ECG triggering feature. With each trigger, 240 frames of RF US were collected at 30 frames per second. This corresponds to 10, 30, and 30 data sets collected before, during, and after hyperventilation, respectively. To automate the data collection by the US scanner, AutoHotkey (http://www.autohotkey.com) was used to arm the Terason 2000 and save data at the appropriate times without user intervention once the study was started.
Data Analysis
The data analysis steps are shown in Fig. 2. The analytic versions of the post-beamformed RF US signals were first calculated using the Hilbert transform. From the analytic signals, tissue displacement was calculated using the 2-D autocorrelation estimator (Loupas et al. 1995), which estimates the mean change in phase of the quadrature-demodulated or analytic signal in slow-time, i.e., pulse-to-pulse, as well as fast-time, i.e., depth-to-depth. If multiple scan lines are included in the calculation, the displacement for a particular sample volume can be written as:
| (1) |
where “arg” is the argument, i.e., phase angle, of the autocorrelation function, c is the speed of US, ts is the depth-to-depth sampling period, Z is the analytic signal indexed by depth i, scan line j, and frame k, and where I, J, and K are the number of depths, scan lines, and frames, respectively, over which the measurement is made. For this work, we used I = 39 (3.00 mm), J = 2 (0.025 rad), and K = 2 (2 frames). Displacement for the first frame was set to 0, and displacement for subsequent frames was calculated from the cumulative displacement from previous frames (Kucewicz et al. 2004, 2007).
Fig. 2.
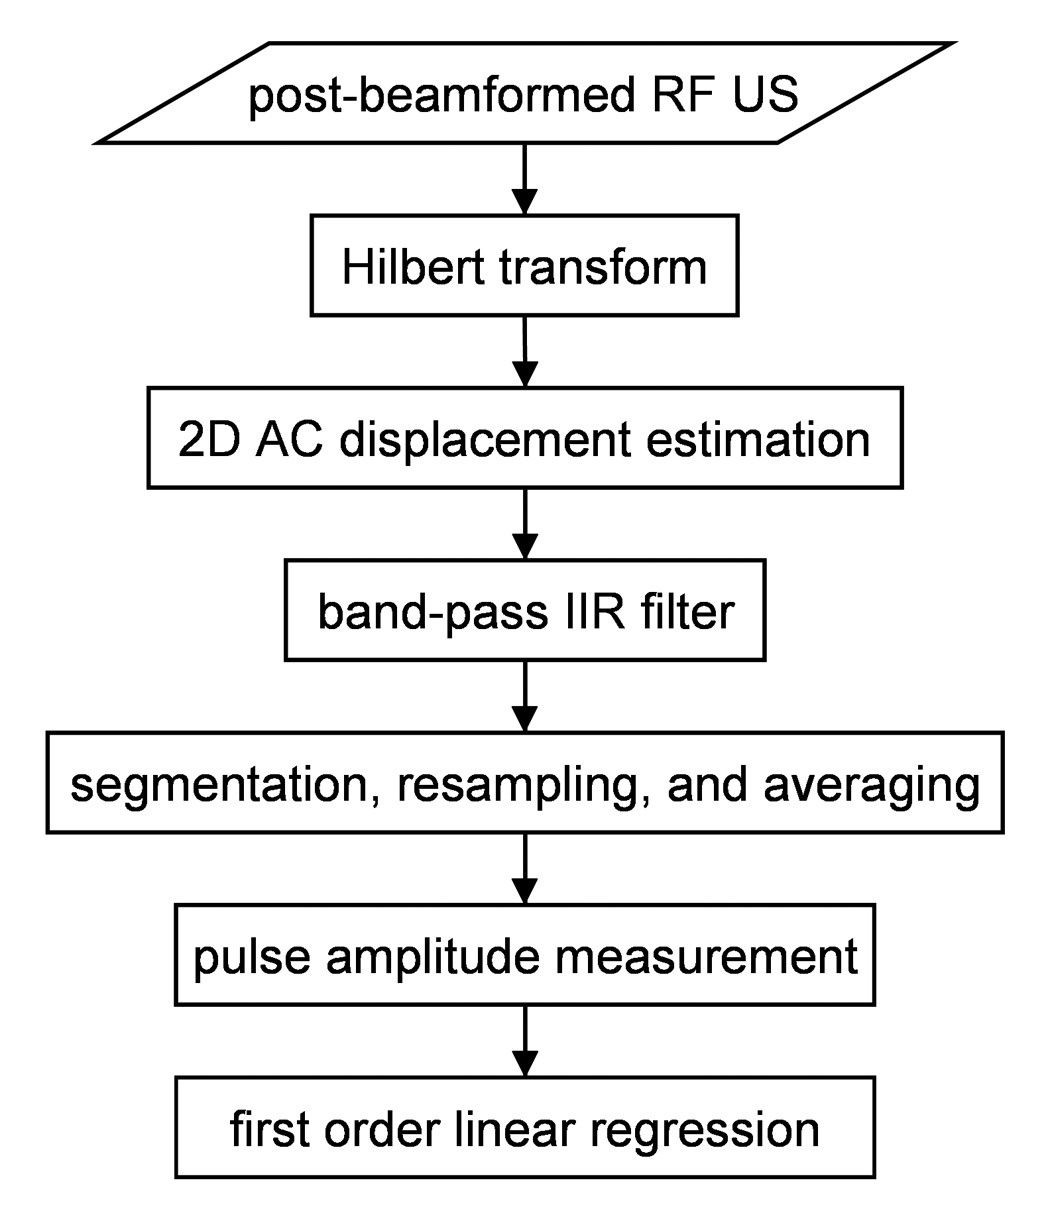
Data analysis flow diagram.
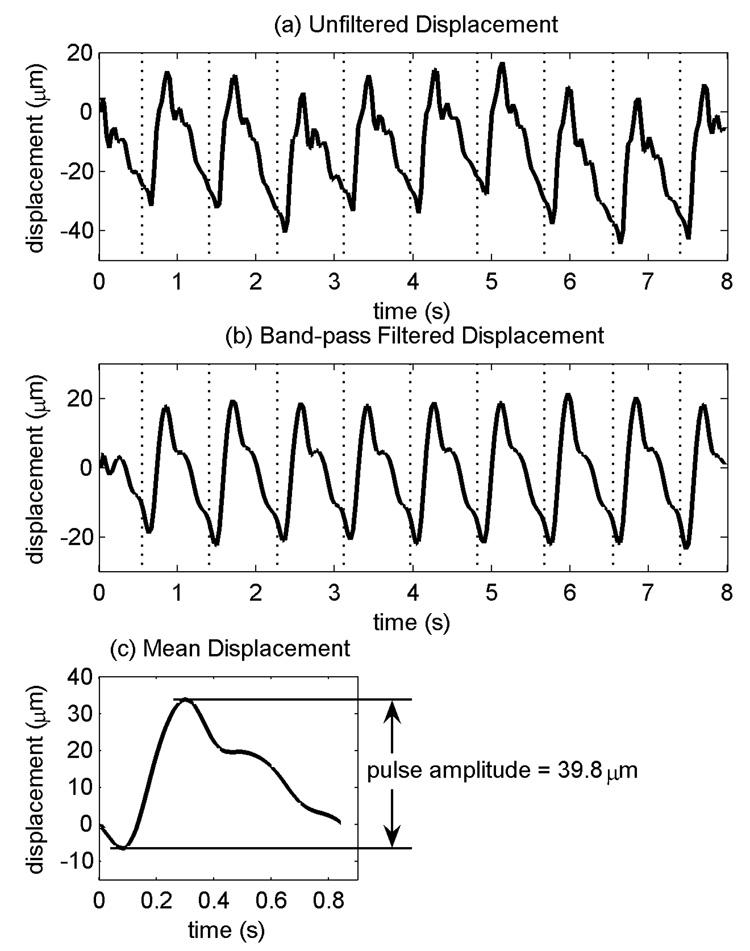
The displacement waveforms for all of the sample volumes for each data set were first forward and reverse filtered using a sixth-order, bandpass Butterworth IIR filter with a passband between three-quarters and five times the mean cardiac frequency, which was calculated for each data set from the subject’s ECG R-wave intervals recorded concurrently with the US data (Fig 3). The lower frequency limit was selected to remove tissue motion synchronized with respiration which approached 0.5 Hz during the hyperventilation phase while retaining pulsatile tissue motion synchronized with the cardiac cycle, which was typically around 0.9 Hz or greater. The upper frequency limit was selected to minimize higher frequency noise while maintaining the majority of the motion synchronized with the cardiac cycle.
Fig. 3.
(a) Displacement waveform from one data set from a single sample volume from subject 4 prior to band-pass filtering. (b) Displacement waveform after filtering. (c) Mean displacement waveform calculated by averaging cardiac cycles from (b). Vertical dotted lines indicate the beginning of each cardiac cycle.
For each sample volume, the displacement waveform was parameterized by its “pulse amplitude”, i.e., the displacement of the sample volume during the systolic phase of the cardiac cycle (Fig. 3c). Each displacement waveform was first segmented into its individual cardiac cycles using the ECG R-waves, and each segmented cardiac cycle of displacement was then resampled at 30 Hz by linear interpolation such that the first time point in each cycle coincided with its R-wave. The resampled displacement waveforms were then averaged to yield a mean displacement waveform for each sample volume. To calculate pulse amplitude, the displacement extrema occurring during the first 0.5 s of the mean displacement waveform were identified, and the pulse amplitude was calculated by subtracting the earlier extremum displacement, the pre-systolic displacement, from the later extremum displacement, the peak systolic displacement. Positive pulse amplitude indicates displacement towards transducer during systole, and negative pulse amplitude indicates displacement away from the transducer.
The pulse amplitudes for each sample volume across all 70 data sets were then fit to the end-tidal CO2 measurements using first-order linear regression (Fig. 4). The maximum end-tidal CO2 recorded during each 8 s data set was used to represent the end-tidal CO2 during the data set. The p-value of the linear regression was used to identify sample volumes with pulse amplitudes significantly correlated with the end-tidal CO2 signal.
Fig. 4.
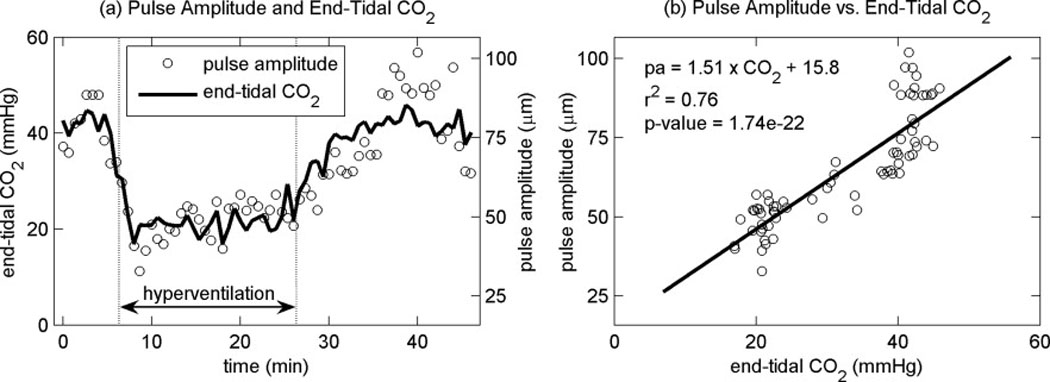
(a) End-tidal CO2 from subject 3 along with the pulse amplitude measurements from a single sample volume. (b) Pulse amplitude versus end-tidal CO2 from the same sample volume along with the best-fit line with first-order linear regression. “pa” in the inset equation is pulse amplitude and “CO2” is the end-tidal CO2 measurement.
RESULTS
Figure 5 shows a BMode image from one of the subjects along with the pulse amplitudes from two data sets, one collected before hyperventilation when the subject’s end-tidal CO2 was 41.7 mmHg, and one collected during hyperventilation when the subject’s end-tidal CO2 was 20.7 mmHg. The images show large regions of brain tissue pulsating up to ±75 µm under normal breathing conditions and a significant reduction in the pulse amplitude during hyperventilation. In both cases, the pulsation is predominantly away from the transducer in the hemisphere closest to the transducer and is towards the transducer in the contralateral hemisphere.
Fig. 5.
BMode image and pulse amplitude images from subject 2. (a) Transverse BMode image of the brain and skull. (b) Pulse amplitude image prior to hyperventilation with an end-tidal CO2 of 41.7 mmHg. (c) Pulse amplitude image during hyperventilation with an end-tidal CO2 of 20.7 mmHg. Positive pulse amplitude indicates displacement towards the US transducer during systole. Negative pulse amplitude indicates displacement away from the US transducer during systole.
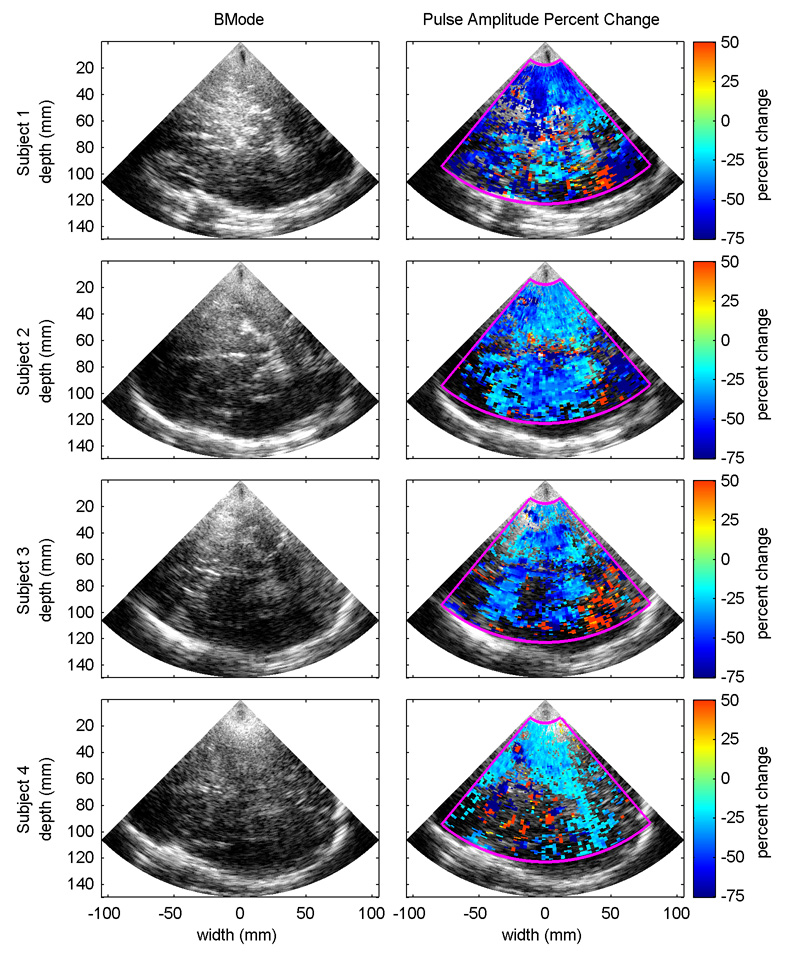
Fig. 6 shows BMode images from all of the subjects along with the predicted percent change in pulse amplitude for a change in end-tidal CO2 from 40 mmHg to 20 mmHg for samples volumes with linear regression p-values less than 0.01. The BMode images come from the first frame of the first data set for each subject. The predicted pulse amplitudes at 40 mmHg and 20 mmHg are calculated using the equation derived for each sample volume from the first-order linear regression of the measured pulse amplitudes onto the end-tidal CO2 signal. Percent change is calculated by subtracting the pulse amplitude at 20 mmHg from the pulse amplitude at 40 mmHg and dividing the result by the pulse amplitude at 40 mmHg. Although some regions of increased pulsatility were observed, tissue pulsatility decreased with decreasing PaCO2 for all subjects in the vast majority of sample volumes with p-values less than 0.01.
Fig. 6.
BMode image (left column) from the four subjects along with the expected percent change in pulse amplitude for a decrease in end-tidal CO2 from 40 mmHg to 20 mmHg (right column). Pulse amplitude percent change is only shown for sample volumes where the linear regression p-value of pulse amplitude onto end-tidal CO2 was less than 0.01.
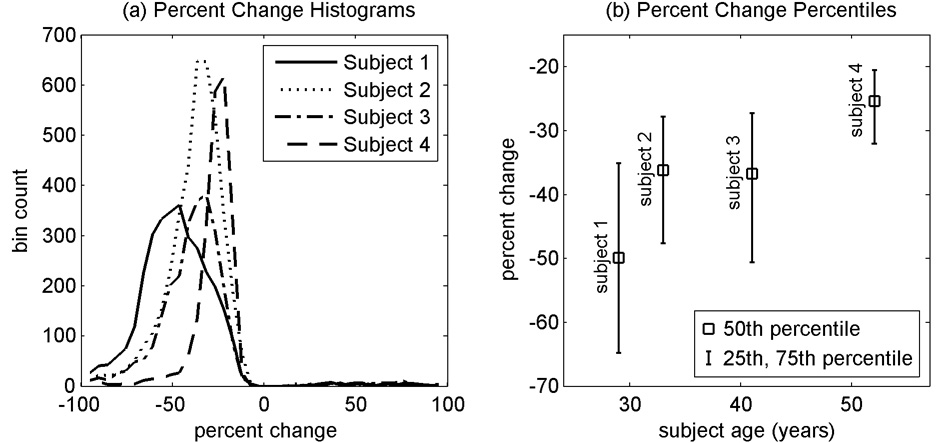
Fig. 7a shows the histograms of percent changes from the four subjects for sample volumes with linear regression p-values less that 0.01. Fig. 7b shows the median, 25th and 75th percentiles for percent changes for p-values less than 0.01 arranged by subject age. The tissue pulsatility response to hypocapnia appears to decrease with age although with only four subjects, it is not possible to conclude that this trend is real and significant. This is consistent, however, with other studies that indicate a decrease in CVR with age (Reich and Rusinek 1989; Tsuda and Hartmann 1989; Yamaguchi et al. 1979) and age-related cerebrovascular disease (Groschel et al. 2007).
Fig. 7.
Percent changes in pulse amplitude for a decrease in end-tidal CO2 from 40 mmHg to 20 mmHg for ultrasound sample volumes with p-values less than 0.01 for the linear regression of pulse amplitude onto end-tidal CO2.
DISCUSSION
In this study, we demonstrate statistically significant changes in tissue pulsatility in the brain in response to hypocapnia induced by voluntary hyperventilation. In all subjects, the tissue pulsatility predominantly decreased with hyperventilation. There were, however, regions where pulsatility increased and regions without statistically significant changes in pulsatility. With TPI, our ability to accurately resolve tissue motion is affected by the amplitude and direction of motion along with the US signal-to-noise ratio (SNR). At the beginning of each cardiac cycle, the brain displaces medially towards the ventricles and posteriorly and caudally towards the foramen magnum. As a result, there is a gradient of motion across the brain. The amplitude of displacement is least near the surface of the skull and greatest near the ventricles and the foramen magnum (Maier et al. 1994; Poncelet et al. 1992). With conventional Doppler US we can only measure the projected component of displacement parallel to the direction of US propagation. Because the displacement in the brain is not isotropic, the measured displacement will generally be less than the true displacement.
The effect of this is evidenced by the heterogeneity in the magnitude of the pulse amplitude, i.e., the absolute value of the pulse amplitude, between the two hemispheres (Fig. 5). In both the normocapnic and hypocapnic cases, the absolute pulse amplitude measured in the left anterior hemisphere is greater than the absolute pulse amplitude measured in the right anterior hemisphere. It is assumed that corresponding sample volumes in the two hemispheres are displaced with equal magnitudes but in opposite directions in the medial direction. If this assumption is true, it would mean that the angle between the direction of ultrasound propagation and the direction of displacement in the sample volume in the ipsilateral hemisphere (with respect to the ultrasound transducer) would be greater than the angle between the direction of ultrasound propagation and the direction of displacement in the contralateral sample volume, making the measured absolute pulse amplitude less in the ipsilateral sample volume than in the corresponding contralateral sample volume. Assuming that the direction of displacement does not change with hypocapnia, underestimation of the true pulse amplitude by a constant factor would not alter the percent change in pulse amplitude.
As with all US measurements, the measurement of pulse amplitude and the detection of significant changes in pulse amplitude are influenced by US SNR. Compared to other locations in the body, the SNR from the brain can be particularly poor given the significant attenuation of US by the skull (Fry and Barger 1978). As SNR decreases, the variance in the pulse amplitude estimate increases. This variance is of greater significance when the true pulse amplitude is small, as near the surface of the skull. As shown in Fig. 6, all of the subjects have regions without statistically significant changes in pulse amplitude, which we believe is most likely explained by poor SNR and not by a true lack of change in pulse amplitude.
Also evident are regions of statistically significant increases in pulse amplitude with hyperventilation, which in subjects 1 and 3 and less so in subject 2 are concentrated around the posterior temporal lobe. It is unclear if these regions are the result of low SNR or if the response is real. It has been shown using functional MRI that multiple regions distributed around the brain are activated during voluntary breathing (Macefield et al. 2006; McKay et al. 2003). Furthermore, it has been shown that TPI can be used to detect a stimulus-evoked regional activation in the brain (Kucewicz et al. 2007). Given the limited number of subjects, and given the weak US signal strength and small pulse amplitudes in this region for all three subjects, it is difficult to conclude that this effect is real, but it is possible that the act of hyperventilating is activating regions of the brain thereby increasing blood flow to the regions and increasing the local tissue pulsatility.
In addition to the inter-subject variability in mean percent change in pulse amplitude with hypocapnia, which may be attributable to age differences as previously discussed, there are differences in the fractional areas of the subjects’ brains with statistically significant changes in pulse amplitude. Some of this seems to be due to differences in the general level of brain pulsatility between the subjects. Statistically significant changes in pulse amplitude were detected in more of subject 2’s brain than any other subject. Pulsatility throughout the brain also tended to be considerably greater before, during, and after hyperventilation in subject 2’s brain compared to the other subjects. Because the brain displacement was generally greater in subject 2 thereby decreasing the influence of noise on the measured pulse amplitude, the likelihood of establishing statistical significance was greater.
The ultrasound system used for the study may have also contributed to the heterogeneity of the TPI signal within and between subjects. The US scanner used was a commercially available system with a phased array transducer that was not optimized for transcranial imaging. Therefore, the frequency and power settings are not optimized for our application. Furthermore, the transducer was a standard handheld transducer held by an articulated clamp. Although relatively stable, the long moment arm potentially introduced some mechanical instability.
Because TPI is based on US, it maintains the qualities of being a rapid, portable, inexpensive tool that can be used for continuous monitoring in almost any setting. The advantage of TPI over TCD for assessing CVR is the use of tissue rather than blood as the signal source. US backscatter from tissue is significantly stronger than that from blood which is particularly important when imaging the brain given the significant attenuation of US by the skull (Fry and Barger 1978). Because of this, TCD is generally limited to imaging blood flow in the major cerebral blood vessels that supply large portions of the brain. With TPI, the increased US backscatter from tissue enables us to image brain displacement as a surrogate for blood flow through locations on the skull other than the three traditional acoustic windows (Kucewicz et al. 2007). This could theoretically better localize regions of the brain with poor CVR caused by disease or trauma. One potential alternative to both TPI and conventional TCD is transcranial US using echo-contrast agents (Heppner et al. 2006; Meyer-Wiethe el al. 2007). This would allow better visualization of localized cerebral perfusion but would increase the cost and complexity of the examination.
SUMMARY
This paper presents the results of a feasibility study to determine if TPI could be used to monitor CVR. In subjects with normal CVR, hypocapnia induces vasoconstriction which decreases CBF. Brain tissue displacement was measured in four subjects before, during, and after 20 min of voluntary hyperventilation. In all four subjects, decreases in tissue pulsatility were observed that were statistically significantly correlated with the subject’s end-tidal CO2 measurements. The median percent change in tissue pulsatility for a change in end-tidal CO2 from 40 mmHg to 20 mmHg ranged from −50% for the youngest subject to −25% for the oldest subject. Additional studies are needed to expand the results to a larger population of normals and to establish if the technique can accurately identify subjects with compromised CVR.
Acknowledgements
The work was funded by the National Institutes of Health (1 R01 EB002198-01).
Footnotes
Publisher's Disclaimer: This is a PDF file of an unedited manuscript that has been accepted for publication. As a service to our customers we are providing this early version of the manuscript. The manuscript will undergo copyediting, typesetting, and review of the resulting proof before it is published in its final citable form. Please note that during the production process errors may be discovered which could affect the content, and all legal disclaimers that apply to the journal pertain.
REFERENCES
- Akin A, Bilensoy D. Cerebrovascular reactivity to hypercapnia in migraine patients measured with near-infrared spectroscopy. Brain Res. 2006;1107(1):206–214. doi: 10.1016/j.brainres.2006.06.002. [DOI] [PubMed] [Google Scholar]
- Beach KW, Philips DJ, Kansky J. Ultrasonic plethysmograph. # 5,088,498. US Patent. 1992
- Beach KW, Philips DJ, Kansky J. Ultrasonic plethysmograph. # 5,183,046. US Patent. 1993
- Beach KW, Philips DJ, Kansky J. Ultrasonic plethysmograph. # 5,289,820. US Patent. 1994
- de Boorder MJ, van der Grond J, van Dongen AJ, Klijn CJ, Jaap Kappelle L, Van Rijk PP, Hendrikse J. Spect measurements of regional cerebral perfusion and carbondioxide reactivity: correlation with cerebral collaterals in internal carotid artery occlousive disease. J Neurol. 2006;253(10):1285–1291. doi: 10.1007/s00415-006-0192-1. [DOI] [PubMed] [Google Scholar]
- Campbell JK, Clark JM, White DN, Jenkins CO. Pulsatile echo-encephalography. Acta Neurol Scand Suppl. 1970;45:1–57. [PubMed] [Google Scholar]
- Dahl A, Russell D, Nyberg-Hansen R, Rootwelt K, Mowinckel P. Simultaneous assessment of vasoreactivity using transcranial Doppler ultrasound and cerebral blood flow in healthy subjects. J Cereb Blood Flow Metab. 1994;14(6):974–981. doi: 10.1038/jcbfm.1994.130. [DOI] [PubMed] [Google Scholar]
- Diehl RR. Cerebral autoregulation studies in clinical practice. Eur J Ultrasound. 2002;16(1–2):31–36. doi: 10.1016/s0929-8266(02)00048-4. [DOI] [PubMed] [Google Scholar]
- Dohmen C, Bosche B, Graf R, Reithmeier T, Ernertus RI, Brinker G, Sobesky J, Heiss WD. Identification and clinical impact of impaired cerebrovascular autoreguation in patients with malignant middle cerebral artery infarction. Stroke. 2007;38(1):56–61. doi: 10.1161/01.STR.0000251642.18522.b6. [DOI] [PubMed] [Google Scholar]
- Fry FJ, Barger JE. Acoustical properties of the human skull. J Acoust Soc Am. 1978;63(5):1576–1590. doi: 10.1121/1.381852. [DOI] [PubMed] [Google Scholar]
- Gao L, Parker KJ, Lerner RM, Levinson SF. Imaging of the elastic properties of tissue – a review. Ultrasound Med Biol. 1996;22(8):959–977. doi: 10.1016/s0301-5629(96)00120-2. [DOI] [PubMed] [Google Scholar]
- Giardino ND, Friedman SD, Dager SR. Anxiety, respiration, and cerebral blood flow: implications for functional brain imaging. Compr Psychiatry. 2007;48:103–112. doi: 10.1016/j.comppsych.2006.11.001. [DOI] [PMC free article] [PubMed] [Google Scholar]
- Groschel K, Terborg C, Schnaudigel S, Ringer T, Riecker A, Witte OW, Kastrup A. Effects of physiological aging and cerebrovascular risk factors on the hemodynamic response to brain activation: a functional transcranial Doppler study. Eur J Neurol. 2007;14(2):125–131. doi: 10.1111/j.1468-1331.2006.01563.x. [DOI] [PubMed] [Google Scholar]
- Heimdal A, Støylen A, Torp H, Skjærpe T. Real-time strain rate imaging of the left ventricle by ultrasound. J Am Soc Echocardiogr. 1997;11(11):1013–1019. doi: 10.1016/s0894-7317(98)70151-8. [DOI] [PubMed] [Google Scholar]
- Heppner P, Ellegala DB, Durieux M, Jane JA, Sr, Lindner JR. Contrast ultrasonographic assessment of cerebral perfusion in patients undergoing decompressive craniectomy for traumatic brain injury. J Neurosurg. 2006;104(5):738–745. doi: 10.3171/jns.2006.104.5.738. [DOI] [PubMed] [Google Scholar]
- Herzig R, Hlustik P, Urbanke K, Vaverka M, Burval S, Machac J, Vlachova I, Krupka B, Bartkova A, Sanak D, Mares J, Kanovsky P. Can we identify patients with carotid occlusion who would benefit from EC/IC bypass? Review. Biomed Pap Med Fac Univ Palacky Olomouc Czech Repub. 2004;148(2):119–122. [PubMed] [Google Scholar]
- Kanai H, Koiwa Y, Zhang J. Real-time measurements of local myocardium motion and arterial wall thickening. IEEE Trans Ultrason Ferroelec Control. 1999;46(5):1229–1241. doi: 10.1109/58.796128. [DOI] [PubMed] [Google Scholar]
- Kassner A, Roberts TP. Beyond perfusion – cerebral vascular reactivity and assessment of microvascular permeability. Top Magn Reson Imaging. 2004;15(1):58–65. doi: 10.1097/00002142-200402000-00006. [DOI] [PubMed] [Google Scholar]
- Kastrup A, Kruger G, Newumann-Haefelin T, Moseley ME. Assessment of cerebrovascular reactivity with functional magnetic resonance imaging: comparison of CO2 and breath holding. Magn Reson Imaging. 2001;19(1):13–20. doi: 10.1016/s0730-725x(01)00227-2. [DOI] [PubMed] [Google Scholar]
- Kleiser B, Widder B. Course of carotid artery occlusions with impaired cerebrovascular reactivity. Stroke. 1992;23(2):171–174. doi: 10.1161/01.str.23.2.171. [DOI] [PubMed] [Google Scholar]
- Kowalski M, Kukulski T, Jamal F, D’hooge K, Weidemann F, Rademakers F, Bijnens B, Hatle L, Sutherland GR. Can strain and strain rate quantify regional myocardial deformation? A study in healthy subjects. Ultrasound Med Biol. 2001;27(8):1087–1097. doi: 10.1016/s0301-5629(01)00388-x. [DOI] [PubMed] [Google Scholar]
- Kucewicz JC, Huang L, Beach KW. Plethysmographic arterial waveform strain discrimination by Fisher’s method. Ultrasound Med Biol. 2004;30(6):773–782. doi: 10.1016/j.ultrasmedbio.2004.04.002. [DOI] [PubMed] [Google Scholar]
- Kucewicz JC, Dunmire B, Leotta DF, Panagiotides H, Paun M, Beach KW. Functional tissue pulsatility imaging of the brain during visual stimulation. Ultrasound Med Biol. 2007;33(5):681–690. doi: 10.1016/j.ultrasmedbio.2006.11.008. [DOI] [PMC free article] [PubMed] [Google Scholar]
- Leksell L. Echo-encephalography: I Detection of intracranial complications following head surgery. Acta Chir Scand. 1956;110(4):301–315. [PubMed] [Google Scholar]
- Loupas T, Powers JT, Gill RW. An axial velocity estimator for ultrasound blood flow imaging, based on a full evaluation of the Doppler equation by means of a two-dimensional autocorrelation approach. IEEE Trans Ultrason Ferroelectr Freq Control. 1995;42(4):672–688. [Google Scholar]
- Macefield FG, Gandevia SC, Henderson LA. Neural sites involved in the sustained increase in muscle sympathetic nerve activity induced by inspiratory capacity apnea: a fMRI study. J Appl Physiol. 2006;100(1):266–273. doi: 10.1152/japplphysiol.00588.2005. [DOI] [PubMed] [Google Scholar]
- Maier SE, Hardy CJ, Jolesz FA. Brain and cerebrospinal fluid motion: real-time quantification with M-mode MR imaging. Radiology. 1994;193(2):477–483. doi: 10.1148/radiology.193.2.7972766. [DOI] [PubMed] [Google Scholar]
- Manno EM, Koroshetz WJ. Cerebral blood flow. In: Babikian VL, Wechsler LR, editors. Transcranial Doppler Ultrasonography. Boston, MA: Butterworth-Heinemann; 1999. pp. 77–81. [Google Scholar]
- Markus H, Cullinane M. Severely impaired cerebrovascular reactivity predicts stroke and TIA risk in patients with carotid artery stenosis and occlusion. Brain. 2001;124(Pt 3):457–467. doi: 10.1093/brain/124.3.457. [DOI] [PubMed] [Google Scholar]
- Markwalder TM, Grolimund P, Seiler RW, Roth F, Aaslid R. Dependency of blood flow velocity in the middle cerebral artery on end-tidal carbon dioxide partial pressure – a transcranial ultrasound Doppler study. J Cereb Blood Flow Metab. 1984;4(3):368–372. doi: 10.1038/jcbfm.1984.54. [DOI] [PubMed] [Google Scholar]
- Mathew RJ, Wilson WH. Intracranial and extracranial blood flow during acute anxiety. Psychiatry Res. 1997;74(2):93–107. doi: 10.1016/s0925-4927(97)03106-5. [DOI] [PubMed] [Google Scholar]
- McDicken WN, Sutherland GR, Moran CM, Gordon LN. Colour Doppler velocity imaging of the myocardium. Ultrasound Med Biol. 1992;18(6–7):651–654. doi: 10.1016/0301-5629(92)90080-t. [DOI] [PubMed] [Google Scholar]
- McKay LC, Evans KC, Frackowiak RSJ, Corfield DR. Neural correlates of voluntary breathing in humans. J Applied Physiol. 2003;95(3):1170–1178. doi: 10.1152/japplphysiol.00641.2002. [DOI] [PubMed] [Google Scholar]
- Meyer-Wiethe K, Cangür H, Schindler A, Koch C, Seidel G. Ultrasound perfusion imaging: determination of thresholds for the identification of critically disturbed perfusion in acute ischemic stroke – a pilot study. Ultrasound Med Biol. 2007;33(6):851–856. doi: 10.1016/j.ultrasmedbio.2006.12.006. [DOI] [PubMed] [Google Scholar]
- Moehring MA, Wilson BP, Beach KW. Intrcranial bleed monitor; Proceedings IEEE Ultrasonics Symposium; 1999. pp. 1545–1549. [Google Scholar]
- Ophir J, Alam SK, Garra B, Kallel F, Konofagou E, Krouskop T, Varghese T. Elastography: ultrasonic estimation and imaging of the elastic properties of tissues. Proc Inst Mech Eng [H] 1999;213(H3):203–233. doi: 10.1243/0954411991534933. [DOI] [PubMed] [Google Scholar]
- Ophir K, Cespedes I, Ponnekanti H, Yazdi Y, Li X. Elastrography: a quanitative method of imaging the elasticity of biological tissues. Ultrason Imaging. 1991;13(2):111–134. doi: 10.1177/016173469101300201. [DOI] [PubMed] [Google Scholar]
- Poncelet BP, Wedeen VJ, Weisskoff RM, Cohen MS. Brain parenchyma motion: measurement with cine echo-planar MR Imaging. Radiology. 1992;185(3):645–651. doi: 10.1148/radiology.185.3.1438740. [DOI] [PubMed] [Google Scholar]
- Posse S, Olthoff U, Weckesser M, Jäncke L, Müller-Gärtner HW, Dager SR. Regional dynamic signal changes during controlled hyperventilation assessed with blood oxygen level-dependent functional MR imaging. AJNR Am J Neuroradiol. 1997;18(9):1763–1770. [PMC free article] [PubMed] [Google Scholar]
- Reich T, Rusinek H. Cerebral cortical and white matter reactivity to carbon dioxide. Stoke. 1989;20(4):453–457. doi: 10.1161/01.str.20.4.453. [DOI] [PubMed] [Google Scholar]
- Ringelstein EB, Sievers C, Ecker S, Schneider PA, Otis SM. Noninvasive assessment of CO2-induced vasomotor response in normal individuals and patients with internal carotid artery occlusions. Stroke. 1988;19(8):963–969. doi: 10.1161/01.str.19.8.963. [DOI] [PubMed] [Google Scholar]
- Selbekk T, Bang J, Unsgaard G. Strain processing of intraoperative ultrasound images of brain tumous: initial results. Ultrasound Med Biol. 2005;31(5):45–51. doi: 10.1016/j.ultrasmedbio.2004.09.011. [DOI] [PubMed] [Google Scholar]
- Settakis G, Pall D, Molnar C, Bereczki D, Csiba L, Fulesdi B. Cerebrovascular reactivity in hypertensive and healthy adolescents: TCD and vasodilatory challenge. J Neuroimaging. 2003;13(2):106–112. [PubMed] [Google Scholar]
- Smielewski P, Kirkpatrick P, Minhas P, Pickard JD, Czosnyka M. Can cerebrovascular reactivity be measured with near-infrared spectroscopy? Stroke. 1995;26(12):2285–2292. doi: 10.1161/01.str.26.12.2285. [DOI] [PubMed] [Google Scholar]
- Steiner LA, Coles JP, Johnston AJ, Chatfield DA, Smielewski P, Fryer TD, Aigbirhio FI, Clark JC, Pickard JD, Menon DK, Czosnyka M. Assessment of cerebrovascular autoreguation in head-injured patients: a validation study. Stroke. 2003;34(10):2404–2409. doi: 10.1161/01.STR.0000089014.59668.04. [DOI] [PubMed] [Google Scholar]
- Strandness DR, Jr, Sumner DS. Hemodynamics for Surgeons. New York: Grune and Stratton; 1975. [Google Scholar]
- Taylor JC, Newell JA, Karvounis P. Ultrasonics in the diagnosis of intracranial space-occupying lesions. Lancet. 1961;1:1197–1199. doi: 10.1016/s0140-6736(61)91942-0. [DOI] [PubMed] [Google Scholar]
- Tsuda Y, Hartmann A. Changes in hyperfrontality of cerebral blood flow and carbon dioxide reactivity with age. Stroke. 1989;20(12):1667–1673. doi: 10.1161/01.str.20.12.1667. [DOI] [PubMed] [Google Scholar]
- Vernieri F, Pasqualetti P, Passarelli F, Rossini PM, Silvestrini M. Outcome of carotid artery occlusion is predicted by cerebrovascular reactivity. Stroke. 1999;30(3):593–598. doi: 10.1161/01.str.30.3.593. [DOI] [PubMed] [Google Scholar]
- de Vlieger M, Ridder HJ. Use of echoencephalography. Neurology. 1959;9:216–233. doi: 10.1212/wnl.9.4.216. [DOI] [PubMed] [Google Scholar]
- Webster MW, Makaroun MS, Steed DL, Smith HA, Johnson DW, Yonas H. Compromised cerebral blood flow reactivity is a predictor of stroke in patients with symptomatic carotid artery occlusive disease. J Vasc Surg. 1995;21(2):338–344. doi: 10.1016/s0741-5214(95)70274-1. [DOI] [PubMed] [Google Scholar]
- White DN. The early development of neurosonology: III. Pulsatile echoencephalography and Doppler techniques. Ultrasound Med Biol. 1992;4(18):323–376. doi: 10.1016/0301-5629(92)90045-c. [DOI] [PubMed] [Google Scholar]
- Yamaguchi F, Meyer JS, Sakai F, Yamamoto M. Normal human aging and cerebral vasoconstrictive responses to hypocapnia. J Neurol Sci. 1979;44(1):87–94. doi: 10.1016/0022-510x(79)90226-0. [DOI] [PubMed] [Google Scholar]
- Yonas H, Smith HA, Durham SR, Pentheny SL, Johnson DW. Increased stroke risk predicted by compromised cerebral blood flow reactivity. J Neurosurg. 1993;79(4):483–489. doi: 10.3171/jns.1993.79.4.0483. [DOI] [PubMed] [Google Scholar]


