

Abstract
Artemisinin is the active principle of the Chinese herb Artemisia annua L. In addition to its anti-malarial activity, artemisinin and its derivatives have been shown to exert profound anti-cancer activity. The endoperoxide moiety in the chemical structure of artemisinin is thought to be responsible for the bioactivity. Here, we analyzed the cytotoxicity and the ability of artemisinin, five of its derivatives, and two other endoperoxides to inhibit generation of nitric oxide (NO). In the RAW 264.7 mouse macrophage cell line, the well-established model cell line to analyze NO generation, artesunate revealed the highest ability to inhibit NO production among all compounds tested. In cytotoxicity assays (XTT assay), the IC50 value of RAW 264.7 cells for artesunate was determined to be 3.1 ± 0.7 μM. In order to associate the cytotoxic effects with specific alteration in gene expression related to NO metabolism and signaling, whole genome mRNA microarray analyses were conducted. RAW 264.7 cells were treated with artesunate using DMSO as vehicle control followed by microarray analysis. A total of 36 genes related to NO metabolism and signaling were found to be differentially expressed upon exposure to artesunate. Apart from NO-related genes, the expression of genes associated with other functional groups was also analyzed. Out of 24 functional groups, differential expression was most prominent in genes involved in cell-to-cell signaling and interactions. Further refinement of this analysis showed that the pathways for cAMP-mediated signaling and Wnt/β-catenin signaling were most closely related to changes in mRNA expression. In conclusion, NO generation and signaling play a role in exhibiting cytotoxic activity of artesunate. In addition, other signaling pathways also contribute to the inhibitory effect of artesunate towards RAW 264.7 cells pointing to a multi-factorial mode of action of artesunate.
Keywords: Artemisinin, Pharmacogenomics, Microarray, Nitric oxide, Pharmacognosy, Traditional Chinese medicine
Nitric oxide (NO) is a free radical produced by three enzymes, including inducible nitric oxide synthase (iNOS) from the amino acid l-arginine. In recent years, inhibition of inducible nitric oxide synthase (iNOS) turned out to be a subject of interest in the field of anti-inflammatory research. Overproduction of NO induced by the enzymatic activity of iNOS in various cell types have been shown to play a vital role in several inflammatory and also immunoregulatory processes. Additionally, it contributes to a number of pathophysiological conditions such as inflammation, cancer, rheumatoid arthritis, diabetes, liver cirrhosis, septic shock etc. [1,2]. There are reports that justifies fostering of chronic inflammation towards cancer development and involvement of NO in this process [3-5]. Supportive evidence from a few studies shows that high levels of NO are genotoxic and mutagenic [6-9]. Furthermore, NO regulates tumor growth, migration, invasion, survival, angiogenesis, and metastasis in a concentration-dependent manner [10]. Its role in tumorigenesis was established from studies that demonstrates the presence of NO and iNOS in higher amounts in cancerous tissues compared to their normal counterparts [11-15]. Therefore, NO and iNOS seem to be of great prognostic value in cancer research. Clinical investigations on several tumors types indicated that the expression of iNOS is associated with a poor survival of patients [16-19]. These data indicate that NO and iNOS may not only be valuable for diagnostic means but also for novel therapeutic options [20-22].
Previously, we found that the anti-malarial drug, artemisinin and its derivative, artesunate, also reveal profound cytotoxicity towards cancer cells [23-27]. The cytotoxic activity of artemisinins can be further enhanced upon of supplementation with iron [28-30].
Candidate genes that contribute to the sensitivity and resistance of tumor cells to artemisinins were identified by pharmacogenomic and molecular pharmacological approaches [31,32]. Target validation was performed using cell lines transfected with candidate genes or corresponding knockout cells. These genes belong to classes with different biological function; for example, regulation of proliferation (BUB3, cyclins, CDC25A), angiogenesis (vascular endothelial growth factor and its receptor, matrix metalloproteinase-9, angiostatin, thrombospondin-1) or apoptosis (BCL-2, BAX) [24,32,33]. Artesunate triggers apoptosis both by p53-dependent and -independent pathways [32]. Anti-oxidant stress genes (thioredoxin, catalase, γ-glutamyl-cysteine synthetase, glutathione S-transferases) as well as the epidermal growth factor receptor confer resistance to artesunate [34,35]. Cell lines over-expressing genes that confer resistance to established anti-tumor drugs (MDR1, MRP1, BCRP, dihydrofolate reductase, ribonucleotide reductase) were not cross-resistant to artesunate, indicating that artesunate is not involved in multidrug resistance [36]. The anticancer activity of artesunate has also been shown in human xenograft tumors in mice [37]. First experiences in the clinical treatment of patients suffering from uveal melanoma were encouraging [38].
Given the multi-factorial nature of artemisinin’s action, we were interested, whether artemisinin-type compounds exert their cytotoxic effects by inhibition of nitric oxide production. For this reason, we analyzed artemisinin, five artemisinin derivatives, and two other endoperoxides for their NO-inhibitory potential in RAW 264.7 mouse macrophage cells. RAW 264.7 cells represent a well-established experimental system for studying nitric oxide biology. XTT assays were performed to determine the cytotoxic activity of the compounds. To gain insight into molecular players involved in nitric oxide inhibition and cytotoxicity, we performed microarray experiments which were exemplarily validated by real time RT-PCR.
Materials and methods
Compounds
Artemisinin was purchased from Sigma–Aldrich (Taufkirchen, Germany) and artesunate from Saokim Pharma (Hanoi, Vietnam). The artemisinin derivatives nos. 2–4 as well as the two endoperoxides were synthesized by Dafra Pharma (Turnhout, Belgium) and artemisinin derivative no. 5 by Dr. Gary Posner (John Hopkins University, Department of Chemistry, Baltimore, MD, USA) [39]. The chemical structures are shown in Fig. 1.
Fig. 1.
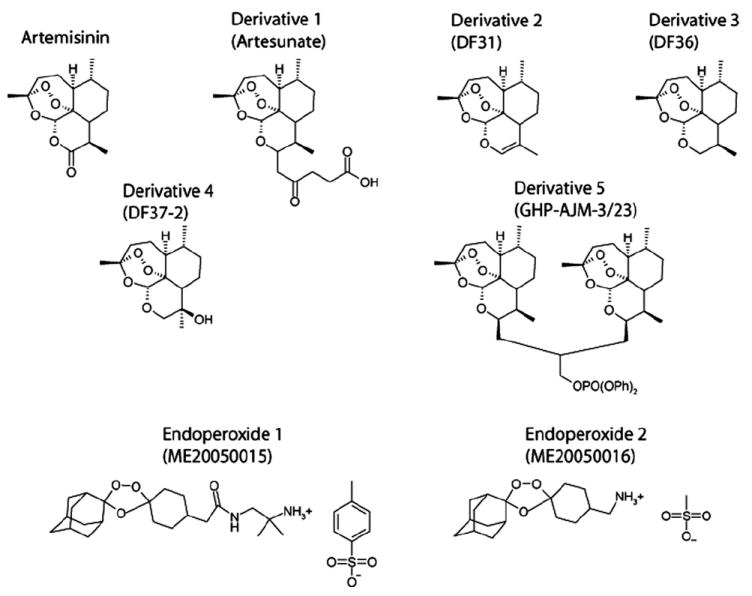
Chemical structures of artemisinins and derivatives.
Cells
RAW 264.7, a mouse macrophage cell line were cultured in Dulbecco’s Modified Eagle Medium (DMEM) supplemented with 2 mM glutamine, antibiotics (100 U/mL penicillin A and 100 U/mL streptomycin), and 10% heat-inactivated fetal bovine serum (FBS; PAA laboratories) and maintained in a 37 °C humidified incubator containing 5% CO2.
Measurement of NO release (by Griess assay)
LPS and IFN-γ have a synergistic effect on iNOS expression. LPS and IFN-γ activate iNOS expression pathway. iNOS causes the release of NO by converting l-arginine to l-citrulline. Therefore, RAW 264.7 cells were stimulated with 0.5 μg/mL lipopolysaccharides (LPS) and 50 U/mL interferon-gamma in presence or absence of the respective compound under study. After 16 h of incubation, the iNOS effects were determined by measuring nitrite release, which is an indicator for the involvement of iNOS activity. The NO concentration is quantified photometrically for the amounts of stable product nitrite produced in the cell culture supernatants using the Griess assay method. Each experiment was performed at least four times in duplicate and was compared with a standard curve plotted against different concentrations of sodium nitrite [40]. Activity is referred to nitrite accumulation of cells treated with LPS/IFN-γ/DMSO (0.1%) (Griess reagent (sulfanilamid/N-(1-naphthyl)-ethylene-diamine dihydrochloride).
XTT proliferation assay
Inhibition of proliferation was assessed using the standard 2,3-bis[2-methoxy-4-nitro-5-sulfophenyl]-2H-tetrazolium-5-carboxanilide inner salt (XTT) assay kit (Roche, Indianapolis, IN), which measures the metabolic activity of viable cells [41]. The toxicity of compounds was determined by means of the Cell Proliferation Kit II (Roche Diagnostics, Mannheim, Germany). This test is based on the cleavage of the yellow 2,3-bis[2-methoxy-4-nitro-5-sulfophenyl]-2H-tetrazolium-5-carboxanilide inner salt (XTT) by ubiquitous dehydrogenases leading to the formation of an orange formazan dye. The amount of dye is commensurate to the number of metabolic active cells. Fresh stock solutions of each compound were prepared in DMSO at a concentration of 100 mM. A dilution series ranging from 10−3 M to 10−9 M was prepared using DMEM medium to perform the XTT test. Cells were diluted to a final concentration of 1 × 10⁵ cells/mL. One hundred micro-liters of the cell suspension were sowed into the wells of a 96-well culture plate (Costar, Corning, USA). Marginal wells were filled with 100 μL of pure medium in order to minimize effects of evaporation. Besides, wells filled with medium were required to determine the background absorbance caused by non-metabolized XTT. A row of wells containing cells was left untreated and another row of wells containing cells was treated with 1 μL DMSO and this served as solvent control. The other rows of wells containing cells were supplemented with different concentrations of compound. Each concentration was tested in at least two independent plates containing different batches of cells.
After incubation with compounds at 37 °C, 5% CO2 in humidified atmosphere, XTT reagent was freshly prepared and added to each well as specified by the manufacturer: XTT-labeling reagent and electron-coupling reagent were mixed in a ratio of 50:1 and 50 μL of this mixture were added to each well of the 96-well plate. The plates were incubated for about 3 h at 37 °C, 5% CO2 in humidified atmosphere and read out after incubation. Quantification of cell cytotoxicity was performed in an ELISA plate reader (Bio-Rad, München, Germany) at 490 nm with a reference wavelength of 655 nm. Absorbance values at both wavelengths were subtracted. The cytotoxic effect of the treatment was determined as percentage of viability compared to untreated cells.
Simple ligand binding module of Sigma plot software (version 10.0) was used for analysis.
RNA isolation
Total RNA of RAW 264.7 cells was extracted from the test samples using RNeasy® mini kit (Qiagen Inc., Valencia, CA, USA) according to the manufacture’s instructions to obtain highly pure RNA. Isolated total RNA was re-suspended in sample buffer provided by the manufacturer. The concentration and quality of total RNA was verified by electrophoresis using the total RNA Nano chip assay on an Agilent 2100 Bioanalyzer (Agilent Technologies GmbH, Berlin, Germany). Only samples with RNA index values greater than 8.5 were selected for expression profiling. RNA concentrations were determined using the NanoDrop spectrophotometer (NanoDrop Technologies, Wilmington, DE). All of the RNA samples were stored at −80 °C until used for microarray analysis.
Probe labeling and Illumina Sentrix BeadChip array hybridization
Biotin-labeled cRNA samples for hybridization on Illumina Mouse Sentrix-8 BeadChip arrays (Illumina Inc., San Diego, CA, USA) were prepared according to Illumina’s recommended sample labeling procedure based on a previously published protocol [42]. In brief, 250 ng total RNA were used for complementary DNA (cDNA) synthesis, followed by an amplification/labeling step (in vitro transcription) to synthesize biotin-labeled cRNA according to the MessageAmpII aRNA Amplification kit (Ambion, Inc., Austin, TX). Biotin-16-UTP was purchased from Roche Applied Science, Penzberg, Germany. The cRNA was column purified according to TotalPrep RNA Amplification Kit, and eluted in 60 μL of water. Quality of cRNA was controlled using the RNA Nano Chip Assay on an Agilent 2100 Bioanalyzer and spectrophotometrically quantified (NanoDrop).
Hybridization was performed at 58 °C, in GEX-HCB buffer (Illumina Inc.) at a concentration of 50 ng cRNA/μL, unsealed in a wet chamber for 20 h. Spike-in controls for low, medium and highly abundant RNAs were added, as well as mismatch control and biotinylation control oligonucleotides. Microarrays were washed twice in E1BC buffer (Illumina Inc.) at room temperature for 5 min. After blocking for 5 min in 4 mL of 1% (wt/vol) Blocker Casein in phosphate buffered saline Hammarsten grade (Pierce Biotechnology, Inc., Rockford, IL), array signals are developed by a 10 min incubation in 2 mL of 1 μg/mL Cy3-streptavidin (Amersham Biosciences, Buckinghamshire, UK) solution and 1% blocking solution. After a final wash in E1BC, the arrays are dried and scanned.
Scanning and data analysis
Microarray scanning was done using a Beadstation array scanner, setting adjusted to a scaling factor of 1 and PMT settings at 430. Data extraction was done for all beads individually, and outliers are removed when >2.5 MAD (median absolute deviation). All remaining data points are used for the calculation of the mean average signal for a given probe, and standard deviation for each probe was calculated.
Data analysis was done by normalization of the signals using the cubic spline algorithm after background subtraction, and differentially regulated genes are defined by calculating the standard deviation differences of a given probe in a one-by-one comparison of samples or groups. Pathway analysis was done by using the Ingenuity Pathways Analysis software (version 5.5) from Ingenuity Systems (Redwood City, CA, USA).
Real-time RT-PCR
The experiment was done on the Roche LC480 using ABgene Mastermix “CM 215-A” and Roche Universal Probe Library. Oligos were designed using Roche ProbeFinder Webservice (https://qpcr2.probefinder.com/organism.jsp) and were synthesized by MWG. Two versions were designed per gene. All analyzed variants span an intron to prevent cross reactions with possible genomic DNA contamination.
Total reaction volume was 10 μL. We used 400 nM final oligo concentration each, 100 nM final probe concentration and 6.3 ng RNA (transcribed in cDNA using Superscript) per reaction. We used transcribed cDNA from RNA obtained from untreated RAW 264.7 cells or cells treated with artesunate at the 50% inhibition dose (IC50). No DNAse digest was done.
Genes identified by microarray analyses were exemplarily analyzed for validation by means of real-time RT-PCR (ATOX1, NOS2, and AKAP9). The housekeeping genes, HPRT1, G6PD, ALAS1, and HMBS, served as reference. The primer sequences are shown in Table 1.
Table 1.
Primer sequences of genes analyzed by real-time RT-PCR
| EST | Oligo name | Sequence 5′ to 3′ |
|---|---|---|
| NM_009720.2 | mm_atox1_34_f | gcgagtccttccggatataa |
| NM_009720.2 | mm_atox1_34_r | tgagcagttggtgttccaga |
| NM_009720.2 | mm_atox1_26_f | gcgagtccttccggatataa |
| NM_009720.2 | mm_atox1_26_r | gtctgggcaggaactccat |
| NM_010927.1 | mm_nos2_13_f | ctttgccacggacgagac |
| NM_010927.1 | mm_nos2_13_r | tcattgtactctgagggctgac |
| NM_010927.1 | mm_nos2_11_f | agctgaacttgagcgaggag |
| NM_010927.1 | mm_nos2_11_r | tcatgataacgtttctggctctt |
| NM_194462.2 | mm_akap9_106_f | aatccagcctgtgagtgagc |
| NM_194462.2 | mm_akap9_106_r | ctgtctgttttctctttcaagtgatt |
| NM_194462.2 | mm_akap9_62_f | atcaccaaccacccgaag |
| NM_194462.2 | mm_akap9_62_r | ccgcaccaaaaatttcattc |
| NM_013556.2 | mm_hprt1_95_f | tcctcctcagaccgctttt |
| NM_013556.2 | mm_hprt1_95_r | cctggttcatcatcgctaatc |
| NM_013556.2 | mm_hprt1_22_f | tgatagatccattcctatgactgtaga |
| NM_013556.2 | mm_hprt1_22_r | aagacattctttccagttaaagttgag |
| NM_008062.2 | mm_g6pdx_78_f | gaaagcagagtgagcccttc |
| NM_008062.2 | mm_g6pdx_78_r | cataggaattacgggcaaaga |
| NM_008062.2 | mm_g6pdx_34_f | ccagcccatcccctatgtat |
| NM_008062.2 | mm_g6pdx_34_r | agcccactctcttcatcagc |
| NM_020559.1 | mm_alas1_40_f | ccctccagccaatgagaa |
| NM_020559.1 | mm_alas1_40_r | gtgccatctgggactcgt |
| NM_020559.1 | mm_alas1_52_f | ccatcaattacccaacagtgc |
| NM_020559.1 | mm_alas1_52_r | gtgaccagcagcttctcca |
| NM_013551.1 | mm_hmbs_79_f | tccctgaaggatgtgcctac |
| NM_013551.1 | mm_hmbs_79_r | aagggttttcccgtttgc |
| NM_013551.1 | mm_hmbs_49_f | gctcagatagcatgcaagagacta |
| NM_013551.1 | mm_hmbs_49_r | tctggaccatcttcttgctga |
All measurements are done in triplicates to calculate mean values and standard deviations. To calculate normalized mRNA expression values, we measured the sample’s crossing point (expressed as a cycle number), the efficiency of the reaction, and the number of cycles completed to determine how much the DNA concentration must have increased for each sample by the end of the amplification. The analysis uses these calculations to compare the samples and generate the ratios as indicated by the manufacturer (Roche, Penzberg, Germany). The final ratio resulting from the calibrator normalized relative quantification is a function of PCR efficiency and of the determined crossing points. The “concentration ratio” was determined as the ratio of the target and the reference genes in the specific sample. To calculate the change of expression between untreated (calibrator) and artesunate-treated samples the concentration ratios of the sample is divided by the concentration ratio of the calibrator. This value is the “normalized ratio”.
Results
iNOS inhibition
As a starting point, we measured the enzymatic activity of the inducible nitric oxide synthase (iNOS) by preforming Griess assay. RAW 264.7 cells were initially stimulated with 0.5 μg/mL lipopolysaccharide (LPS) and 50 U/mL interferon-γ (INF-γ) and then treated with artemisinin, five artemisinin derivatives, or two other endoperoxides (4 μg/mL; Fig. 1) or left untreated. From Table 2 it was inferred that artesunate revealed the highest inhibitory effects on iNOS. Therefore, all further analyses were performed with artesunate.
Table 2.
Inhibitory effect of artemisinin, five artemisinin derivatives, and two other endoperoxides on nitric oxide (NO) production in mouse RAW 264.7 macrophage cells at a concentration of 4 μg/mL
| Compound | Molecular weight | Inhibition (% of control) |
|---|---|---|
| Artemisinin | 282 | 62.2 (±7.2) |
| Derivative 1 (Artesunate) | 384 | 29.1 (±2.8) |
| Derivative 2 (DF31) | 266 | 65.5 (±3.6) |
| Derivative 3 (DF36) | 268 | 56.7 (±7.0) |
| Derivative 4 (DF37-2) | 284 | 92.9 (±5.1) |
| Derivative 5 (GHP-AJM-3/23) | 861 | 100.0 (±11.1) |
| Endoperoxide 1 (ME20050015) | 566 | 68.7 (±6.8) |
| Endoperoxide 2 (ME20050016) | 390 | 55.4 (±3.0) |
Values are expressed as % nitrite formation of control.
Cytotoxicity
RAW 264.7 cells were treated with different concentrations of artesunate and subjected to the XTT assay. The dose response curves are shown in Fig. 2. The IC50 value of artesunate was determined to be 3.1 (±0.7) μM (mean and SD of three independent experiments).
Fig. 2.
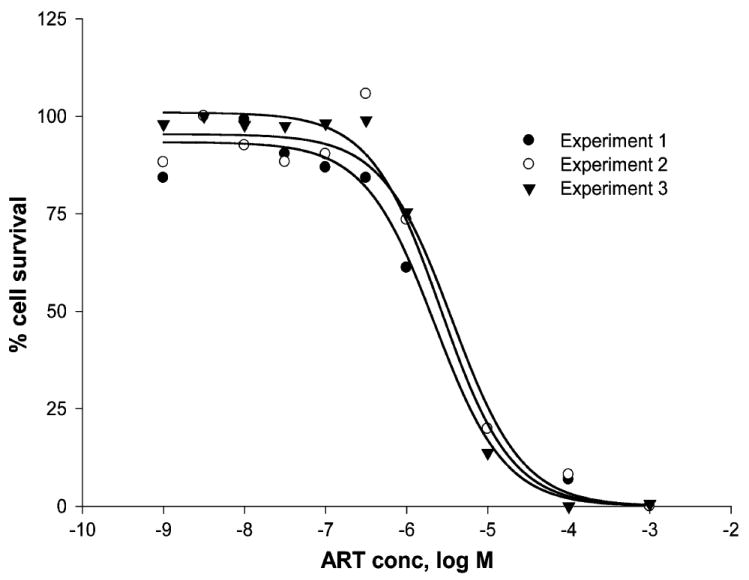
Cytotoxicity of artesunate towards RAW 264.7 cells as determined by the XTT assay. Dose response curves of three independent experiments are shown (mean values of each four measurements).
Quality control of microarray analysis
In order to ensure proper microarray hybridization, several quality control tests were performed. As shown in Fig. 3A, the signal change was close to linear with three concentrations (low, medium, and high) of target Cy3 hybridization target control oligo-nucleotides yielding a gradient hybridization response. The mismatch controls yield very low signals (mm2) in comparison to perfect matches (pm) implying that the hybridization and washing was adequately stringent (Fig. 3B). Both raw data background (non-related probes) (59 ± 4) and system noise were low (8 ± 1) implying that the imaging system background as well as any signal resulting from non-specific binding of dye or cross-hybridization were satisfactorily small (Fig. 3C). Finally, cluster analysis on samples of RAW 264.7 cells treated with artesunate at doses of 1 × IC50 or 10 × IC50 and untreated controls showed that the biological replicates were similar. As expected, there was only little difference between the 1 × IC50 and 10 × IC50 groups (Fig. 3D).
Fig. 3.

Quality control of microarray analyses. (A) Cy3-labelled hybridization control; (B) low stringency hybridization control; (C) negative control; (D) sample correlation. Microarray hybridizations were performed using Illumina Sentrix BeadChip arrays (see Material and methods).
Differential gene expression in artesunate-treated and untreated cells
The effect of artesunate treatment on gene expression was determined by microarray hybridization. First, we focused on genes related to NO signaling and metabolism. A total of 30 genes were differentially expressed after treatment with concentrations of either 1 × IC50 and 10 × IC50 of artesunate. Seven genes were up-regulated after a dose of 1 × IC50 and 9 genes after 10 × IC50 (Table 3). Of them, five genes were up-regulated upon treatment with both artesunate concentrations. At the other side, each 14 genes were down-regulated after treatment with both artesunate doses, which of 9 genes were jointly found in both groups (Table 4).
Table 3.
Genes up-regulated by ≥1.5-fold after treatment with artesunate compared to untreated RAW 264.7 cells
| Category and full gene product name | Symbol | Probe ID | Fold change in RNA level by treatment with
|
|
|---|---|---|---|---|
| 1 × IC50 | 10 × IC50 | |||
| Nitric oxide-ediated signaling | ||||
| Calcium/calmodulin-dependent protein kinase I | CAMK1 | 3390427 | 6.3 | 5.9 |
| Discs, large homolog 4 (Drosophila) | DLGH4 | 2640039 | 2.4 | |
| GTP cyclohydrolase 1 (dopa-responsive dystonia) | GCH1 | 6550358 | 1.5 | |
| Insulin II | INS2 | 610040 | 2.4 | 2.4 |
| Myeloperoxidase | MPO | 5690176 | 2.5 | |
| Metallothionein-like 5, testis-specific (tesmin) | MTL5 | 6940300 | 1.5 | |
| Nitric oxide synthase 1, neuronal | NOS1 | 5860129 | 2.1 | |
| Oxidation resistance 1 | OXR1 | 2370039 | 1.5 | 2.3 |
| Protein kinase, cAMP dependent regulatory, type I beta | PRKAR1b | 6130411 | 2.6 | 2.7 |
| Protein kinase C, alpha | PRKCA | 6400551 | 2.8 | 2.7 |
| Trophinin associated protein (tastin) | TROAP | 5420750 | 1.5 | |
| cAMP-mediated signaling | ||||
| Adenylate cyclase 7 | ADCY7 | 6290520 | 3 | |
| A kinase (PRKA) anchor protein 1 | AKAP1 | 2260019 | 2 | 1.5 |
| A kinase (PRKA) anchor protein 10 | AKAP10 | 5910577 | 3.8 | 7.1 |
| Calmodulin 2 | CALM2 | 6620463 | 2.1 | 2 |
| Calcium/calmodulin-dependent protein kinase I | CAMK1 | 5220086 | 1.5 | |
| Calcium/calmodulin-dependent protein kinase I | CAMK1 | 3390427 | 6.3 | 5.9 |
| Calcium/calmodulin-dependent protein kinase ID | CAMK1d | 1660100 | 1.6 | |
| Dual specificity phosphatase 4 | DUSP4 | 2850593 | 5.1 | 2.6 |
| Guanine nucleotide binding protein, alpha stimulating complex locus | GNAS | 630441 | 1.6 | 2 |
| Phosphodiesterase 1A, calmodulin-dependent | PDE1a | 1050458 | 2.1 | 2 |
| Phosphodiesterase 1A, calmodulin-dependent | PDE1a | 2570563 | 2.6 | 2.1 |
| Rap guanine nucleotide exchange factor (GEF) 3 | RAPGEF3 | 5050592 | 2 | |
| Regulator of G-protein signaling 12 | RGS12 | 5390369 | 1.8 | |
| Wnt-mediated signaling | ||||
| Thymoma viral proto-oncogene 3 | AKT3 | 1580270 | 1.6 | 1.7 |
| Adenomatosis polyposis coli | APC | 3850484 | 3.4 | 1.9 |
| Cadherin 3 | CDH3 | 5390112 | 1.7 | |
| Casein kinase 1, gamma 1 | CSNK1G1 | 3940647 | 1.5 | |
| Dishevelled 2, dsh homolog (Drosophila) | DVL2 | 6110162 | 3.8 | |
| Integrin linked kinase | ILK | 870601 | 3.7 | 5.1 |
| Low density lipoprotein receptor-related protein 5 | LRP5 | 3170484 | 1.8 | 1.6 |
| Protein phosphatase 2, regulatory subunit B (B56), delta isoform | PPP2R5D | 5550112 | 1.5 | |
| Protein phosphatase 2, regulatory subunit B (B56), delta isoform | PPP2R5D | 380408 | 2 | |
| Transforming growth factor, beta receptor II, transcript variant 1 | TGFBR2 | 6550398 | 6.1 | |
| Wingless related MMTV integration site 8b | WNT8b | 4560301 | 2.4 | |
Table 4.
Genes down-regulated by ≥1.5-fold after treatment with artesunate compared to untreated RAW 264.7 cells
| Category and full gene product name | Symbol | Probe ID | Fold change in RNA level by treatment with
|
|
|---|---|---|---|---|
| 1 × IC50 | 10 × IC50 | |||
| Nitric oxide-mediated signaling | ||||
| Apolipoprotein E | APOE | 4200671 | −2.1 | |
| Antioxidant protein 1 homolog 1 (yeast) | ATOX1 | 1090497 | −1.6 | −1.7 |
| Catalase | CAT | 4280152 | −2.3 | −2 |
| Cyclin-dependent kinase inhibitor 1A (P21) | CDKN1A | 6400706 | −1.7 | |
| Dimethylarginine dimethylaminohydrolase 2 | DDAH2 | 4480551 | −4.3 | |
| Dual oxidase 1 | DUOX1 | 4480047 | −2.8 | |
| Epidermal growth factor receptor, transcript variant 1 | EGFR | 6480521 | −1.8 | |
| Galactosidase, alpha | GLA | 4610364 | −2.2 | |
| Glutathione peroxidase 2 | GPX2 | 6940619 | −4.9 | −4.9 |
| Glutathione peroxidase 3 | GPX3 | 1340450 | −2.1 | |
| Interleukin 10 | IL10 | 2340685 | −3.2 | |
| Interleukin 8 receptor, alpha | IL8ra | 1580100 | −3.2 | −3.2 |
| Neutrophil cytosolic factor 2 | NCF2 | 540129 | −2.3 | |
| Expressed in non-metastatic cells 5 | NME5 | 6770672 | −2.2 | |
| Nitric oxide synthase 3, endothelial cell | NOS3 | 670465 | −2.8 | −3.9 |
| Nitric oxide synthase 3, endothelial cell | NOS3 | 630152 | −2.2 | −2 |
| Oxidation resistance 1 | OXR1 | 3190706 | −6.7 | −6.7 |
| Peroxiredoxin 2 | PRDX2 | 5340577 | −3.6 | −3.6 |
| Selenoprotein P, plasma, 1 | SEPP1 | 450273 | −1.6 | −1.5 |
| cAMP-mediated mediated signaling | ||||
| A kinase (PRKA) anchor protein (yotiao) 9 | AKAP9 | 4280048 | −2 | −2.6 |
| Calcium/calmodulin-dependent protein kinase I gamma | CAMK1G | 6550315 | −1.8 | −3.7 |
| Calcium/calmodulin-dependent protein kinase II alpha | CAMK2A | 1940112 | −2 | |
| Guanine nucleotide binding protein, alpha o | GNAO | 6590487 | −1.9 | |
| Histamine receptor H 2 | HRH2 | 3840440 | −3 | |
| Phosphodiesterase 4A, cAMP specific | PDE4A | 1340129 | −1.5 | |
| Phosphodiesterase 4D, cAMP specific | PDE4D | 2470528 | −1.8 | −3 |
| Wnt-mediated signaling | ||||
| RIKEN cDNA 6330548O06 gene | 6330548O06RIK | 60279 | −3.2 | −3.2 |
| Expressed sequence AI414495 | AI414495 | 110102 | −5.3 | −5.3 |
| Casein kinase II, alpha 1 polypeptide | CSNK2A1 | 1580577 | −1.5 | |
| Dickkopf homolog 3 (Xenopus laevis) | DKK3 | 6450072 | −1.5 | |
| Guanine nucleotide binding protein, alpha o | GNAO | 6590487 | −1.9 | |
| SRY-box containing gene 2 | SOX2 | 2230491 | −1.5 | |
| SRY-box containing gene 5 | SOX5 | 2900167 | −1.6 | −1.6 |
| SRY-box containing gene 5 | SOX5 | 3190128 | −4.4 | |
| SRY-box containing gene 6 | SOX6 | 2940458 | −1.5 | |
| SRY-box containing gene 6 | SOX6 | 4070601 | −1.5 | −1.5 |
| Ubiquitin D | UBD | 5570632 | −2.3 | |
| Wingless-related MMTV integration site 5A | WNT5A | 840685 | −2.5 | −2.5 |
In order to see whether artesunate elicits its activity through one or several pathways, we investigated which other genes and signaling pathways might also be affected by the action of artesunate in RAW 264.7 cells. For this reason, we analyzed all genes included in the Illumina chip by means of the Ingenuity Pathway Analysis software. Out of 32 functional groups of genes, 24 were significantly regulated upon artesunate treatment (p < 0.05). The 10 functional groups of genes with the lowest p-values are shown in Fig. 4A. Of them, genes involved in cell-to-cell signaling and interaction were the most prominent. Based on this result, we then asked which genes involved in signaling pathways were affected upon artesunate treatment. Among the 34 signaling pathways analyzed by Ingenuity Pathway Analysis software, two were significantly regulated by artesunate, namely the cAMP and Wnt/β-catenin pathways (p < 0.05; Fig. 4B). Inspection of the microarray-based gene expression data revealed the genes up- or down-regulated after artesunate treatment. The genes associated with cAMP- or Wnt/β-catenin signaling and differentially regulated upon artesunate treatment are shown in Tables 3 and 4.
Fig. 4.
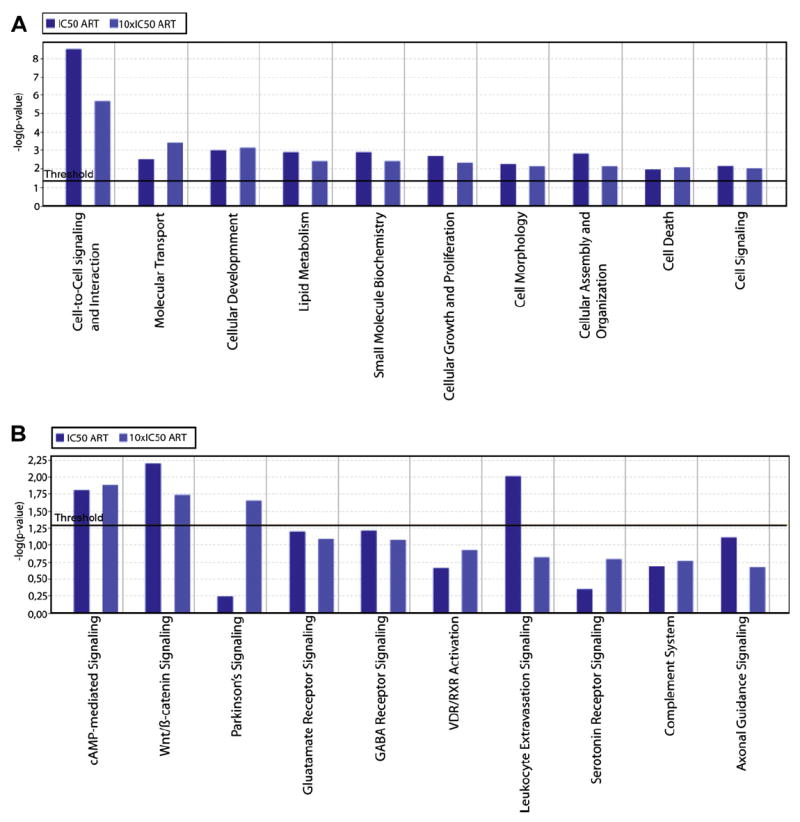
Identification of (A) functional groups of genes and (B) signaling pathways regulated upon artesunate treatment in RAW 264.7 cells. Gene expression of cells treated with 1 × IC50 or 10 × IC50 of artesunate was compared to gene expression in untreated cells. The evaluation of differentially expressed genes was performed using the Ingenuity Pathway Analysis software, version 5.5 (see Material and methods).
Validation of microarray data by real-time RT-PCR
The results of DNA microarray hybridization were exemplarily validated by real-time RT-PCR. One gene from NO-related signaling (ATOX1) and one gene from cAMP-mediated signaling (AKAP9) were chosen. As can be seen in Table 5, RT-PCR indicated a down-regulation of these genes in artesunate-treated cells compared to untreated cells. This is in accordance to the data obtained by microarray.
Table 5.
Validation of mRNA microarray results
| ATOX1 | AKAP9 | |
|---|---|---|
| Microarray hybridization | ||
| Untreated cells | 1937 (± 75.7)* | 94.2 (± 4.6) |
| Treated cells (1 × IC50) | 1186.7 (± 64.8) | 47.8 (± 3.1) |
| Fold change | −1.63 | −2.00 |
| Real-time RT-PCR | ||
| Untreated cells | 3.23 (± 0.15)** | 0.05 (± 0.004) |
| Treated cells (1 × IC50) | 2.38 (± 0.12) | 0.03 (± 0.003) |
| Fold change | −1.36 | −1.67 |
Genes were selected for real-time RT-PCR analysis from the list of differentially expressed genes.
average hybridization signal (±SEM).
Conc ratio (± Conc ratio STD).
Discussion
In the current investigation, we found that the cytotoxicity of artesunate is associated with inhibition of iNOS. These data are in accord with those of Severina et al. [43], who reported that the inhibition of guanylyl cyclase activation by NO donors represents a possible mechanism of the anti-malarial action of artemisinin. Furthermore, artemisinin inhibits the activation of the transcription factor NF-κB and, thereby, nitric oxide synthesis in cytokine-stimulated human astrocytoma T67 cells [44]. Since NF-κB is involved in the pathogenesis of cerebral malaria, the authors suggested that artemisinin, in addition to its anti-parasitic properties, could also exert a therapeutic effect on neurological complications of malaria.
The fact that artesunate inhibits iNOS-driven NO production and is cytotoxic indicates that NO may contribute to the cytotoxic action of this compound. To prove this in more detail and to see whether NO-related signaling routes are affected by artesunate, we performed microarray analyses. Indeed, we found that a number of genes involved in NO signaling and metabolism were significantly up- or down-regulated by artesunate. This clearly indicates that artesunate not only inhibits iNOS, but also affects other NO-related pathway genes. A relationship between NO and cytotoxicity is not unique for artesunate and has previously been reported for established anti-cancer drugs. NO improves the efficacy of cytostatic drugs towards tumors and overcomes drug resistance [45-49]. As molecular mechanism for this observation, Matthews et al. [50] proposed the effects of NO on tumor hypoxia. Hypoxia in tumors is associated with malignant progression, metastatic spread, and increased resistance to radio- and chemotherapy. Molecular oxygen is required for cellular production of NO by iNOS, and NO may inhibit adaptive responses of tumors to hypoxia. The authors found that NO mediates chemosensitivity in hypoxic tumor cells and that drug resistance was due to a suppression of NO production in those cells.
In addition, NO reduces toxicity of anti-cancer drugs towards normal tissues [51-54]. Whether artesunate also reveals increased tumor killing at reduced side effects mediated by NO is still unknown and merits further investigations. From malaria therapy, it is well-known that artesunate reveals very few adverse effects [55].
Pathway profiling analysis showed that most of the NO-related genes affected by artesunate were not directly linked to each other in the NO signaling route. This may be taken as a hint that other factors might also contribute to the cytotoxic action of artesunate. Indeed, the Wnt/β-catenin signaling pathway was found to be regulated by artesunate in our microarray analysis. This is an intriguing result, since this pathway plays an important role in colon cancer [56], and colon cancer cell lines were most sensitive towards artesunate among all solid tumor types tested previously by us [24]. This observation fits to the results of Li et al. [57] that artesunate attenuates the growth of human colorectal carcinoma by inhibition of the Wnt/β-catenin pathway. These results and the data of the present investigation show the importance of Wnt/β-catenin signaling for the response of tumor cells to artesunate.
Furthermore, our microarray analysis pointed to cAMP-mediated signaling as a potential mechanism for artesunate’s action. A relationship between NO and anti-cancer drugs and cAMP has been scarcely analyzed as of yet [58]. A role of artesunate in this context has to be further investigated in the future.
Acknowledgments
This study was funded by the Dietmar Hopp Stiftung with a grant to V.B.K.
References
- 1.Anggard E. Nitric oxide: mediator, murderer, and medicine. Lancet. 1994;343:1199–1206. doi: 10.1016/s0140-6736(94)92405-8. [DOI] [PubMed] [Google Scholar]
- 2.Lechner M, Lirk P, Rieder J. Inducible nitric oxide synthase (iNOS) in tumor biology: the two sides of the same coin. Semin Cancer Biol. 2005;15:277–289. doi: 10.1016/j.semcancer.2005.04.004. [DOI] [PubMed] [Google Scholar]
- 3.Sawa T, Ohshima H. Nitrative DNA damage in inflammation and its possible role in carcinogenesis. Nitric Oxide. 2006;14:91–100. doi: 10.1016/j.niox.2005.06.005. [DOI] [PubMed] [Google Scholar]
- 4.Murakami A, Ohigashi H. Targeting NOX, INOS and COX-2 in inflammatory cells: chemoprevention using food phytochemicals. Int J Cancer. 2007;121:2357–2363. doi: 10.1002/ijc.23161. [DOI] [PubMed] [Google Scholar]
- 5.Perwez Hussain S, Harris CC. Inflammation and cancer: an ancient link with novel potentials. Int J Cancer. 2007;121:2373–2380. doi: 10.1002/ijc.23173. [DOI] [PubMed] [Google Scholar]
- 6.Wink DA, Kasprzak KS, Maragos CM, Elespuru RK, Misra M, Dunams TM, Cebula TA, Koch WH, Andrews AW, Allen JS, et al. DNA deaminating ability and genotoxicity of nitric oxide and its progenitors. Science. 1991;254:1001–1003. doi: 10.1126/science.1948068. [DOI] [PubMed] [Google Scholar]
- 7.Schmutte C, Rideout WM, 3rd, Shen JC, Jones PA. Mutagenicity of nitric oxide is not caused by deamination of cytosine or 5-methylcytosine in double-stranded DNA. Carcinogenesis. 1994;15:2899–2903. doi: 10.1093/carcin/15.12.2899. [DOI] [PubMed] [Google Scholar]
- 8.Felley-Bosco E. Role of nitric oxide in genotoxicity: implication for carcinogenesis. Cancer Metastasis Rev. 1998;17:25–37. doi: 10.1023/a:1005948420548. [DOI] [PubMed] [Google Scholar]
- 9.Li CQ, Trudel LJ, Wogan GN. Nitric oxide-induced genotoxicity, mitochondrial damage, and apoptosis in human lymphoblastoid cells expressing wild-type and mutant p53. Proc Natl Acad Sci USA. 2002;99:10364–10369. doi: 10.1073/pnas.162356399. [DOI] [PMC free article] [PubMed] [Google Scholar]
- 10.Ridnour LA, Thomas DD, Donzelli S, Espey MG, Roberts DD, Wink DA, Isenberg JS. The biphasic nature of nitric oxide responses in tumor biology. Antioxid Redox Signal. 2006;8:1329–1337. doi: 10.1089/ars.2006.8.1329. [DOI] [PubMed] [Google Scholar]
- 11.Bentz BG, Haines GK, 3rd, Lingen MW, Pelzer HJ, Hanson DG, Radosevich JA. Nitric oxide synthase type 3 is increased in squamous hyperplasia, dysplasia, and squamous cell carcinoma of the head and neck, Ann. Otol Rhinol Laryngol. 1999;108:781–787. doi: 10.1177/000348949910800812. [DOI] [PubMed] [Google Scholar]
- 12.Tanaka H, Kijima H, Tokunaga T, Tajima T, Himeno S, Kenmochi T, Oshiba G, Kise Y, Nishi T, Chino O, Shimada H, Machimura T, Tanaka M, Makuuchi H. Frequent expression of inducible nitric oxide synthase in esophageal squamous cell carcinomas. Int J Oncol. 1999;14:1069–1073. doi: 10.3892/ijo.14.6.1069. [DOI] [PubMed] [Google Scholar]
- 13.Jang TJ, Kim DK. Inducible nitric oxide synthase expression of tumor and stromal cells is associated with the progression of 7,12-dimethylbenz[a]anthracene-induced rat mammary tumors. Cancer Lett. 2002;182:121–126. doi: 10.1016/s0304-3835(02)00091-5. [DOI] [PubMed] [Google Scholar]
- 14.Franco L, Doria D, Bertazzoni E, Benini A, Bassi C. Increased expression of inducible nitric oxide synthase and cyclooxygenase-2 in pancreatic cancer. Prostaglandins Other Lipid Mediat. 2004;73:51–58. doi: 10.1016/j.prostaglandins.2003.12.001. [DOI] [PubMed] [Google Scholar]
- 15.Speranza L, De Lutiis MA, Shaik YB, Felaco M, Patruno A, Tetè A, Mastrangelo F, Madhappan B, Castellani ML, Conti F, Vecchiet J, Theoharides TC, Conti P, Grilli A. Localization and activity of iNOS in normal human lung tissue and lung cancer tissue. Int J Biol Markers. 2007;22:226–231. doi: 10.1177/172460080702200311. [DOI] [PubMed] [Google Scholar]
- 16.Chen HH, Su WC, Chou CY, Guo HR, Ho SY, Que J, Lee WY. Increased expression of nitric oxide synthase and cyclooxygenase-2 is associated with poor survival in cervical cancer treated with radiotherapy. Int J Radiat Oncol Biol Phys. 2005;63:1093–1100. doi: 10.1016/j.ijrobp.2005.03.062. [DOI] [PubMed] [Google Scholar]
- 17.Li LG, Xu HN. Inducible nitric oxide synthase, nitrotyrosine and apoptosis in gastric adenocarcinomas and their correlation with a poor survival. World J Gastroenterol. 2005;11:2539–2544. doi: 10.3748/wjg.v11.i17.2539. [DOI] [PMC free article] [PubMed] [Google Scholar]
- 18.Wang L, Shi GG, Yao JC, Gong W, Wei D, Wu TT, Ajani JA, Huang S, Xie K. Expression of endothelial nitric oxide synthase correlates with the angiogenic phenotype of and predicts poor prognosis in human gastric cancer. Gastric Cancer. 2005;8:18–28. doi: 10.1007/s10120-004-0310-7. [DOI] [PubMed] [Google Scholar]
- 19.Ekmekcioglu S, Ellerhorst JA, Prieto VG, Johnson MM, Broemeling LD, Grimm EA. Tumor iNOS predicts poor survival for stage III melanoma patients. Int J Cancer. 2006;119:861–866. doi: 10.1002/ijc.21767. [DOI] [PubMed] [Google Scholar]
- 20.Badn W, Hegardt P, Fellert MA, Darabi A, Esbjörnsson M, Smith KE, Janelidze S, Salford LG, Visse E, Siesjö P. Inhibition of inducible nitric oxide synthase enhances anti-tumour immune responses in rats immunized with IFN-gamma-secreting glioma cells. Scand J Immunol. 2007;65:289–297. doi: 10.1111/j.1365-3083.2007.01901.x. [DOI] [PubMed] [Google Scholar]
- 21.Frederiksen LJ, Sullivan R, Maxwell LR, Macdonald-Goodfellow SK, Adams MA, Bennett BM, Siemens DR, Graham CH. Chemosensitization of cancer in vitro and in vivo by nitric oxide signalling. Clin Cancer Res. 2007;13:2199–2206. doi: 10.1158/1078-0432.CCR-06-1807. [DOI] [PubMed] [Google Scholar]
- 22.Hirst DG, Robson T. Nitrosative stress in cancer therapy. Front Biosci. 2007;12:3406–3418. doi: 10.2741/2322. [DOI] [PubMed] [Google Scholar]
- 23.Efferth T, Rücker G, Falkenberg M, Manns D, Olbrich A, Fabry U, Osieka R. Detection of apoptosis in KG-1a leukemic cells treated with investigational drugs. Arzneimittelforschung. 1996;46:196–200. [PubMed] [Google Scholar]
- 24.Efferth T, Dunstan H, Sauerbrey A, Miyachi H, Chitambar CR. The anti-malarial artesunate is also active against cancer. Int J Oncol. 2001;18:767–773. doi: 10.3892/ijo.18.4.767. [DOI] [PubMed] [Google Scholar]
- 25.Efferth T. Mechanistic perspectives for 1,2,4-trioxanes in anti-cancer therapy. Drug Resist Updat. 2005;8:85–97. doi: 10.1016/j.drup.2005.04.003. [DOI] [PubMed] [Google Scholar]
- 26.Efferth T. Molecular pharmacology and pharmacogenomics of artemisinin and its derivatives in cancer cells. Curr Drug Targets. 2006;7:407–421. doi: 10.2174/138945006776359412. [DOI] [PubMed] [Google Scholar]
- 27.Efferth T. Willmar Schwabe Award 2006: antiplasmodial and antitumor activity of artemisinin–from bench to bedside. Planta Med. 2007;73:299–309. doi: 10.1055/s-2007-967138. [DOI] [PubMed] [Google Scholar]
- 28.Efferth T, Benakis A, Romero MR, Tomicic M, Rauh R, Steinbach D, Häfer R, Stamminger T, Oesch F, Kaina B, Marschall M. Enhancement of cytotoxicity of artemisinins toward cancer cells by ferrous iron. Free Radic Biol Med. 2004;37:998–1009. doi: 10.1016/j.freeradbiomed.2004.06.023. [DOI] [PubMed] [Google Scholar]
- 29.Lai H, Sasaki T, Singh NNP. Targeted treatment of cancer with artemisinin and artemisinin-tagged iron-carrying compounds. ExpertOpin Ther Targets. 2005;9:995–1007. doi: 10.1517/14728222.9.5.995. [DOI] [PubMed] [Google Scholar]
- 30.Kelter G, Steinbach D, Konkimalla VB, Tahara T, Taketani S, Fiebig HH, Efferth T. Role of transferrin receptor and the ABC transporters ABCB6 and ABCB7 for resistance and differentiation of tumor cells towards artesunate. PLoS ONE. 2007;2:e798. doi: 10.1371/journal.pone.0000798. [DOI] [PMC free article] [PubMed] [Google Scholar]
- 31.Efferth T, Olbrich A, Bauer R. mRNA expression profiles for the response of human tumor cell lines to the antimalarial drugs artesunate, arteether, and artemether. Biochem Pharmacol. 2002;64:617–623. doi: 10.1016/s0006-2952(02)01221-2. [DOI] [PubMed] [Google Scholar]
- 32.Efferth T, Sauerbrey A, Olbrich A, Gebhart E, Rauch P, Weber HO, Hengstler JG, Halatsch ME, Volm M, Tew KD, Ross DD, Funk JO. Molecular modes of action of artesunate in tumor cell lines. Mol Pharmacol. 2003;64:382–394. doi: 10.1124/mol.64.2.382. [DOI] [PubMed] [Google Scholar]
- 33.Anfosso L, Efferth T, Albini A, Pfeffer U. Microarray expression profiles of angiogenesis-related genes predict tumor cell response to artemisinins. Pharmacogenomics J. 2006;6:269–278. doi: 10.1038/sj.tpj.6500371. [DOI] [PubMed] [Google Scholar]
- 34.Efferth T, Briehl MM, Tome ME. Role of antioxidant genes for the activity of artesunate against tumor cells. Int J Oncol. 2003;23:1231–1235. [PubMed] [Google Scholar]
- 35.Efferth T, Oesch F. Oxidative stress response of tumor cells: microarray-based comparison between artemisinins and anthracyclines. Biochem Pharmacol. 2004;68:3–10. doi: 10.1016/j.bcp.2004.03.003. [DOI] [PubMed] [Google Scholar]
- 36.Efferth T, Davey M, Olbrich A, Rücker G, Gebhart E, Davey R. Activity of drugs from traditional Chinese medicine toward sensitive and MDR1- or MRP1-overexpressing multidrug-resistant human CCRF-CEM leukemia cells. Blood Cells Mol Dis. 2002;28:160–168. doi: 10.1006/bcmd.2002.0492. [DOI] [PubMed] [Google Scholar]
- 37.Dell’Eva R, Pfeffer U, Vené R, Anfosso L, Forlani A, Albini A, Efferth T. Inhibition of angiogenesis in vivo and growth of Kaposi’s sarcoma xenograft tumors by the antimalarial artesunate. Biochem Pharmacol. 2004;68:2359–2366. doi: 10.1016/j.bcp.2004.08.021. [DOI] [PubMed] [Google Scholar]
- 38.Berger TG, Dieckmann D, Efferth T, Schultz ES, Funk JO, Baur A, Schuler G. Artesunate in the treatment of metastatic uveal melanoma–first experiences. Oncol Rep. 2005;14:1599–1603. [PubMed] [Google Scholar]
- 39.Alagbala AA, McRiner AJ, Bortsnik K, Labonte T, Chang W, D’Angelo J, Posner GH, Foster BA. Biological mechanisms of action of novel C-10 non-acetal trioxane dimers in prostate cancer cell lines. J Med Chem. 2006;49:7836–7842. doi: 10.1021/jm060803i. [DOI] [PMC free article] [PubMed] [Google Scholar]
- 40.Baer HP, Schmidt K, Mayer B, Kukovetz WR. Pentamidine does not interfere with nitrite formation in activated RAW 264.7 macrophages but inhibits constitutive brain nitric oxide synthase. Life Sci. 1995;57:1973–1980. doi: 10.1016/0024-3205(95)02183-j. [DOI] [PubMed] [Google Scholar]
- 41.Scudiero DA, Shoemaker RH, Paull KD, Monks A, Tierney S, Nofziger TH, Currens MJ, Seniff D, Boyd MR. Evaluation of a soluble tetrazolium/formazan assay for cell growth and drug sensitivity using human and other tumor cell lines. Cancer Res. 1988;48:4827–4833. [PubMed] [Google Scholar]
- 42.Eberwine J, Yeh H, Miyashiro K, Cao Y, Nair S, Finnell R, Zettel M, Coleman P. Analysis of gene expression in single live neurons. Proc Natl Acad Sci USA. 1992;89:3010–3014. doi: 10.1073/pnas.89.7.3010. [DOI] [PMC free article] [PubMed] [Google Scholar]
- 43.Severina IS, Pyatakova NV, Bussygina OG, Mikhailitsyn FS, Khropov YV. Inhibition of nitric oxide-dependent activation of soluble guanylyl cyclase by the antimalarial drug, artemisinin. Eur J Pharmacol. 2002;438:69–73. doi: 10.1016/s0014-2999(02)01266-9. [DOI] [PubMed] [Google Scholar]
- 44.Aldieri E, Atragene D, Bergandi L, Riganti C, Costamagna C, Bosia A, Ghigo D. Artemisinin inhibits inducible nitric oxide synthase and nuclear factor NF-κB activation. FEBS Lett. 2003;552:141–144. doi: 10.1016/s0014-5793(03)00905-0. [DOI] [PubMed] [Google Scholar]
- 45.Azizzadeh B, Yip HT, Blackwell KE, Horvath S, Calcaterra TC, Buga GM, Ignarro LJ, Wang MB. Nitric oxide improves cisplatin cytotoxicity in head and neck squamous cell carcinoma. Laryngoscope. 2001;111:1896–1900. doi: 10.1097/00005537-200111000-00004. [DOI] [PubMed] [Google Scholar]
- 46.Konovalova NP, Goncharova SA, Volkova LM, Rajewskaya TA, Eremenko LT, Korolev AM. Nitric oxide donor increases the efficiency of cytostatic therapy and retards the development of drug resistance. Nitric Oxide. 2003;8:59–64. doi: 10.1016/s1089-8603(02)00142-8. [DOI] [PubMed] [Google Scholar]
- 47.Riganti C, Miraglia E, Viarisio D, Costamagna C, Pescarmona G, Ghigo D, Bosia A. Nitric oxide reverts the resistance to doxorubicin in human colon cancer cells by inhibiting the drug efflux. Cancer Res. 2005;65:516–525. [PubMed] [Google Scholar]
- 48.Bratasz A, Weir NM, Parinandi NL, Zweier JL, Sridhar R, Ignarro LJ, Kuppusamy P. Reversal to cisplatin sensitivity in recurrent human ovarian cancer cells by NCX-4016, a nitro derivative of aspirin. Proc Natl Acad Sci USA. 2006;103:3914–3919. doi: 10.1073/pnas.0511250103. [DOI] [PMC free article] [PubMed] [Google Scholar]
- 49.Chanvorachote P, Nimmannit U, Stehlik C, Wang L, Jiang BH, Ongpipatanakul B, Rojanasakul Y. Nitric oxide regulates cell sensitivity to cisplatin-induced apoptosis through S-nitrosylation and inhibition of Bcl-2 ubiquitination. Cancer Res. 2006;66:6353–6360. doi: 10.1158/0008-5472.CAN-05-4533. [DOI] [PubMed] [Google Scholar]
- 50.Matthews NE, Adams MA, Maxwell LR, Gofton TE, Graham CH. Nitric oxide-mediated regulation of chemosensitivity in cancer cells. J Natl Cancer Inst. 2001;93:1879–1885. doi: 10.1093/jnci/93.24.1879. [DOI] [PubMed] [Google Scholar]
- 51.Wang Y, Aggarwal SK. Effects of cisplatin and taxol on inducible nitric oxide synthase, gastrin and somatostatin in gastrointestinal toxicity. Anticancer Drugs. 1997;8:853–858. doi: 10.1097/00001813-199710000-00006. [DOI] [PubMed] [Google Scholar]
- 52.Xu W, Liu L, Smith GC, Charles G. Nitric oxide upregulates expression of DNA-PKcs to protect cells from DNA-damaging anti-tumour agents. Nat Cell Biol. 2000;2:339–345. doi: 10.1038/35014028. [DOI] [PubMed] [Google Scholar]
- 53.Saleh S, El-Demerdash E. Protective effects of l-arginine against cisplatin-induced renal oxidative stress and toxicity: role of nitric oxide. Basic Clin Pharmacol Toxicol. 2005;97:91–97. doi: 10.1111/j.1742-7843.2005.pto_114.x. [DOI] [PubMed] [Google Scholar]
- 54.Chirino YI, Trujillo J, Sánchez-González DJ, Martínez-Martínez CM, Cruz C, Bobadilla NA, Pedraza-Chaverri J. Selective iNOS inhibition reduces renal damage induced by cisplatin. Toxicol Lett. 2008;176:48–57. doi: 10.1016/j.toxlet.2007.10.006. [DOI] [PubMed] [Google Scholar]
- 55.Ribeiro IR, Olliaro P. Safety of artemisinin and its derivatives. A review of published and unpublished clinical trials. Med Trop (Mars) 1998;58(Suppl 3):50–53. [PubMed] [Google Scholar]
- 56.Segditsas S, Tomlinson I. Colorectal cancer and genetic alterations in the Wnt pathway. Oncogene. 2006;25:7531–7537. doi: 10.1038/sj.onc.1210059. [DOI] [PubMed] [Google Scholar]
- 57.Li LN, Zhang HD, Yuan SJ, Tian ZY, Wang L, Sun ZX. Artesunate attenuates the growth of human colorectal carcinoma and inhibits hyperactive Wnt/beta-catenin pathway. Int J Cancer. 2007;121:1360–1365. doi: 10.1002/ijc.22804. [DOI] [PubMed] [Google Scholar]
- 58.von Knethen A, Brüne B. Attenuation of macrophage apoptosis by the cAMP-signalling system. Mol Cell Biochem. 2000;212:35–43. [PubMed] [Google Scholar]