Abstract
Combined positron emission tomography–computed tomography (PET-CT) has made a significant impact on cancer imaging. The use of CT to map tissue attenuation for correction of PET images and the ability to co-register the functional information provided by PET with the anatomical data afforded by CT, has resulted in demonstrable improvements in diagnostic accuracy. However, attenuation correction and anatomical localisation may not represent the full benefits of integrating CT with PET. The use of CT acquisition techniques for patient positioning and the use of contrast media can improve diagnostic performance, and incorporation of CT image processing techniques such as perfusion CT, 3D imaging and computer-assisted diagnosis offers new applications. The interpretation of PET-CT images can be improved by fully integrating the morphological appearances on CT into image analysis. Better utilisation of the CT component of PET-CT could further enhance the benefits of PET-CT in oncology but will have implications for manufacturers and purchasers of PET-CT equipment and analysis software. Furthermore, specialists working in PET-CT will need CT competencies beyond knowledge of cross-sectional anatomy. CT continues to exhibit rapid evolution and these advances will inevitably impact on the practice of PET-CT.
Keywords: Positron emission tomography, computed tomography, contrast media, diagnosis, computer-assisted, imaging, three-dimensional
Introduction
In the relatively short time since its introduction into clinical practice, combined positron emission tomography–computed tomography (PET-CT) has made a significant impact on cancer imaging. The use of CT rather than external radioactive sources, to provide a map of tissue attenuation for correction of PET images has shortened the time of examination and increased patient throughput. Furthermore, the ability to accurately co-register the functional information provided by PET with the anatomical data afforded by CT has resulted in demonstrable improvements in diagnostic accuracy over PET, interpreted either alone or with visual comparison to CT[1]. However, attenuation correction and anatomical localisation may not represent the full benefits of integrating CT with PET. Current CT practice is based upon a substantial knowledge-base relating to image acquisition, processing and interpretation which can be further integrated into PET-CT. Furthermore, as CT technology continues to evolve, new opportunities for CT to contribute additional benefits to PET-CT arise. This article illustrates how better utilisation of the CT component could further enhance the benefits of PET-CT in oncology.
Image acquisition
Patient positioning
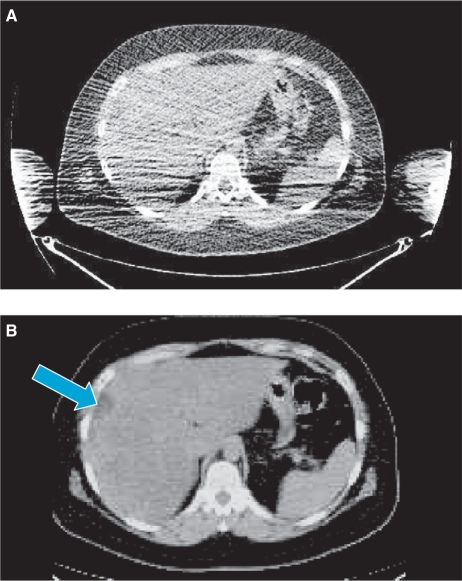
Some aspects of image acquisition commonly used to obtain optimal CT data during conventional CT cannot be transferred to PET-CT without causing image artefacts. Most notably, suspending the patient's respiration in full inspiration or expiration is not appropriate for PET-CT as this will result in mis-registration errors due to differences in diaphragmatic position compared to PET. Suspension of breathing is not possible for PET imaging due to the longer time required for image acquisition. However, other elements of CT technique can be transferred to PET-CT to enhance the quality of the CT component. Previously, whole-body images acquired using dedicated PET were often obtained with the patient's arms down alongside the torso. However, to optimise the quality of CT images during PET-CT, it is important to have the patient's arms raised to avoid beam-hardening artefacts which can significantly obscure anatomical detail (Fig. 1). Arm-down artefacts were reported to account for 17 of 194 discrepancies in a study comparing PET-CT to corresponding diagnostic CT examinations performed within 2 weeks[2].
Figure 1.
Comparison of CT images obtained during PET-CT with arms down (A) and arms raised (B). With arms down, the focal liver lesion (arrow) is obscured by beam hardening artefact.
Use of contrast media
Administration of oral or intravenous contrast media is known to produce important benefits for conventional CT and their use has become routine for many indications. Compared to non-enhanced CT, contrast media can improve the delineation of anatomical features, increase the sensitivity for detection of pathological lesions and contribute to lesion characterisation. The possibility of transferring these benefits to PET-CT has created concerns about possible artefacts resulting from errors in CT attenuation correction. Such artefacts appear as an apparent increase in fluorodeoxyglucose (FDG) uptake in areas where contrast material is present in high concentration.
In the case of oral contrast agents, there is the additional concern that physiological uptake of FDG could be increased due to stimulation of peristalsis. A comparative study found the incidence of high FDG uptake was only significantly higher in the ascending colon when oral Gastrograffin (Schering Health Care) was given compared to a control group who received no contrast material[3]. However, a cohort study of positive oral contrast agents in PET-CT found that any contrast-induced artefacts produced were not clinically significant whilst the use of contrast media was considered to have been diagnostically helpful in 38 of 200 (19%) patients[4]. Oral contrast media was most helpful within the abdomen and pelvis and the most frequent benefit resulted from improved differentiation of lymph nodes or tumour masses from bowel. Nevertheless, the use of negative contrast media for PET-CT has been proposed in line with their increasing adoption into conventional CT practice. These agents are associated with significantly lower levels of FDG uptake in small bowel compared to barium[5].
Similarly, several studies in various groups of patients have suggested that CT studies with intravenous contrast enhancement can be used for attenuation correction without causing significant artefacts. On average, standardised uptake value (SUV)max values in areas of pathology are only 3–7% higher for PET studies corrected for attenuation using single-phase contrast-enhanced images compared to conventional non-enhanced acquisitions[6–8]. Some diagnostic advantages have been demonstrated through the use of contrast-enhanced PET-CT. In a study of 53 patients with rectal cancer, statistically significant improvements in the diagnosis of metastasis were observed for para-rectal, internal iliac and obturator lymph nodes[9]. For overall lymph node staging the specificity for detection of metastasis increased from 42% to 68% through use of contrast enhancement with no change in sensitivity (85%). A study of 50 patients with non-small cell lung cancer showed significant improvements in tumour delineation with 3 tumours correctly upstaged to T4 following contrast enhancement[10]. However, there was no change in N-stage for any patient whilst M-stage was changed in only one case. The authors suggested the improved tumour delineation would be of value in radiotherapy planning. Yet, when considering the use of PET-CT for radiation planning, it should be borne in mind that oral and intravenous contrast media may adversely affect the CT attenuation maps that are used to estimate regionally delivered radiation doses and hence both non-enhanced and contrast-enhanced studies may be necessary. Extending contrast enhancement to multiphase protocols (i.e. arterial and portal) may be associated with an increased likelihood of image mis-registration[11]. Nevertheless, in a study of 100 patients, compared to non-contrast CT, multiphase contrast-enhancement was judged to have added value in 52 patients with the highest impact occurring for gastrointestinal, lung and neuroendocrine tumours[12].
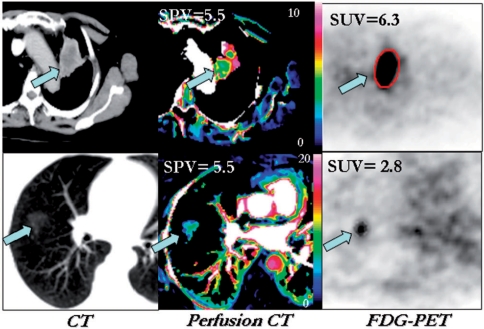
Quantification of contrast enhancement can improve the diagnostic performance of CT in certain circumstances and these benefits are potentially available for PET-CT as well. Most relevant is the quantification of enhancement for the characterisation of solitary pulmonary nodules (SPN). Although the sequential use of SPN enhancement and FDG-PET has been shown to be potentially cost-effective[13], the availability of PET-CT means that both techniques could be used in a single examination with development of combined uptake/enhancement criteria. Based on previous comparative studies[14–16], possible combined criteria might include a low uptake/enhancement ratio being indicative of an inflammatory lesion or carcinoid tumour, low enhancement with low-intermediate FDG uptake implying a benign lesion and high uptake with low enhancement suggesting malignancy with hypoxia (Fig. 2). However, further studies are needed to confirm the utility of this approach.
Figure 2.
Conventional CT (left), CT enhancement image (middle) and FDG-PET images (right) of malignant (upper row) and inflammatory (lower row) lung lesions. In the malignant lesion, glucose metabolism (expressed as the standardised uptake value (SUV)) exceeds enhancement (expressed as the standardised perfusion value (SPV) whereas the relationship between metabolism and enhancement is reversed in the inflammatory lesion. Reproduced from ref. [[17]].
Image processing
CT perfusion
Using appropriate kinetic models, tumour contrast enhancement can be analysed on a pixel-by-pixel basis to generate parametric maps of perfusion and other parameters that reflect tumour vascularity. Validated software approved by the US Food and Drug Administration is now available and CT perfusion imaging is emerging as a useful tool in oncology with applications in tumour diagnosis, risk stratification and response evaluation[17]. Extending the applications for contrast media in PET-CT to include CT perfusion imaging can allow anatomical information about tumours to be co-registered with perfusion data and metabolic information, such as glucose metabolism, in a single examination and the feasibility of this approach has recently been confirmed for head and neck cancers[18]. Novel image-derived parameters that reflect the relationship between tumour vascularity and metabolism have been described, for example the metabolic-flow difference calculated from the FDG SUV and standardised perfusion value (SPV) determined from contrast enhancement[19]. The use of perfusion CT in preference to administration of a second PET tracer such as [15O]water not only avoids the need for an on-site cyclotron but also overcomes some of the limitations of PET perfusion studies including the underestimation of perfusion values in small tumours due to the partial volume effect and the spillover of counts from adjacent structures with high blood flow (e.g. heart, aorta, liver)[20].
Although a parallel relationship between tumour perfusion and metabolism might be anticipated, several studies have shown that perfusion and metabolism may become uncoupled. Perfusion CT and FDG-PET studies have demonstrated such uncoupling in larger non-small cell lung cancers, cancers of the head and neck and colorectal liver metastases[19,21–23]. This uncoupling represents tumour adaptation to hypoxia that develops as the tumours increase in size and outgrow their blood supply. This adaptation to hypoxia is also associated with increased tumour aggression and treatment resistance[24]. Regional uncoupling of flow and metabolism is also found within tumours, adjacent to areas of necrosis.
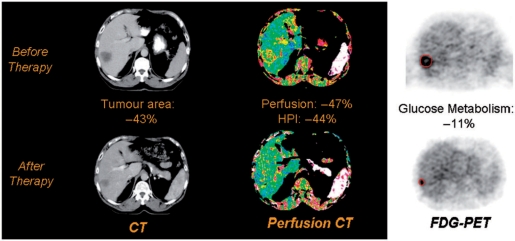
Uncoupling of vascularity and metabolism can also be induced by cancer therapy reflecting differential responses of the vascular and cellular compartments of tumour[25] (Fig. 3). Tumour type, drug type and dose, and time since therapy are all factors that affect the relative magnitude of change in these parameters. Uncoupling of flow and metabolism appears to be particularly likely following treatment with vascular-targeting agents, probably reflecting drug-induced hypoxia and secondary stimulation of glucose metabolism[24]. Hence CT perfusion-PET has the potential to sub-classify treatment response into three categories: (i) balanced (i.e. a significant reduction in both glucose metabolism and tumour vascularity); (ii) predominantly vascular; and (iii) predominantly metabolic. Although a balanced response seems most likely to be associated with a good outcome, it is probable that predominantly vascular and predominantly metabolic responses will differ in clinical significance. The possibility of modulating tumour responses by adapting therapy for individual patients on the basis of their vascular-metabolic response can be envisaged.
Figure 3.
Changes in tumour size (left), perfusion (centre) and metabolism (right) of a colorectal liver metastasis following chemotherapy. There has been a partial morphological response with a predominantly vascular functional response. This combination may indicate adaptation of the tumour to the development of hypoxia during therapy. This response pattern could potentially indicate a need to adapt therapy in order to achieve a full response. Reproduced from ref. [24].
Three-dimensional imaging
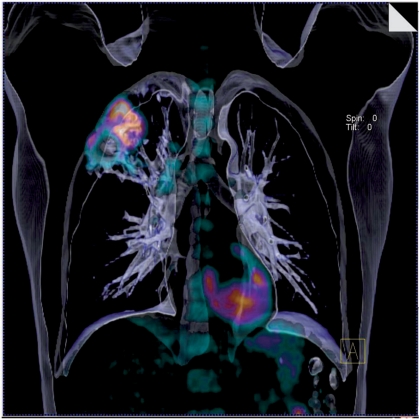
The use of image processing to produce three-dimensional (3D) views of body structures from CT data sets is increasing rapidly, for example CT colonography and virtual bronchoscopy. The advent of integrated PET-CT systems has created opportunities for fusion of PET data with these 3D CT imaging techniques (Fig. 4). The feasibility of PET-CT colonography has been demonstrated by several authors. Gollub et al. report excellent overlap at fusion imaging for 23 or 27 FDG-avid polyps of 10 mm or more in diameter[26]. PET detected 23 of 29 pre-malignant polyps and all 9 cases of cancer. However, the small studies performed to date have shown no improvement in detection rates for polyps resulting from addition of the PET data to CT colonography[26,27]. On the other hand, in a series of 55 patients, PET-CT colonography was found to be significantly more accurate than CT colonography for T and N staging of colon cancer (84% versus 70% and 82% versus 68% respectively)[28]. Nevertheless, the precise role for this technique remains to be determined. The feasibility of PET-CT virtual bronchoscopy has also been shown, even using the low-dose CT images acquired for attenuation correction[29]. The acquisition of CT in normal expiration was used to optimise the matching between PET and CT datasets and only minor mis-registration occurred in lower lung regions. All lung cancers were detected by both the CT and PET-CT techniques but PET-CT virtual bronchoscopy was significantly more accurate in the depiction of lymph node metastases. Just as for PET-CT colonography, further studies are required to define the clinical impact of this additional staging information.
Figure 4.
Fused volume-rendered CT and FDG-PET data displaying non-small cell lung cancer of the right upper lobe with nodal metastases.
Computer-assisted detection and diagnosis (CAD)
The use of automated computer systems that detect and characterise lesions with diagnostic images is more developed for CT than for PET. Commercial CAD systems, for example those that identify and measure the volume of lung nodules, are available for CT but not for PET. FDG-PET is commonly used to evaluate pulmonary nodules and follow up CT is recommended for FDG-negative SPNs. Automated volume measurements of these negative lung nodules can be performed at the time of PET to enable calculation of doubling time by comparison with either previous baseline or subsequent follow-up CT examinations[16]. CAD systems specifically for combined PET-CT data are also under development. Jafar et al. have reported early experience with a CAD system for detection of lung tumours in PET-CT images that uses features from the CT, attenuation corrected PET and uncorrected PET data sets[30]. A preliminary assessment of diagnostic performance indicates 75% sensitivity and 100% specificity. Nie et al. describe the application of an artificial neural network to classify pulmonary nodules as benign or malignant based on clinical features and image characteristics from both CT and PET[31]. The diagnostic performance in classifying 92 nodules as assessed by receiver operating characteristics, was highest when clinical parameters were combined with image features from both modalities (Az = 0.95) compared to combinations of clinical parameters with a single modality only. These studies highlight the potential of combined PET-CT CAD systems for the future.
Image evaluation
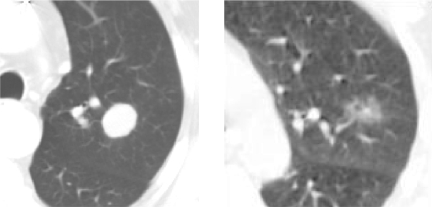
Although the diagnostic performance of PET is improved by the use of CT to anatomically localise FDG-avid lesions, further benefits can be obtained by incorporating the morphological appearances on CT into the overall interpretation. A study by Nomori et al. illustrates this concept particularly well by demonstrating that the diagnostic performance of PET in characterising focal lung lesions is markedly affected by the CT appearances of the lesion[32]. If the CT were simply used to confirm the presence of a corresponding anatomical abnormality, the sensitivity and specificity of FDG-PET for 116 lung lesions between 1 and 3 cm diameter would be 79% and 65% respectively. However, for lesions that had ground-glass appearances (Fig. 5) the sensitivity and specificity were only 10% and 20%, respectively, whereas the corresponding values for solid nodules were 90% and 71%.
Figure 5.
The accuracy of FDG-PET in the characterisation of lung lesions is highly dependent on the CT appearances. Nomori et al.[32] report sensitivity, specificity and accuracy values for FDG-PET in diagnosing malignancy in a solitary pulmonary nodule (left) of 90%, 71%, and 83%, respectively. The corresponding values for a ground-glass opacity (right) are 10%, 20% and 13%.
Conclusion
The above current and future benefits to be achieved by better utilisation of the CT component of PET-CT have important implications not only for manufacturers and purchasers of PET-CT equipment and analysis software but also for specialists working in PET-CT. Manufacturers cognisant of the potential for more sophisticated application of the CT component should integrate the necessary software packages within PET-CT systems. Many of these packages are currently available for CT and purchasers can request this software at the time of PET-CT purchase or subsequent upgrades. Specialists working in PET-CT will need CT competencies that are far beyond knowledge of cross-sectional anatomy and this may require changes in training curricula or close cooperation with CT specialists. Despite the passage of more than three decades since its introduction, CT continues to exhibit rapid evolution and these advances will inevitably impact on the practice of PET-CT.
References
- [1].von Schulthess GK, Steinert HC, Hany TF. Integrated PET/CT: current applications and future directions. Radiology. 2006;238:405–22. doi: 10.1148/radiol.2382041977. [DOI] [PubMed] [Google Scholar]
- [2].Gollub MJ, Hong R, Sarasohn DM, Akhurst T. Limitations of CT during PET/CT. J Nucl Med. 2007;48:1583–91. doi: 10.2967/jnumed.107.043109. [DOI] [PubMed] [Google Scholar]
- [3].Dizendorf EV, Treyer V, Von Schulthess GK, Hany TF. Application of oral contrast media in coregistered positron emission tomography-CT. Am J Roentgenol. 2002;179:477–81. doi: 10.2214/ajr.179.2.1790477. [DOI] [PubMed] [Google Scholar]
- [4].Groves AM, Kayani I, Dickson JC, et al. Oral contrast medium in PET/CT: should you or shouldn't you? Eur J Nucl Med Mol Imaging. 2005;32:1160–6. doi: 10.1007/s00259-005-1833-9. [DOI] [PubMed] [Google Scholar]
- [5].Antoch G, Kuehl H, Kanja J, et al. Dual-modality PET/CT scanning with negative oral contrast agent to avoid artifacts: introduction and valuation. Radiology. 2004;230:879–85. doi: 10.1148/radiol.2303021287. [DOI] [PubMed] [Google Scholar]
- [6].Yau YY, Chan WS, Tam YM, et al. Application of intravenous contrast in PET/CT: does it really introduce significant attenuation correction error? J Nucl Med. 2005;46:283–91. [PubMed] [Google Scholar]
- [7].An YS, Sheen SS, Oh YJ, Hwang SC, Yoon JK. Nonionic intravenous contrast agent does not cause clinically significant artifacts to 18F-FDG PET/CT in patients with lung cancer. Ann Nucl Med. 2007;21:585–92. doi: 10.1007/s12149-007-0066-3. [DOI] [PubMed] [Google Scholar]
- [8].Berthelsen AK, Holm S, Loft A, Klausen TL, Andersen F, Højgaard L. PET/CT with intravenous contrast can be used for PET attenuation correction in cancer patients. Eur J Nucl Med Mol Imaging. 2005;32:1167–75. doi: 10.1007/s00259-005-1784-1. [DOI] [PubMed] [Google Scholar]
- [9].Tateishi U, Maeda T, Morimoto T, Miyake M, Arai Y, Kim EE. Non-enhanced CT versus contrast-enhanced CT in integrated PET/CT studies for nodal staging of rectal cancer. Eur J Nucl Med Mol Imaging. 2007;34:1627–34. doi: 10.1007/s00259-007-0455-9. [DOI] [PubMed] [Google Scholar]
- [10].Pfannenberg AC, Aschoff P, Brechtel K, et al. Low dose non-enhanced CT versus standard dose contrast-enhanced CT in combined PET/CT protocols for staging and therapy planning in non-small cell lung cancer. Eur J Nucl Med Mol Imaging. 2007;34:36–44. doi: 10.1007/s00259-006-0186-3. [DOI] [PubMed] [Google Scholar]
- [11].Brechtel K, Klein M, Vogel M, et al. Optimized contrast-enhanced CT protocols for diagnostic whole-body 18F-FDG PET/CT: technical aspects of single-phase versus multiphase CT imaging. J Nucl Med. 2006;47:470–6. [PubMed] [Google Scholar]
- [12].Pfannenberg AC, Aschoff P, Brechtel K, et al. Value of contrast-enhanced multiphase CT in combined PET/CT protocols for oncological imaging. Br J Radiol. 2007;80:437–45. doi: 10.1259/bjr/34082277. [DOI] [PubMed] [Google Scholar]
- [13].Comber LA, Keith CJ, Griffiths M, Miles KA. Solitary pulmonary nodules: impact of quantitative contrast-enhanced CT on the cost-effectiveness of FDG-PET. Clin Radiol. 2003;58:706–11. doi: 10.1016/s0009-9260(03)00166-1. [DOI] [PubMed] [Google Scholar]
- [14].Yi CA, Lee KS, Kim BT, et al. Tissue characterization of solitary pulmonary nodule: comparative study between helical dynamic CT and integrated PET/CT. J Nucl Med. 2006;47:443–50. [PubMed] [Google Scholar]
- [15].Christensen JA, Nathan MA, Mullan BP, Hartman TE, Swensen SJ, Lowe VJ. Characterization of the solitary pulmonary nodule: 18F-FDG PET versus nodule-enhancement CT. Am J Roentgenol. 2006;187:1361–7. doi: 10.2214/AJR.05.1166. [DOI] [PubMed] [Google Scholar]
- [16].Orlacchio A, Schillaci O, Antonelli L, et al. Solitary pulmonary nodules: morphological and metabolic characterisation by FDG-PET-MDCT. Radiol Med (Torino) 2007;112:157–73. doi: 10.1007/s11547-007-0132-x. [DOI] [PubMed] [Google Scholar]
- [17].Miles KA, Cuenod C-A, editors. London: Informa; 2007. Multidetector computed tomography in oncology: CT perfusion imaging. [Google Scholar]
- [18].Bisdas S, Spicer K, Rumboldt Z. Whole-tumor perfusion CT parameters and glucose metabolism measurements in head and neck squamous cell carcinomas: a pilot study using combined positron-emission tomography/CT imaging. Am J Neuroradiol. 2008;May 15 doi: 10.3174/ajnr.A1111. [Epub ahead of print] [DOI] [PMC free article] [PubMed] [Google Scholar]
- [19].Miles KA, Griffiths MR, Keith CJ. Blood flow-metabolic relationships are dependent on tumour size in non-small cell lung cancer: a study using quantitative contrast-enhanced computer tomography and positron emission tomography. Eur J Nucl Med Mol Imaging. 2006;33:22–8. doi: 10.1007/s00259-005-1932-7. [DOI] [PubMed] [Google Scholar]
- [20].Bacharach SL, Libutti SK, Carrasquillo JA. Measuring tumor blood flow with H215O: practical considerations. Nucl Med Biol. 2000;27:671–6. doi: 10.1016/s0969-8051(00)00136-0. [DOI] [PubMed] [Google Scholar]
- [21].Hirasawa S, Tsushima Y, Takei H, et al. Inverse correlation between tumor perfusion and glucose uptake in human head and neck tumors. Acad Radiol. 2007;14:312–8. doi: 10.1016/j.acra.2006.12.017. [DOI] [PubMed] [Google Scholar]
- [22].Stewart EE, Chen X, Hadway J, Lee TY. Correlation between hepatic tumor blood flow and glucose utilization in a rabbit liver tumor model. Radiology. 2006;239:740–50. doi: 10.1148/radiol.2393041382. [DOI] [PubMed] [Google Scholar]
- [23].Williams RE, Miles KA. British Nuclear Medicine Society, Autumn Meeting. 2007. Quantitative studies into perfusion and metabolism in colorectal liver metastases using perfusion CT and FDG-PET; p. 7. [Google Scholar]
- [24].Miles KA, Williams RE. Warburg revisited: imaging tumour blood flow and metabolism. Cancer Imaging. 2008;8:81–6. doi: 10.1102/1470-7330.2008.0011. [DOI] [PMC free article] [PubMed] [Google Scholar]
- [25].Willett CG, Boucher Y, di Tomaso E, et al. Direct evidence that the VEGF-specific antibody bevacizumab has antivascular effects in human rectal cancer. Nat Med. 2004;10:145–7. doi: 10.1038/nm988. [DOI] [PMC free article] [PubMed] [Google Scholar]
- [26].Gollub MJ, Akhurst T, Markowitz AJ, et al. Combined CT colonography and 18F-FDG PET of colon polyps: potential technique for selective detection of cancer and precancerous lesions. Am J Roentgenol. 2007;188:130–8. doi: 10.2214/AJR.05.1458. [DOI] [PubMed] [Google Scholar]
- [27].Mainenti PP, Salvatore B, D’Antonio D, et al. PET/CT colonography in patients with colorectal polyps: a feasibility study. Eur J Nucl Med Mol Imaging. 2007;34:1594–603. doi: 10.1007/s00259-007-0422-5. [DOI] [PubMed] [Google Scholar]
- [28].Kinner S, Antoch G, Bockisch A, Veit-Haibach P. Whole-body PET/CT-colonography: a possible new concept for colorectal cancer staging. Abdom Imaging. 2007;32:606–12. doi: 10.1007/s00261-007-9202-8. [DOI] [PubMed] [Google Scholar]
- [29].Seemann MD, Schaefer JF, Englmeier KH. Virtual positron emission tomography/computed tomography-bronchoscopy: possibilities, advantages and limitations of clinical application. Eur Radiol. 2007;17:709–15. doi: 10.1007/s00330-006-0350-y. [DOI] [PubMed] [Google Scholar]
- [30].Jafar I, Ying H, Shields AF, Muzik O. Computerized detection of lung tumors in PET/CT images. Conf Proc IEEE Eng Med Biol Soc. 2006;1:2320–3. doi: 10.1109/IEMBS.2006.259238. [DOI] [PubMed] [Google Scholar]
- [31].Nie Y, Li Q, Li F, Pu Y, Appelbaum D, Doi K. Integrating PET and CT information to improve diagnostic accuracy for lung nodules: a semiautomatic computer-aided method. J Nucl Med. 2006;47:1075–80. [PubMed] [Google Scholar]
- [32].Nomori H, Watanabe K, Ohtsuka T, Naruke T, Suemasu K, Uno K. Evaluation of F-18 fluorodeoxyglucose (FDG) PET scanning for pulmonary nodules less than 3 cm in diameter, with special reference to the CT images. Lung Cancer. 2004;45:19–27. doi: 10.1016/j.lungcan.2004.01.009. [DOI] [PubMed] [Google Scholar]


