

Abstract
In previous experiments, on-line modulation of the gain of visual-motor transmission for pursuit eye movements was demonstrated in monkeys by showing that the response to a brief perturbation of target motion was strongly enhanced during pursuit relative to during fixation. The present paper elaborates the properties of on-line gain control by recording the smooth-pursuit eye movements of human subjects during tracking of a spot target. When perturbations consisted of one cycle of a 5-Hz sine wave, responses were significantly larger during pursuit than during fixation. Furthermore, responses grew as a function of eye/target velocity at the time of the perturbation and of perturbation amplitude. Thus human pursuit, like monkey pursuit, is modulated by on-line gain control. For larger perturbations consisting of a single sine wave at 2.8 Hz, ±19°/s, the degree of enhancement depended strongly on the phase of the perturbation. Enhancement was present when “peak-first” perturbations caused the target speed to increase first and was attenuated when “peak-last” perturbations caused target speed to decrease first. This effect was most profound when the perturbation was 2.8 Hz, ±19°/s but was also present when the amplitude of the peak-last perturbation was ±5°/s. For peak-last perturbations, the eye velocity evoked by the later peak of the perturbation was inversely related to that evoked by the preceding trough of the perturbation. We interpret these effects of perturbation phase as evidence that peak-last perturbations cause a decrease in the on-line gain of visual-motor transmission for pursuit. We conclude that gain control is modulated dynamically as behavioral conditions change. Finally, when perturbations were presented as a sequence of three large, peak-last sine waves starting at the onset of target motion at 10°/s, repeating the conditions used in prior studies on humans, we were able to replicate the prior finding that the response to the perturbations was equal during pursuit and fixation. We conclude that on-line gain control modulates human pursuit and that it can be probed most reliably with small, brief perturbations that do not affect the on-line gain themselves.
INTRODUCTION
Smooth-pursuit eye movements allow primates to stabilize the images from moving objects on the retina. Pursuit is a negative feedback control system, so that its input, image motion across the retina, causes smooth eye acceleration that eliminates image motion by driving eye velocity to match target velocity. Information about the speed and direction of image motion is provided by neurons in two extrastriate visual areas: the middle temporal area (MT) and the medial superior temporal area (MST). Once a target has been selected for pursuit, these cortical areas send a motor command through a variety of pathways to the cerebellum and then to the brain stem (see reviews by Keller and Heinen 1991; Lisberger et al. 1987).
The negative-feedback configuration of the pursuit system has led to the view that pursuit is a visual-motor reflex. However, considerable evidence now indicates that visual-motor processing for pursuit is subject to modulation by a mechanism that we call “on-line gain control.” Evidence for on-line gain control was provided quite long ago when Robinson (1965) observed that eye velocity tends to undergo spontaneous oscillations only during ongoing pursuit and not during fixation. Robinson (1965) proposed that a moving target engages neural pathways not normally engaged during fixation. Further evidence that the gain of visual-motor processing might differ during pursuit and fixation came from the observation that the dynamics of the eye velocity response to a given image motion depended on whether the image motion was used to start or stop pursuit (Krauzlis and Lisberger 1994; Luebke and Robinson 1988). The results of Robinson (1965) provide an a posteriori rationale for the existence of a gain control. Some degree of oscillation is tolerable when a high gain of visual-motor transmission allows pursuit to accomplish its major goal of reducing image velocity from 30 to about 2°/s. The low gain during fixation obviates the same oscillations; this would pose a problem for visual stability and high-acuity vision. Although prior experiments suggested that gain control might change according to behavioral mechanisms, they did not illuminate whether this change would be abrupt or continuous.
Experiments in our laboratory provided the most direct evidence for on-line gain control and suggested that it is modulated continuously. These experiments showed that the eye velocity evoked by a brief perturbation of target velocity was much larger when the perturbation was presented during ongoing pursuit versus during fixation (Schwartz and Lisberger 1994). The gain of the response to the perturbations was related to target velocity (and thus eye velocity because they were almost the same), so that the perturbations presented during 20°/s pursuit elicited larger responses than did the same perturbations presented during 10°/s pursuit. This finding suggests a distinction between the gain of pursuit, which was nearly one for both 10 and 20°/s pursuit, and the internal gain of the pursuit pathways, which was clearly different at the two velocities. The former gain is measured as steady-state eye velocity divided by target velocity and reflects the overall performance of a complex feedback system with many internal parameters, whereas latter gain is probed by our perturbations and is an internal parameter in pursuit. We refer to the latter gain when describing “on-line gain control.”
Recently, the existence of on-line gain control as a general feature of primate visual-motor processing has been called into question. Das et al. (1995, 1998) measured human eye movements and compared responses to perturbations presented during fixation and pursuit. Responses to perturbations presented in either condition were equal, suggesting that the gain control seen in monkeys might require extensive practice or be specific to nonhuman primates.
The goal of the present paper was to evaluate on-line gain control in human pursuit using the same experimental approaches as had been used on monkeys and humans. Eye velocity responses to perturbations presented during either fixation or pursuit were compared. Human subjects, like monkeys, showed larger responses to brief perturbations of target motion presented during pursuit. Moreover, some of the experiments reported here seem to explain why the prior human studies have not replicated the results from monkeys: instead of merely probing it, the perturbations used by Das et al. (1995, 1998) may also have altered the on-line gain of pursuit.
METHODS
Subjects
The participants in this study were scientists and students from the Keck Center for Integrative Neuroscience at University of California at San Francisco or members of the surrounding community. A total of six subjects, five female and one male were tested. All subjects gave their informed consent at the beginning of each experiment. Three of the subjects were completely naïıve, and three had some previous pursuit experience but were naïve to the specific hypothesis being tested. Experiments were performed over a 3-h period that included some breaks. Most subjects completed the experiment in 1 day, but on a few occasions, subjects had to return the next day to complete the testing. All subjects had vision that was either normal or corrected to normal. Experimental procedures were approved by the Human Subjects Committee at UCSF.
Eye-movement recording
Two-dimensional movements of the right eye were measured using the Fourward Technologies dual Purkinje image tracker (Generation 6.1). The subjects’ heads were stabilized using a chin rest and a head strap that subjects adjusted to be snug but comfortable. The tracker’s automatic moveable optical stage (auto stage) and focus servo were both disabled to avoid introducing head position artifacts into the eye position signal.
Visual stimuli
Visual stimuli were projected onto the back of a tangent screen that was 40 cm from the subject and subtended a visual angle of 32 × 26°. The image from a red LED provided a circular, 0.1° stationary fixation target (0.2 cd/m2). Circular 0.5° pursuit targets (3.5 cd/m2) were created by reflecting the beam from a fiber-optic light source off an orthogonally placed x-y pair of mirror galvanometers (GSI Lumonics, M series). The galvanometers were driven by the D/A outputs from a Pentium PC computer. During experiments, the room was quite dark because the tracker works best when the pupil is dilated.
Experiments were presented as a series of trials of duration 2.5–3s. Each trial began with the presentation of a stationary fixation point in the center of the tangent screen. In experiments that measured responses during fixation, a second target appeared in the center of the screen, replacing the red fixation target. In experiments that measured responses during pursuit, the second target appeared 5° to the left or right of the fixation target after a random interval of 300–400 ms. The eccentric pursuit target remained stationary for 300 ms. The red fixation target was then extinguished, and the eccentric target began moving toward the position of fixation at 5 or 10°/s. Each experiment also included separate trials (not included in subsequent analyses) in which the pursuit target moved away from the position of fixation so that the subject could not correctly anticipate the direction of target motion. The target velocities chosen are identical to those reported in other papers, allowing a direct comparison of findings. In addition, the target velocities selected were slow enough to ensure that an average subject could successfully acquire the target and pursue it with minimal residual image motion. It is important to minimize image motion at the time of the perturbation because the presence of image motion can reduce the responses to perturbations (Churchland and Lisberger 2001). For example, in monkeys, if either experimental design or poor pursuit superimposed the perturbations on a baseline image velocity of 1.5°/s, then the responses to perturbations were reduced by one-third.
In some trials (see following text), the ongoing target velocity was perturbed briefly. Perturbations of target velocity were created by adding at least one full cycle of a 2.8- or 5-Hz sine wave to the preexisting command for target position. Target velocity was in one direction for the first half of the cycle (the first component) and in the opposite direction for the second half of the cycle (the second component). As a result, there was no net change in the trajectory of target position. Perturbations were always along the axis of target motion in one of two phases. Perturbations that began with an increase in target speed are referred to as “peak-first” because the peak of those perturbations occurred in the first component of the perturbation and the trough occurred in the second component. Perturbations that began with a decrease in target speed are referred to as “peak-last” because the trough of those perturbations occurred in the first component and the peak occurred in the second component. Note for both peak-first and -last perturbations, the peak is the portion of the perturbation that is in the same direction as ongoing target velocity. The only difference is whether this peak occurs in the first (peak-first) or second half (peak-last) of the perturbation. Perturbations were superimposed on constant target velocities of 0, 5, or 10°/s and modulated target velocity by ±5, ±10, or ±19°/s depending on the perturbation; the total peak-to-trough deviations were 10, 20, and 38°/s. The larger ±19°/s perturbation was chosen to allow a direct comparison to other published data on humans (Das et al. 1995, 1998), and the smaller perturbations to allow comparison with published data on monkeys (e.g., Schwartz and Lisberger 1994). Each experiment block included trials with and without perturbations that were randomly interleaved. Trials without perturbations ensured that subjects could not predict whether a given trial would contain a perturbation and provided control traces against which the responses to perturbations could be compared.
Perturbations were presented either during fixation (“fixation perturbations”) or during pursuit (“pursuit perturbations”). Because even perturbations presented during fixation elicit a pursuit response to some degree, the pursuit/fixation distinction can become confusing. We do not put forth that the responses to fixation-perturbations can be called fixation; certainly pursuit mechanisms are sometimes engaged. The pursuit/fixation distinction instead refers to the initial conditions present when perturbations occur. When presented during pursuit, perturbations occur when the pursuit target is moving and pursuit is already engaged; when presented during fixation, perturbations begin when the pursuit target is stationary. The goal of using perturbations is to probe the internal gain of pursuit without changing that gain: one result from our study will provide constraints on the perturbations that are most suitable for this goal.
Pursuit perturbations began either at the time of, or 250 ms after, the onset of ramp target motion. Perturbations were presented late enough in the trial to ensure that the subjects had successfully acquired the target and were experiencing minimal residual image motion. Pursuit perturbations presented at the onset of ramp motion consisted of multiple perturbations at the same frequency. Fixation perturbations began at the same times relative to the onset of trials as they would have if the target had been moving. We tested responses to three ongoing target velocities, with and without perturbations of three frequencies, three amplitudes, and two phases. Our trial set did not include all combinations of these parametric variations but rather 70 trial types designed to include the parametric comparisons we wished to make. Importantly, all trials were presented in interleaved fashion, so that all data were collected in parallel in the same sessions, and target trajectories were unpredictable. We have chosen to present the results by grouping the data according to certain parametric variations. However, the fully interleaved design also allows us to compare the results of the different parametric variations throughout the paper without concern about temporally nonstationary performance by the subjects.
Data acquisition and analysis
Signals related to horizontal eye velocity, eye position, and target position were digitized during the experiment at a sampling rate of 1,000 samples/s for each channel. The eye position signal was low-pass filtered with a cutoff at 330 Hz, and voltages proportional to eye velocity were obtained by differentiating the eye position signals with an analog circuit (DC to 25 Hz, −3 dB). Signals related to target velocity were obtained during data analysis by digital differentiation of the target position samples with a band-pass of 50 Hz. Reducing the band-pass to 25 Hz, to match the eye velocity filtering, would not have changed the target velocity traces.
Data analysis was performed after the experiment by aligning trials to the onset of target motion and averaging responses to identical stimuli on a UNIX workstation. The digitized data from each trial were displayed on the computer screen to ensure that they were not contaminated with saccades, particularly during the presentation of the perturbation. Eye velocity traces containing saccades within 50 ms of the peak or trough of perturbations were not included in analysis. Because some stimulus conditions caused large amounts of image velocity during perturbations, one subject made a lot of saccades. This subject was excluded from analysis during conditions that caused this problem. Unfortunately, when multiple perturbations began at the onset of target motion, it was impossible to include only traces that were free of saccades. For this one condition only, the computer replaced each saccadic deflection of eye velocity with a straight line that connected the eye velocity before and after the saccade. Trials were sorted according to stimulus condition and responses to identical stimuli were aligned on the onset of target motion and averaged together. At least 12 responses were used for each average.
Averaged responses to perturbations presented during fixation reflect only the response to the perturbation because there is no ongoing pursuit. However, averages of the eye velocity evoked by perturbations presented during pursuit reflect both the response due to the perturbation and the ongoing pursuit eye velocity. To compare responses to pursuit-perturbations and fixation-perturbations, it was necessary to eliminate the component of the response to pursuit-perturbations that was due to ongoing pursuit and thus “isolate” the response to the perturbation. The isolation was achieved by computing the difference between the eye velocity averages for trials that did and did not contain a perturbation at each time point in the averages (Fig. 1A). This conservative approach ensured that any modulation of the ongoing pursuit response could not contribute to (and potentially enhance) the perturbation response that was measured.
FIG. 1.
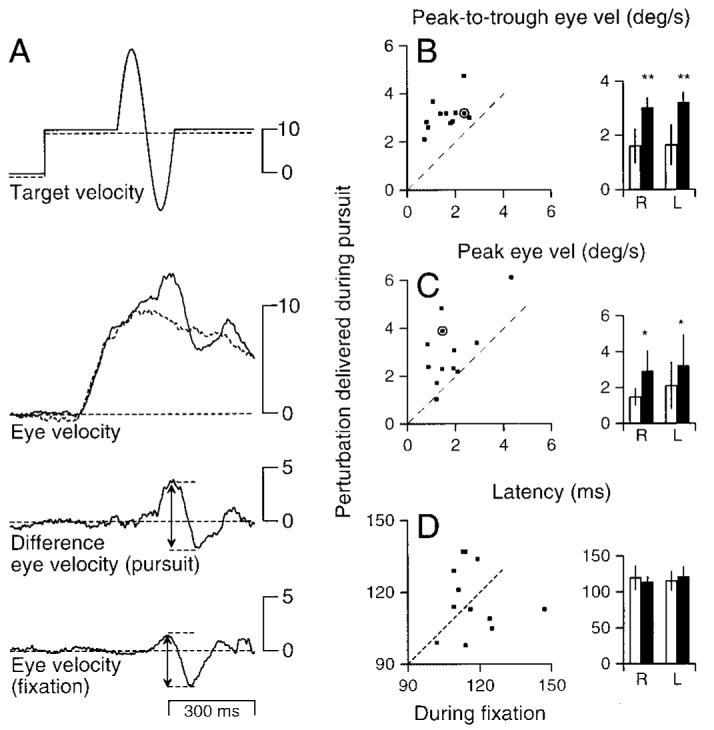
Enhancement of the response to brief perturbations of target motion during ongoing pursuit. A: eye and target velocity traces to illustrate how stimuli were presented and measured. Top traces: examples of 2 trajectories of target motion. - - -, the trajectory of a rightward pursuit target moving at 10°/s. —, the trajectory of a rightwards target with a 5 Hz, ±18°/s perturbation. Second traces: averaged responses to the 2 target motions. Third trace: the difference between the responses to target motion with and without the perturbation at each millisecond. Bottom trace: the response to a 5 Hz, ±18°/s fixation perturbation. In all cases, upward deflections of the traces indicate rightward motion. Arrowheads indicate the peak and trough of the response. B and C: comparison of responses under the 2 conditions: each symbol plots data for 1 subject and shows responses to 5-Hz pursuit perturbations of ±18°/s presented during 10°/s ongoing pursuit. - - -, slope of 1; would be obtained if the responses were the same under the 2 conditions. ■ data from the subject whose traces are shown in A. Inset: averaged responses to rightward and leftward fixation perturbations (□) or pursuit perturbations ( ■) for all subjects. “R” and “L” in x-axis labels indicate the direction of pursuit and of the 1st component of the perturbation. *, significance at P < 0.05; **, significance at P < 0.01. Error bars indicate SDs. The graphs in B and C were derived from the same data but represent different measures of the response to the perturbation: half of peak-to-trough excursion of average eye velocity in B and peak excursion in C. D: a comparison of response latencies to perturbations presented during pursuit or fixation. Each point shows, for pursuit and fixation, the time difference between peak target velocity and peak eye velocity. Inset: averaged latencies for rightward or leftward fixation perturbations (□) or pursuit perturbations (■) for all subjects.
Because subtracting one trace from another can amplify existing noise, we wanted to ensure that the traces used were as smooth as possible. We were particularly concerned because our method of isolation was only used for pursuit perturbations: fixation perturbations did not need to be isolated from an ongoing pursuit velocity because ongoing pursuit velocity was zero. This might result in an overestimation of pursuit perturbations and could unfairly bias the experiment. Therefore all averaged traces were passed through a 25-Hz digital filter to reduce noise. Superposition of the filtered and unfiltered traces confirmed that the filter did not change the responses (there was no ringing, for example) but only reduced the noise to facilitate a fair quantitative analysis.
Once the responses to perturbations were isolated, their amplitude was quantified in one of two ways. 1) Peak-to-trough method: response amplitude was estimated by measuring half the peak-to-trough eye velocity in a “response interval” that started 120 ms after the perturbation and had the same duration as the perturbation. When multiple perturbations were presented in sequence, half the peak-to-trough eye velocity was computed for each cycle of the perturbation and then these were averaged. This method of estimating amplitudes was selected because it is most similar to those used in other papers with which we would like to compare results (i.e., Das et al. 1995, 1998; Schwartz and Lisberger 1994). 2) Peak-only method: especially for perturbations that consistently caused asymmetric responses, we measured the amplitudes of the responses to the first and second components separately. For fixation perturbations, the amplitude of the each component was estimated as the maximal deviation from zero eye velocity during the first or second half of the response interval defined above. For pursuit perturbations, the same analysis was performed on the isolated responses to the perturbation obtained by subtracting the response to unperturbed target motion. The reader can assume that peak-to-trough methods were used to obtain the values given in RESULTS unless it is stated otherwise.
For both methods of analysis, the response to the first component of the perturbation is essentially the response to a unidirectional perturbation. In experiments that used 5-Hz sine waves to create the perturbations, the first component of the response falls entirely within the “open-loop” interval before there has been enough time to allow feedback about the visual consequences of the response. We would have liked to create a situation where both the peak and trough of the response to a perturbation fell within the open-loop interval, but this would have required the use of 10-Hz sine waves to construct perturbations, and most humans show poor responses to such high-frequency stimuli even if they are delivered during ongoing pursuit.
Statistics were performed on population data considering responses to leftward and rightward perturbations separately. We did not attempt to evaluate the statistical significance of the effects in individual subjects because our data analysis made it impossible to assess the variance of individual means. Both our method of “isolating” responses to perturbations and our method of estimating response amplitude include computations that change the variance nonlinearly. Enough subjects were tested to enable statistical testing on group data rather than individual subjects’ responses.
RESULTS
The traces in Fig. 1A show the results of averaging the eye velocity for 15 responses to the same target motions to illustrate how stimuli were presented and to demonstrate that the perturbations evoked clear, bidirectional changes in eye velocity. The basic approach in our data analysis (see METHODS for details) was to isolate the response to the perturbations by comparing the responses to target motions that were identical except for the presence (—) or absence (- - -) of perturbations. Subtraction of the two eye velocity traces (Fig. 1A, 2nd traces) yielded “difference eye velocity” (3rd trace), which represents the isolated response to the perturbation. Consequently, the difference eye velocity is near zero (- - -) up to the time of the response to the perturbation. In this example, the modulation of eye velocity evoked by the perturbation during pursuit (Fig. 1A, 3rd trace) was larger than that evoked by the same perturbation during fixation (Fig. 1A, bottom).
Perturbations of target motion during fixation and pursuit
Six subjects were used to determine whether responses to pursuit perturbations were larger than responses to fixation perturbations. They were tested with peak-first perturbations that consisted of single sine waves at 5 Hz, ±19°/s presented during 10°/s pursuit or during fixation. Note that the responses recorded during rightward and leftward pursuit are compared with the responses to the fixation perturbations of the same phase. Both for measurements using the peak-to-trough method (Fig. 1B) and the peak-only method (Fig. 1C), the responses to pursuit-perturbations were larger than the responses to fixation-perturbations: 11 of 12 ■ lie above the - - -. Average responses to fixation perturbations (□) and pursuit perturbations (■) across subjects are shown in the bar graphs on the right of each of these scatter plots. A one-tailed paired t-test for the equality of two sample means revealed that pursuit perturbations yielded larger responses than fixation perturbations for both directions of pursuit, again for both the peak-to-trough analysis (leftward pursuit: P < 0.01; rightward: P < 0.01) and the peak-only analysis (leftward pursuit: P < 0.03, rightward: P < 0.03). The data in Fig. 1 are in agreement with the results of the same experiments on monkeys.
To test whether the enhancement changed the timing of the response, we measured the latency between the peak of target motion and the peak of the response. Plotting the latencies for pursuit-perturbations versus those for fixation perturbations failed to reveal any consistent difference (Fig. 1D). Further, for both pursuit and fixation, between group means were not significantly different for rightward versus leftward perturbations.
Responses grow as a function of ongoing pursuit velocity
To examine whether enhancement of the response to perturbations of target velocity was dependent on ongoing pursuit velocity, the amplitude and frequency of the perturbations was held constant (5 Hz, ±5°/s), while ongoing target velocity was varied among 0, 5, and 10°/s. Figure 2A shows averages of responses across all subjects at each of the three velocities tested. These three points were fitted with a line with a positive slope of 0.12, implying that each degree per second of ongoing smooth eye velocity increased the response to a ±5°/s perturbation by 0.12°/s. The statistical significance of the relationship between response to perturbations and ongoing eye/target velocity was tested in two ways. First, linear regression was used to estimate the slope and y intercept of each subject’s responses. All subjects’ slopes were greater than zero, and the slope for the population means was significantly greater than zero (P < 0.01). The same results were obtained for the peak-only method of data analysis (P < 0.05). Expressed as a percentage of the means, the variance of the slopes was smaller than that of the y intercepts, arguing that subjects differ more in their baseline responses to perturbations than in the degree to which the responses are enhanced. The second way the significance was tested did not make assumptions about the linearity of the increase in responses. Separate pair-wise t-tests of the population data revealed that responses at 5°/s were significantly greater than those at 0°/s (rightward pursuit: P < 0.02, leftward: P < 0.01), and responses at 10°/s were significantly greater than those at 5°/s (rightward pursuit: P < 0.04, leftward: P < 0.03).
FIG. 2.
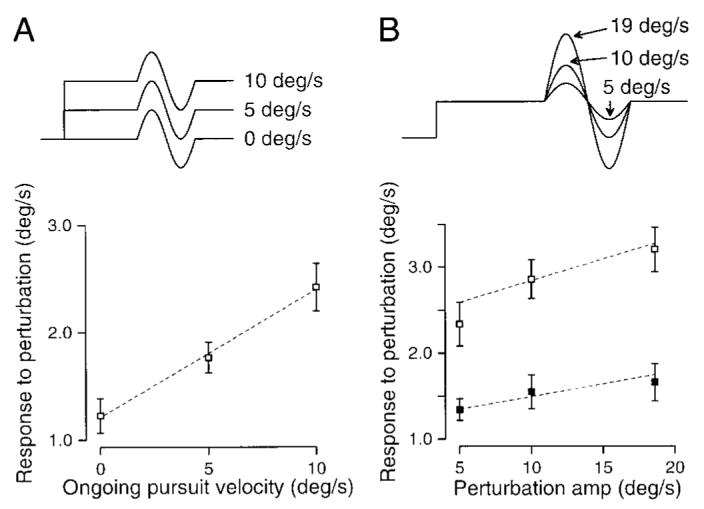
Responses to perturbations increase with ongoing pursuit velocity and perturbation amplitude. A, top: target velocity traces for perturbations during 3 different target velocities. Bottom: responses to perturbations presented as a function of ongoing pursuit velocity. Error bars indicate standard error of the mean. B, top: target velocity traces for perturbations of 3 different amplitudes presented during pursuit at a constant velocity. Bottom: responses to perturbations presented as a function of perturbation amplitude. ■, responses to perturbations presented during fixation; □, responses to perturbations presented during pursuit.
Responses grow with perturbation amplitude
To examine whether the enhancement was dependent on perturbation amplitude, the frequency of the perturbations and the ongoing pursuit velocity were held constant (5 Hz at 10 or 0°/s) while perturbation amplitude was varied (±5, ±10, and ±19°/s). In Fig. 2B, which shows the mean responses across six subjects, the responses increased linearly with perturbation amplitude for perturbations presented during both pursuit and fixation. The slopes of the regression fits were significantly greater than zero for both pursuit perturbations (P < 0.01) and fixation perturbations (P < 0.04). The slopes for pursuit were on average slightly larger than those for fixation, and this difference was significant (P < 0.03). Again, we obtained the same results using the peak-only analysis method: slopes for pursuit and fixation perturbations were significantly greater than zero (pursuit: P < 0.001, fixation: P < 0.03). Again, pair-wise t-tests revealed that responses to pursuit-perturbations were significantly larger for perturbation amplitudes of ±10°/s compared with ±5°/s (rightward pursuit: P < 0.01, leftward: P < 0.01), for perturbations of ±19°/s compared with ±5°/s (rightward pursuit: P < 0.02, leftward: P < 0.01), and for ±19°/s compared with ±10°/s for leftward pursuit only (P < 0.03). Responses were smaller for perturbations presented during fixation, as were the differences between responses. These differences reached significance only for perturbation amplitudes of ±19°/s compared with ±5°/s, during rightward pursuit only (P < 0.03).
Response depends on phase of perturbation
To examine the possibility that perturbations need to be small and/or brief to elicit enhanced responses during pursuit, we again measured responses as a function of perturbation amplitude, this time using much lower frequency perturbations (2.8 Hz). As before, ongoing target/eye velocity was 10°/s and perturbations were either ±5, ±10, or ±19°/s, as shown in Fig. 3A. For peak-first perturbations (the black traces shown in Fig. 3A), the data agreed with the results summarized in Figs. 1 and 2. When data were analyzed using the peak-to-trough method (Fig. 3B, ×), the slopes of the relationship between response and pursuit-perturbation amplitude were significantly larger than zero (P < 0.01). The results were the same if we used the peak-only method (Fig. 3B, black squares), and the slope of the relationship remained significantly greater than zero (P < 0.03). Comparison of the responses to peak-first perturbations delivered during pursuit and fixation (Fig. 3, C, black squares, and D, black bars) confirmed our earlier finding that the responses to pursuit perturbations were larger than those to fixation-perturbations in all subjects. As before, these differences were statistically significant (right: P < 0.01, left: P < 0.01).
FIG. 3.
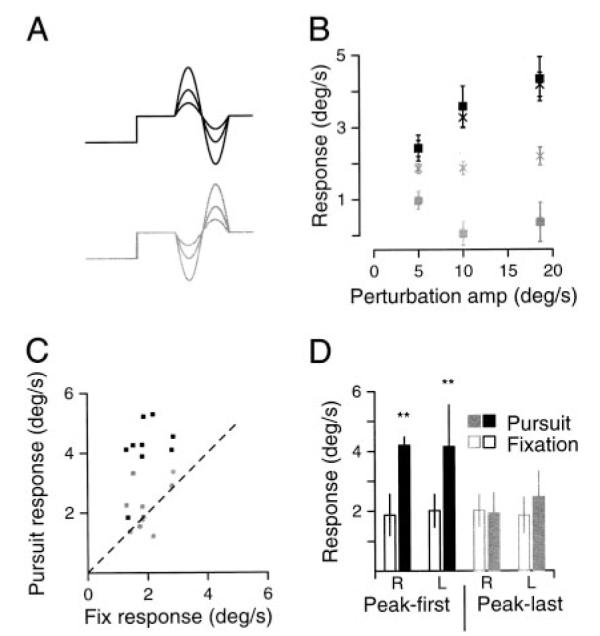
Enhancement of the response to a pursuit perturbation can depend on perturbation phase. A: target velocity traces for the 6 conditions reported in the figure. Traces with peak-first perturbations are black, those with peak-last perturbations are gray. Perturbations were all 2.8 Hz and of amplitude 5, 10, or 19°/s. B: responses to perturbations as a function of perturbation amplitude. Black symbols indicate responses to peak-first perturbations; gray symbols indicate responses to peak-last perturbations. Points labeled with squares indicate that amplitude was measured using the peak-only method; for points labeled with ×, amplitude was estimated as half the peak-to-trough. Error bars indicate standard error of the mean. C: comparison of responses during fixation and pursuit: each symbol plots 1 subject’s peak-to-trough response to a 19°/s perturbation at 2.8 Hz presented during ongoing pursuit at 10°/s. Gray and black squares indicate responses to perturbations in the peak-last and peak-first orientation, respectively. The dashed line has a slope of 1 and would be obtained if the responses were the same under the 2 conditions. D: averages of the responses shown in C to rightward or leftward perturbations presented during fixation (open bars) or pursuit (filled bars) for all subjects. Gray and black bars indicate responses to peak-last and peak-first perturbations, respectively. “R” and “L” in the x-axis labels indicate the direction of the 1st phase of the perturbation. Significance at P < 0.05 is represented by an asterisk; significance at P < 0.01 is represented by two astrices. Error bars indicate SDs.
Responses to perturbations in the peak-last phase differed from responses to the peak-first phase in three ways. First, the tendency for response amplitude to increase in parallel with perturbation amplitude was much weaker: the slopes obtained from linear regression were no longer significantly greater than zero (gray symbols, Fig. 3B). Second, the two methods used to estimate response amplitude yielded rather different responses. Whereas the peak-to-trough method of analysis resulted in a slope of zero (Fig. 3B, gray ×), the peak-only method resulted in a negative slope (Fig. 3B, gray squares), implying that as perturbation amplitude became larger, responses shrank. Third, for amplitudes of ±19°/s, peak-last pursuit-perturbations did not evoke statistically larger responses than fixation perturbations whether the response was measured using the peak-to-trough method (Fig. 3, C, gray symbols, and D, gray bars) or the peak-only method (not shown). In addition, peak-to-trough measurements of the responses to peak-first perturbations were greater than those to peak-last perturbations delivered during either direction of pursuit (rightward pursuit: P < 0.01, leftward: P < 0.03).
Figure 4 illustrates averages of the eye velocity evoked by peak-first and peak-last perturbations of 2.8 Hz, ±19°/s to explain why the responses are so different. For two peak-first perturbations of different amplitudes (Fig. 4A), the subject’s response to the larger perturbation (gray traces) is, as expected, larger than the response to the smaller perturbation (black traces). Both responses have large initial peaks (indicated by the arrows), so that the peak response in the difference eye velocity traces is large and positive. For the same two perturbations in peak-last phase (Fig. 4B), the response to the 19°/s perturbation (gray traces) has a smaller peak than that to the 5°/s perturbation (black traces). Note that the smaller peak response occurs after a larger decrease in target velocity. Surprisingly, the larger first phase (the trough) of the response to the peak-last perturbation indicates good pursuit by the subject, yet it leads to a poorer response to the second phase (the peak). To emphasize the relationship between a large first response and a weak second response, Fig. 4C compares the response of two subjects. One subject has large responses (gray traces) and the other, small responses (black traces) to perturbations. The subject with large responses, which we consider excellent pursuit, was able track the target quite accurately during the first component as it dipped toward zero but showed essentially no response to the second component of the perturbation. The subject with poor responses tracked the first component of the perturbation poorly, but her peak response, which occurred during the second component, is clearly identifiable and much larger than that in the subject who outperformed her on the other conditions. The comparison of these two subjects suggests that the response to the first component might have an effect on the response to the peak during the second component and that the amplitude of the first and second components of the response might be inversely related at least for peak-last perturbations.
FIG. 4.
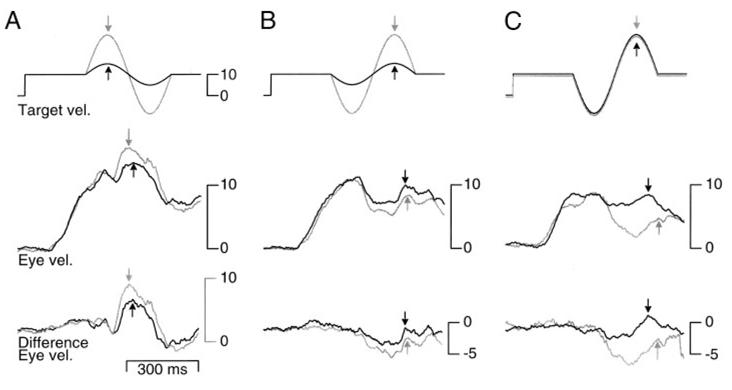
Average traces explaining why responses to large perturbations might depend more strongly on phase than responses to small perturbations. A: target velocity and average eye velocity in response to 2.8-Hz perturbations of ±19°/s (gray trace) or 5°/s (black trace) presented in the peak-first phase during ongoing pursuit at 10°/s. B: target velocity and average eye velocity in response to 2.8-Hz perturbations of ±19°/s (gray trace) or 5°/s (black trace) presented in the peak-last phase during ongoing pursuit at 10°/s. C: target velocity and average eye velocity for 2 different subjects in response to the same 19°/s perturbation. In all panels, the top trace represents target velocity; the middle trace, eye velocity; and the bottom trace, the difference eye velocity. Gray and black arrows indicate the peak response on each trace and have been placed at the time used for the latency analyses.
Figure 5 examines the relationship between the first and second components of the responses to perturbations by rean-alyzing data used to create Fig. 3. The use of an experimental design with three amplitudes of peak-last perturbations ensured that we obtained a large enough range of responses to the first component of the perturbation to make this analysis practical. Plotting the amplitude of the response to the second component as a function of that to the first component verified that the magnitudes of the responses to the first and second components were inversely related for peak-last perturbations (Fig. 5A, r = −0.49, P < 0.005). We did not find a significant relationship when the same analysis was performed on the responses to peak-first perturbations (Fig. 5B, r = 0.09, ns). To obtain the numbers plotted in Fig. 5, we measured the responses to each component separately as the value of the peak and trough of each response relative to the eye velocity evoked during pursuit of unperturbed target motion. Each response was given a positive sign if it caused eye velocity to deviate in the direction of that component of the perturbation. Thus negative values of the amplitude of the second component indicate that the “peak” of the response to the peak-last perturbation was less than the response to unperturbed target motion. All values were positive for peak-first perturbations.
FIG. 5.
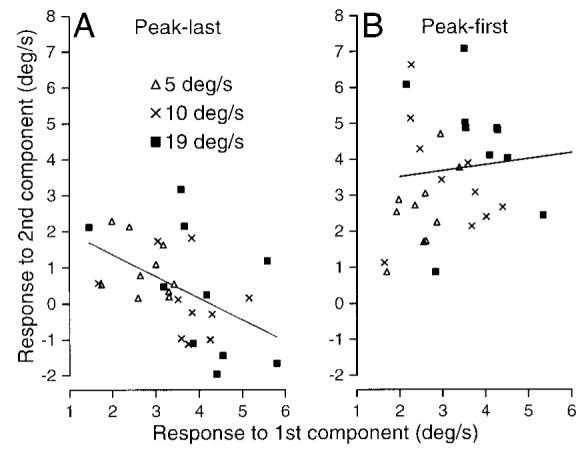
Inverse relationship between the amplitude of the responses to the 1st and 2nd components of peak-last but not peak-first perturbations. A: comparison of responses to 1st and 2nd components of 2.8-Hz peak-last perturbations: each symbol plots data for 1 subject. Different symbols show responses to perturbations of 3 sizes (±5, ±10, and ±19°/s) as defined in the key. The line is a linear fit of the data. Responses to the 2 components were inversely related (r =−0.49, P < 0.005). B: comparison of responses to 1st and 2nd components of the response to peak-first perturbations. Responses to the 2 components were not significantly correlated (r = 0.09).
Replication of conditions that did not produce enhancement of responses to perturbations in prior studies
When Das et al. (1995, 1998) examined on-line gain control in human pursuit, they used conditions that differed in several ways from the conditions used here to demonstrate gain control (Fig. 1). They began perturbations at the onset of target motion, used perturbations that consisted of multiple cycles of sine waves in the peak-last configuration, and took target velocity to or below zero on each cycle. To understand the apparent difference between their data and ours, we repeated their experimental conditions with our subjects, who showed enhanced responses to perturbations in conditions modeled after those used by Schwartz and Lisberger (1994) in monkeys. As shown in Fig. 6A, the target trajectory consisted of a 10°/s step of target velocity summed with several cycles of sinusoidal target velocity at 2.8 Hz, ±19°/s (—). Responses were analyzed as before, by subtracting the response to 10°/s target motion alone (- - -) from the response to 10°/s target motion with perturbations (—), yielding a difference eye velocity during pursuit for comparison with the response to the sine waves presented alone during fixation (in Fig. 6B). Responses to the three cycles of the perturbation were averaged.
FIG. 6.
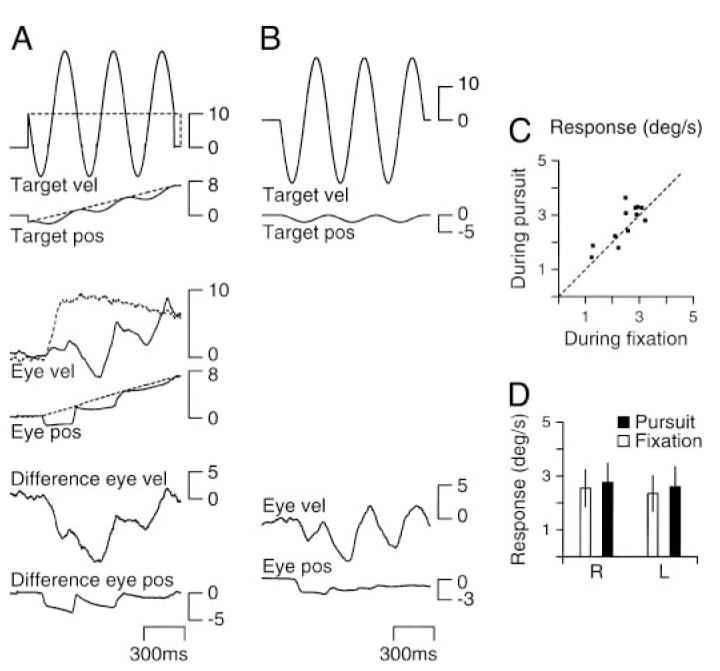
Weak or absent enhancement of the response to continuous, sinusoidal perturbations imposed starting from the onset of ramp target motion. A: eye and target position and velocity traces for perturbations presented during pursuit. Each pair of traces shows target velocity above target position. From top to bottom, the traces are target, eye, and difference velocity and position. Dashed traces indicate unperturbed target motion against which trials containing perturbations were compared. B: eye and target position and velocity traces for perturbations presented during fixation. From top to bottom, traces are target velocity and eye velocity. C: comparison of responses under the 2 conditions: each symbol plots data for 1 direction of pursuit and 1 subject (12 points, 6 subjects total) and shows responses to pursuit perturbations as a function of the response to the same fixation perturbations. - - -, a slope of 1; would be obtained if the responses were the same under the 2 conditions. D:■ and [□], the average peak-to-trough amplitude of the response to 3 perturbations presented during pursuit and fixation, respectively. “R” and “L” in the x-axis labels indicate the direction of the 1st phase of the perturbation. Error bars indicate SD.
In agreement with the data of Das et al. (1995, 1998), we did not observe a striking difference in the size of the response to pursuit-perturbations versus fixation-perturbations. Plotting the average modulation of eye velocity for the three cycles of pursuit-perturbations as a function of that for fixation-perturbations (Fig. 6C) revealed that most subjects showed equal amplitude responses. Statistical analysis of the averages across subjects (Fig. 6D) failed to reveal any significant difference.
Averaging responses to the three cycles of perturbations allowed us to summarize the results of this experiment using the same metric as Das et al. (1995, 1998). However, the example traces in Fig. 6A suggest that the response to this condition may change with each cycle of the perturbation. To allow a closer examination, Fig. 7A plots the average responses in our population of subjects for each cycle separately. In the first cycle, fixation perturbations elicited larger results than did pursuit perturbations (rightward pursuit: P < 0.01, leftward: P < 0.01). In the second cycle, by contrast, pursuit perturbations elicited larger responses than did fixation-perturbations (rightward pursuit: P < 0.03, leftward: P < 0.03). In the third cycle, responses were not significantly different. Figure 7B shows the corresponding latencies associated with each cycle. These latencies tended to be highly variable across subjects, and differences between the responses to pursuit and fixation perturbations did not reach significance on any cycle. The latencies decreased considerably over the course of the trial, reaching on average 52 ms (for pursuit perturbations) or 48 ms (for fixation perturbations).
FIG. 7.
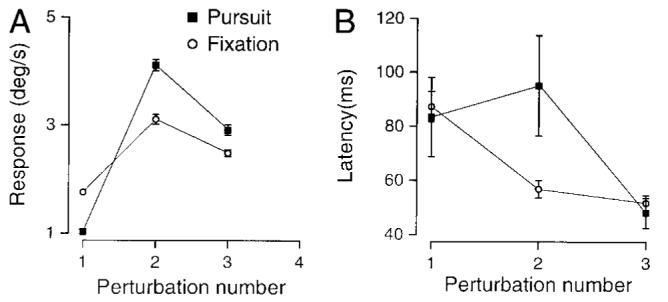
Sequential development of the response to perturbations as a function of the number of the perturbation in the sequence. A: each symbol plots the response to 1 of the perturbations averaged across all subjects. ■ responses to pursuit perturbations; ○, responses to fixation perturbations. Responses during fixation were larger than those during pursuit for the 1st cycle (P < 0.01), but the reverse was true for responses to the 2nd perturbation (P < 0.01). Responses to the 3rd perturbation were not significantly different. Error bars indicate standard error of the mean. B: each symbol plots the lag between the peak of the pursuit response and the peak target response. Pursuit and fixation lags were not significantly different for any of the 3 perturbations, although the lag on the 2nd perturbation came close (P < 0.07).
DISCUSSION
Schwartz and Lisberger (1994) showed that, in monkeys, perturbations of target velocity presented during pursuit elicit larger responses than those presented during fixation. They interpreted the enhancement as the result of the on-line gain control that had been postulated earlier by a number of investigators (i.e., Luebke and Robinson 1988; Robinson 1965). However, the existence of gain control in monkey pursuit did not necessarily imply it would be a general feature of primate smooth pursuit. Human and monkey pursuit systems seem to be similar in most regards (Lisberger et al. 1981; Lisberger and Westbrook 1985; Tychsen and Lisberger 1986), but species differences cannot be ruled out a priori. In addition, the monkeys tested by Schwartz and Lisberger (1994) had extensive pursuit experience. Their repeated exposure to moving targets might have made their enhanced responses atypical of untrained subjects. The data presented here argue strongly that the observed enhancement during pursuit is not limited to nonhuman primates and occurs in untrained subjects.
Gain control as a consistent feature of primate smooth pursuit
Our data about on-line gain control in human and monkey pursuit present a picture that is in excellent agreement with both sets of seemingly conflicting data in the literature. In the experiments designed to mimic those conducted on humans by Das et al. (1995, 1998), we reproduced their inability to demonstrate on-line gain control. In the experiments designed to mimic those conducted on monkeys by Schwartz and Lisberger (1994), we reproduced their successful demonstration of online gain control: responses to perturbations of target velocity were enhanced during pursuit versus during fixation. The gains of responses to pursuit perturbations were somewhat lower in humans (0.2–0.4) than in the monkeys (0.4–0.6) studied by Schwartz and Lisberger (1994). However, the gains were also lower for most humans than monkeys for fixation perturbations (0.06–0.2 for humans; 0.2–0.3 for monkeys) so that the amount of enhancement was comparable in both species. Our human subjects were also like monkeys in that their responses grew as a function of ongoing target/eye velocity, suggesting that on-line gain control in both species is modulated continuously rather than as a bimodal switch. We conclude that modulation of the gain of visual-motor transmission for pursuit on a short time scale is a general property of primate pursuit systems.
The method used to analyze the data is an important issue for interpreting our results. Ideally, all measurements should be taken in the “open-loop” interval, which is approximately the first 100 ms of the response to a perturbation in humans. This proved impractical because human subjects do not emit high-gain responses for perturbations that consist of a 10-Hz sine wave, and we had to use 5-Hz sine waves. We accomplished an equivalent goal by analyzing much of our data using the peak-only method, which takes a measurement within the open-loop interval. In general, the results of the peak-only method were the same as those for the peak-to-trough method but were slightly more variable. Further, one subject failed to show enhancement in the peak-only analysis of responses to perturbations presented during leftward pursuit. This subject had rather low gain for leftwards pursuit in general, and, unlike the other subjects, was experiencing ≥2°/s of image velocity at the time when the perturbations were presented. Churchland and Lisberger (2001) recently demonstrated that the response to a perturbation is attenuated if baseline image velocities as small as 2°/s are present at the time of the perturbation. We expect that this effect accounts for the smaller responses to perturbations in one subject. Why it would be more pronounced using the peak-only analysis method over the peak-to-trough method is puzzling.
Importance of perturbation parameters on their utility for probing on-line gain of pursuit
In our experiments, perturbations were meant as probes to read out the instantaneous on-line gain of pursuit. However, we found a number of troubling failures of the perturbation approach that suggest the need for caution in the use of perturbations and the interpretation of the eye movements they evoked. For example, when perturbations initiate a large decrease in eye velocity, they appear to disrupt the subsequent response to an increase in target velocity. Thus in our data, it was harder to demonstrate convincing on-line gain control using peak-last perturbations, and the response to the peak of target velocity often failed to take eye velocity above the baseline. The negative correlation between the size of the response to the trough and the peak of peak-last perturbations suggests a causal relationship between the large decrease in eye velocity for the early trough in target velocity and the small response to the subsequent peak. Further, the finding that the response increases as a function of the amplitude of the perturbation for peak-first but not peak-last perturbations suggests that these two phases of perturbation can have quite different effects on the pursuit system.
Our interpretation of the response to peak-last perturbations is that the initial decrease in eye/target velocity has the unfortunate side effect of decreasing the on-line gain of pursuit. Thus we suggest that peak-first perturbations provide the cleanest stimulus for probing the on-line gain of pursuit. Further, small perturbations cause a smaller change in eye velocity than do larger perturbations and therefore should be better for probing the on-line gain of pursuit without modifying it. The need for careful choice of perturbations should not be taken as evidence that on-line gain control is present only in restricted conditions. In fact, the opposite appears to be true: a careful choice of perturbations is necessary because on-line gain control may modulate pursuit so quickly that an ill-chosen perturbation can reduce the same on-line gain it was designed to measure. When suitable perturbations were chosen, our data showed that on-line gain control was evident during pursuit for all the subjects we tested.
Two alternative explanations can be posed to account for the poor response to peak-last perturbations. First, perhaps the initial decrease in eye velocity does not change on-line gain but simply provides a very low starting point to which a major change in eye velocity must be added. Perhaps the oculomotor system is poor at making large, rapid changes in smooth eye velocity. We find this possibility unlikely because our data contain other examples of rapid changes in smooth eye velocity. For example, pursuit initiation produced a large, rapid change in eye velocity in all our subjects. Second, the high image velocity, rather than the low eye velocity, could be responsible for changing the strength of on-line gain control. This seems plausible since the presence of baseline image velocity reduces the responses to perturbations (Churchland and Lisberger 2001). However, if image velocity is responsible for reducing the response to the peak in peak-last perturbations, then we would not expect the inverse relationship between the magnitude of the first and second components of the responses to peak-last perturbations (Figs. 4C and 5). Large responses to the first component represent better pursuit and would reduce image velocity more than small responses: large responses to the first component of the response to peak-last perturbations should be associated with large responses in the second component, exactly the opposite of what we found.
Finally, it seems worth considering how we might explain the absence of a positive relationship between the responses to the second and first components of peak-first perturbations. One possible explanation is that two different states of the pursuit system could result in the same response to the first (peak) component for peak-first perturbations with different responses to the second (trough) component. If the system had a high internal gain, then the trough component of the perturbation would be tracked accurately and the second component of the response would be large. If the internal gain of the system were low, or the trough of the stimulus caused the system to take on a low internal gain, then there would be a large decrease in eye velocity and again the second component of the response would be large even if the first component were small. Thus variation in the internal gain of pursuit could de-correlate the first and second components of the response to a peak-first perturbation.
Resolution of differences between human and monkey pursuit in prior studies
Our analysis indicates that the Das et al. (1995, 1998) experiments probably found similar responses to perturbations during pursuit and fixation because of several factors that combined to defeat on-line gain control. First, large perturbations up to ±19°/s were used, causing target velocity to decline to or below zero during the perturbations, possibly reducing the very gain of visual-motor transmission that was being probed. Second, the phase of the perturbations was peak-last, which our data show is a poor phase for demonstrating larger responses during pursuit than during fixation since it starts by driving eye velocity close to zero. Third, the use of large, slow perturbations might have reduced the difference between responses to pursuit perturbations, and fixation perturbations because online gain was modulated during both the pursuit and fixation tasks. In future studies, it will be important to use perturbations that are suitable for probing the on-line gain of pursuit without altering it. An additional advantage of using only small, brief perturbations is that it is possible to restrict analysis to trials without saccades. Large, slow perturbations, especially those presented in sequence cause even the best subjects to make saccades.
Our subjects’ responses to the conditions used by Das et al. (1995; 1998) remain puzzling in one way. Although we found, as they did, that pursuit and fixation responses were of similar size, the magnitudes reported here are somewhat lower than those reported in Das et al. (1995, 1998). Interestingly, our cycle-by-cycle analysis showed that the responses during both pursuit and fixation changed over the course of a trial: the peak-to-trough amplitude of the responses increased and the latency of the peak eye velocity decreased. The change in amplitude might reflect the use of several strategies and a difference in subjects’ capacity to employ each of these strategies may explain the differences in response magnitude between studies. 1) Multiple cycles of a 2.8-Hz sine wave may progressively engage pursuit mechanisms, leading to an increase in the on-line gain of pursuit even when the initial condition is fixation. 2) The saccadic and pursuit systems may be working in tandem to increase the gain of pursuit for large amplitude, 2.8-Hz perturbations: the large position errors meant that even our best subjects responded with a conjunction of saccades and pursuit, and saccades have an effect on the gain of pursuit (Lisberger 1998). 3) The change in latency confirms that predictive mechanisms may be responsible for part or all of the increase in response amplitude. The effect of predictive mechanisms on on-line gain might vary over the course of the trial. Specifically, predicting subsequent perturbations might cause a large enhancement early in the trial, but a lesser enhancement later as subjects predict the end of the trial.
Continuous, dynamic modulation of the on-line gain of pursuit
Our analysis suggests that the on-line gain of pursuit may be continuously updated as behavioral conditions change. Our finding of a difference in the degree of enhancement for peak-last and peak-first perturbations implies that a decrease in eye velocity of duration as short as 100 ms may be sufficient to alter on-line gain of pursuit. A more thorough exploration of the time course of on-line gain control would be particularly interesting, especially because there are now a number of demonstrations that on-line gain control can take several forms (e.g., Lisberger 1998; Churchland and Lisberger 2000; Schwartz and Lisberger 1994; ). Further, there is evidence that the output of neurons in the smooth eye movement portion of the frontal eye fields can modulate the gain of pursuit with a short latency and over a rapid time frame (Tanaka and Lisberger 2001, 2002). Thus our results go beyond simply demonstrating that the pursuit system of humans, like that of monkeys, contains a variable gain control that is modulated by behavioral state. The findings also suggest that the regulation of the internal gain of pursuit is a dynamic process that can adjust the performance of the motor system continuously in the face of changing stimuli in the real world.
Acknowledgments
S. G. Lisberger is an investigator of the Howard Hughes Medical Institute. Research was supported by the Howard Hughes Medical Institute and the National Science Foundation (A. K. Churchland).
Footnotes
The costs of publication of this article were defrayed in part by the payment of page charges. The article must therefore be hereby marked “advertisement” in accordance with 18 U.S.C. Section 1734 solely to indicate this fact.
We are indebted to S. Ruffner for developing the software used for stimulus presentation and data acquisition.
REFERENCES
- Barnes GR, Asselman PT. The mechanism of prediction in human smooth-pursuit eye movements. J Physiol (Lond) 1991;439:439–461. doi: 10.1113/jphysiol.1991.sp018675. [DOI] [PMC free article] [PubMed] [Google Scholar]
- Churchland M, Lisberger SG. Experimental and computational analysis of monkey smooth-pursuit eye movement. J Neurophysiol. 2001;86:741–759. doi: 10.1152/jn.2001.86.2.741. [DOI] [PubMed] [Google Scholar]
- Dallos PJ, Jones RW. Learning behavior of the eye fixation control system. IEEE Trans AC. 1963;8:218–227. [Google Scholar]
- Das V, Discenna AO, Feltz A, Yaniglos S, Leigh JR. Tests of a linear model of visual-vestibular interaction using the technique of parameter estimation. Biol Cybern. 1998;78:183–195. doi: 10.1007/s004220050425. [DOI] [PubMed] [Google Scholar]
- Das V, Leigh JR, Thomas CW, Averbuch-Heller L, Zivotofsky AZ, Discenna AO, Dell-Osso LF. Modulation of high-frequency vestibuloocular reflex during visual tracking in humans. J Neurophysiol. 1995;74:624–632. doi: 10.1152/jn.1995.74.2.624. [DOI] [PubMed] [Google Scholar]
- Goldreich D, Krauzlis RJ, Lisberger SG. Effect of changing feedback delay on spontaneous oscillations in smooth-pursuit eye movements of monkeys. J Neurophysiol. 1992;67:625–638. doi: 10.1152/jn.1992.67.3.625. [DOI] [PubMed] [Google Scholar]
- Keller EL, Heinen SJ. Generation of smooth-pursuit eye movements: neuronal mechanisms and pathways. Neurosci Res. 1991;11:79–107. doi: 10.1016/0168-0102(91)90048-4. [DOI] [PubMed] [Google Scholar]
- Krauzlis RJ, Lisberger SG. A model of visually guided smooth-pursuit eye movements based on behavioral observations. J Comp Neurosci. 1994;1:265–283. doi: 10.1007/BF00961876. [DOI] [PubMed] [Google Scholar]
- Lisberger SG. Postsaccadic enhancement of initiation of smooth-pursuit eye movements in monkeys. J Neurophysiol. 1998;79:1918–1930. doi: 10.1152/jn.1998.79.4.1918. [DOI] [PubMed] [Google Scholar]
- Lisberger SG, Evinger C, Johanson GW, Fuchs AF. Relationship between eye acceleration and retinal image velocity during foveal smooth pursuit in man and monkey. J Neurophysiol. 1981;46:229–249. doi: 10.1152/jn.1981.46.2.229. [DOI] [PubMed] [Google Scholar]
- Lisberger SG, Morris EJ, Tychsen LT. Visual motion processing and sensory-motor integration for smooth-pursuit eye movements. Annu Rev Neurosci. 1987;10:97–129. doi: 10.1146/annurev.ne.10.030187.000525. [DOI] [PubMed] [Google Scholar]
- Lisberger SG, Westbrook LE. Properties of visual inputs that initiate horizontal smooth-pursuit eye movements in monkeys. J Neurosci. 1985;5:1662–1673. doi: 10.1523/JNEUROSCI.05-06-01662.1985. [DOI] [PMC free article] [PubMed] [Google Scholar]
- Luebke AE, Robinson DA. Transition dynamics between pursuit and fixation suggest different systems. Vision Res. 1988;28:941–946. doi: 10.1016/0042-6989(88)90103-4. [DOI] [PubMed] [Google Scholar]
- Robinson DA. The mechanics of human smooth-pursuit eye movement. J Physiol (Lond) 1965;180:569–591. doi: 10.1113/jphysiol.1965.sp007718. [DOI] [PMC free article] [PubMed] [Google Scholar]
- Schwartz JD, Lisberger SG. Initial tracking conditions modulate the gain of visuo-motor transmission for smooth-pursuit eye movements in monkeys. Vis Neurosci. 1994;11:411–424. doi: 10.1017/s0952523800002352. [DOI] [PubMed] [Google Scholar]
- Tanaka M, Lisberger SG. Context-dependent smooth eye movements evoked by stationary visual stimuli in trained monkeys. J Neurophysiol. 2000;84:1748–1762. doi: 10.1152/jn.2000.84.4.1748. [DOI] [PMC free article] [PubMed] [Google Scholar]
- Tanaka M, Lisberger SG. Regulation of the gain of visually guided smooth-pursuit eye movements by frontal cortex. Nature. 2001;409:191–194. doi: 10.1038/35051582. [DOI] [PubMed] [Google Scholar]
- Tychsen L, Lisberger SG. Visual motion processing for the initiation of smooth-pursuit eye movements in humans. J Neurophysiol. 1986;56:953–968. doi: 10.1152/jn.1986.56.4.953. [DOI] [PubMed] [Google Scholar]