

Abstract
Glycosylphosphatidylinositol-anchored high-density lipoprotein-binding protein 1 (GPIHBP1), a protein in the lymphocyte antigen 6 (Ly-6) family, plays a key role in the lipolytic processing of triglyceride-rich lipoproteins. GPIHBP1 binds lipoprotein lipase and chylomicrons and is expressed along the luminal surface of microvascular endothelial cells. Lipolysis is known to be regulated by metabolic factors and is controlled at multiple levels, including the number of LPL binding sites on capillaries. Here, we tested the possibility that GPIHBP1 expression could be regulated by dietary perturbations and by peroxisome proliferator-activated receptors (PPARs). Gpihbp1 transcript levels in the heart and in brown and white adipose tissue increased with fasting and returned toward baseline after refeeding. A PPARγ agonist increased Gpihbp1 expression in adipose tissue, heart, and skeletal muscle, whereas PPARα and PPARδ agonists had no effect. Gpihbp1 was expressed in endothelial cells of embryoid bodies generated from mouse embryonic stem cells, and Gpihbp1 expression in embryoid bodies was up-regulated by a PPARγ agonist. Sequences upstream from exon 1 of Gpihbp1 contain a strong PPAR binding site, and that site exhibited activity in a luciferase reporter assay. Gpihbp1 transcript levels in brown and white adipose tissue were lower in endothelial cell PPARγ knockout mice than in littermate control mice, suggesting that PPARγ regulates Gpihbp1 expression in vivo. We conclude that GPIHBP1 is regulated by dietary factors and by PPARγ.
GLYCOSYLPHOSPHATIDYLINOSITOL-ANCHORED high-density lipoprotein-binding protein 1 (GPIHBP1) (1), a newly recognized GPI-anchored protein of the lymphocyte antigen 6 (Ly-6) family, plays a critical role in the lipolytic processing of triglyceride-rich lipoproteins (1,2). The hydrolysis of lipoprotein triglycerides is carried out by lipoprotein lipase (LPL), an enzyme secreted by parenchymal cells of lipolytic tissues (e.g. myocytes of striated muscles and adipocytes of adipose tissue). After being secreted from cells, LPL is translocated into the lumen of the surrounding capillaries, where it hydrolyzes the core triglycerides of lipoprotein particles. Recent observations by Beigneux and colleagues (1,2) have suggested that GPIHBP1 could serve as a platform for lipolysis within capillaries. First, GPIHBP1 is expressed by endothelial cells of heart, skeletal muscle, and adipose tissue and is found largely or exclusively in the lumen of capillaries. Second, cell lines transfected with GPIHBP1 bind LPL and chylomicrons avidly. Third, chow-fed Gpihbp1-deficient mice (Gpihbp1−/−) exhibit chylomicronemia, with milky plasma and plasma triglyceride levels of 2000–5000 mg/dl.
Triglyceride hydrolysis by LPL is regulated at multiple levels (reviewed in Refs. 3 and 4). In the fed state, LPL is up-regulated in white adipose tissue and down-regulated in skeletal muscle and heart. During fasting, this pattern is reversed. Thus, in the setting of energy restriction, triglyceride-rich lipoproteins are processed in tissues that require oxidative fuel and not by adipose tissue (4). Some of this regulation is at the transcriptional level. The promoter of Lpl contains binding sites for peroxisome proliferator-activated receptors (PPARs), and LPL mRNA levels are known to be modulated, at least in part, by PPARs (3,5). In adipose tissue, PPARγ increases Lpl expression, whereas in liver, PPARα up-regulates Lpl (5).
Lipolysis also may be regulated by the number of LPL binding sites within capillaries. The binding of LPL to the microvascular endothelium of the heart is saturable, and the number of binding sites is higher during fasting and lower after refeeding (6).
GPIHBP1 is a newly recognized endothelial cell player in lipolysis. We reasoned that GPIHBP1, like LPL, might be regulated in response to metabolic conditions and that PPARs might be involved in its regulation. In the current study, we investigated changes in Gpihbp1 expression in response to diet, feeding status, and PPAR agonists.
RESULTS
Effects of Diet and Feeding Status on Gpihbp1 Expression Levels
To determine whether Gpihbp1 expression levels change in response to metabolic conditions, Gpihbp1 transcript levels were assessed in fed mice, mice that had been fasted for 16 h, and mice that had been refed for 6 h after a 16-h fast. Gpihbp1 expression levels in heart increased almost 2-fold after a fast but then returned to fed levels after refeeding (Fig. 1A). Interestingly, the pattern was similar in brown and white adipose tissue (Fig. 1, B and C). Fasting and refeeding had little effect on Gpihbp1 expression levels in the liver (Fig. 1D), a tissue that expresses very low levels of Gpihbp1 in the fed state. Lpl expression levels increased in heart and brown adipose tissue with fasting but did not fall significantly after refeeding (Fig. 1, A and C). Lpl expression levels fell with fasting in gonadal fat and liver (Fig. 1, B and D).
Figure 1.
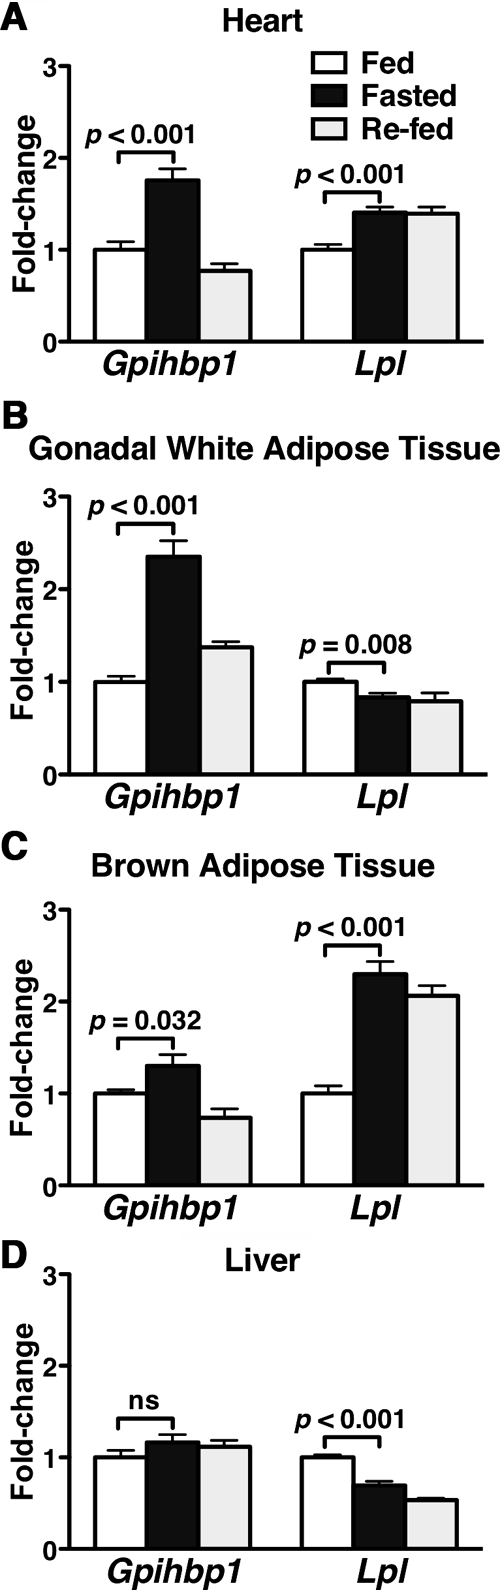
Regulation of Gpihbp1 and Lpl Expression by Fasting and Refeeding
RNA was isolated from fed mice, mice fasted for 16 h, and mice that had been fasted for 16 h and then refed a high-carbohydrate diet for 6 h (n = 10 male 10-wk-old C57BL/6 mice per group). Gpihbp1 and Lpl expression levels were measured by quantitative RT-PCR (mean ± se), and the data were normalized to β2-microglobulin expression. Bars show the amounts of Gpihbp1 and Lpl expression during fasting and refeeding, relative to those in fed mice, in heart (A), gonadal fat (B), brown adipose tissue (C), and liver (D).
A high-fat diet changed Gpihbp1 expression levels in some tissues. It increased Gpihbp1 expression levels significantly in white adipose tissue, skeletal muscle, and liver (Fig. 2A), whereas Gpihbp1 expression levels were similar on chow and high-fat diets in heart and brown adipose tissue (Fig. 2A). As expected, a high-fat diet increased Lpl expression levels only in liver (Fig. 2B).
Figure 2.
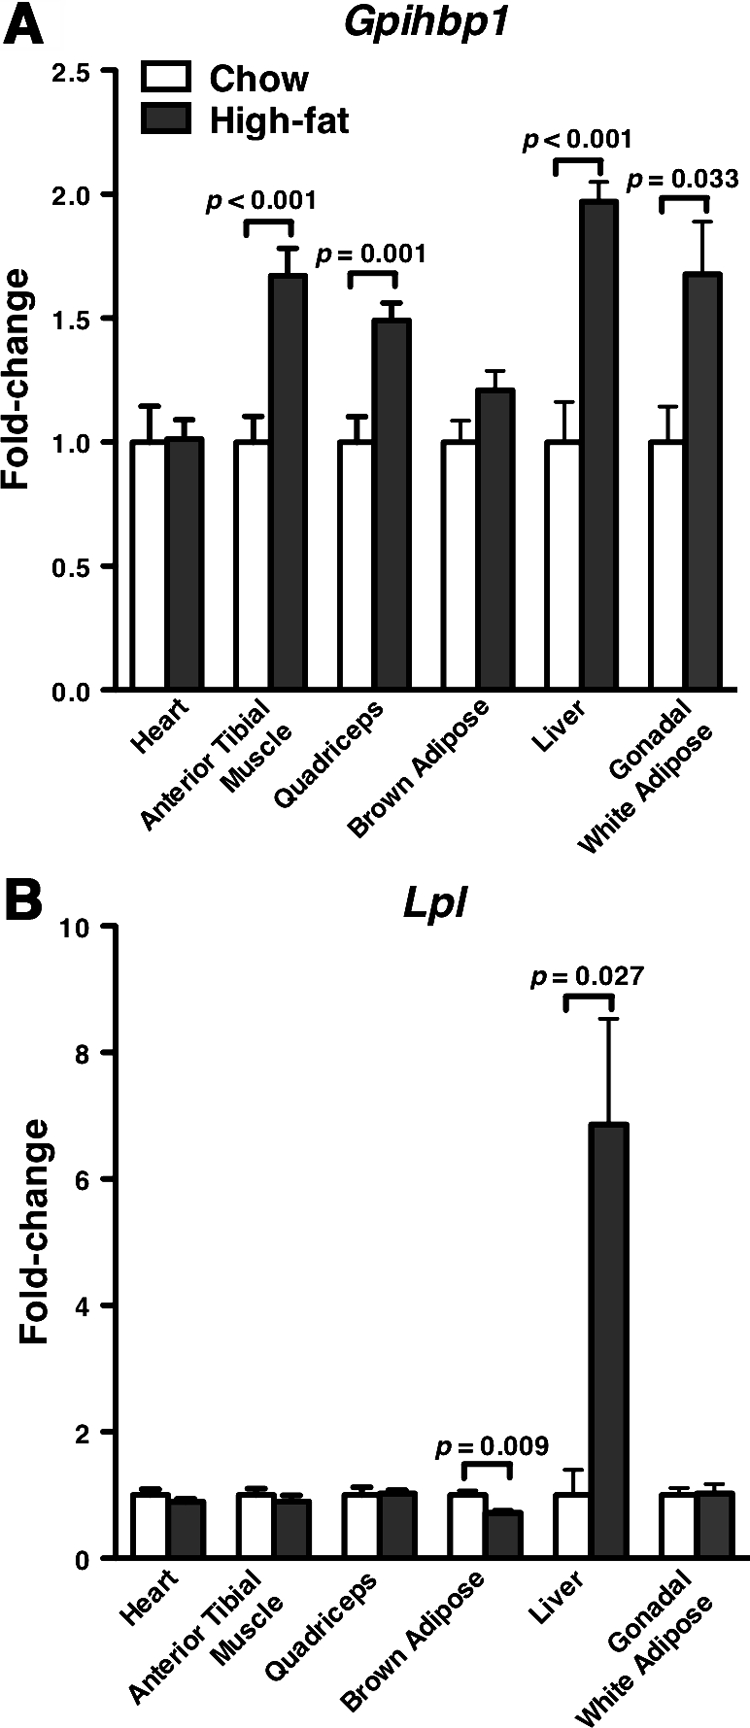
Gpihbp1 and Lpl Expression in Mice on a High-Fat Diet
RNA samples from various tissues were isolated from 11- to 12-month-old male mice fed chow (n = 7) or high-fat (n = 9) diets for 6 months. Gpihbp1 (A) and Lpl (B) expression on chow and high-fat diets were measured by quantitative RT-PCR and normalized to 36B4 expression. Bar graphs show expression levels on the high-diet relative to levels on the chow diet (mean ± se).
Identification of a Potential Peroxisome Proliferator Response Element (PPRE) in the Gpihbp1 Promoter
Because PPARs are known to play a key role in energy utilization and triglyceride metabolism (7,8,9), we hypothesized that the PPARs could play a role in regulating Gpihbp1 expression. We identified eight potential PPREs (binding sites for PPARs) upstream of exon 1 of Gpihbp1 (Fig. 3A). All were tested in EMSAs for their ability to compete with a well-characterized ap2 PPRE (10) for binding to PPARγ/retinoid X receptor-α (RXRα) heterodimers (Fig. 3B). Mobility shift assays were also used to examine the ability of radiolabeled Gpihbp1 PPREs to bind directly to PPARγ/RXRα heterodimers (Fig. 3C). Gpihbp1 PPRE 4, located 44 bp upstream from exon 1, was the most robust binding site, both in the competition assay and the direct-binding assay (Fig. 3, B and C). PPREs 1, 2, 3, and 7 were able to compete to some degree with the ap2 PPRE (Fig. 3B), but those PPREs bound PPARγ/RXRα heterodimers poorly or not at all in the direct-binding assay (Fig. 3C; data not shown).
Figure 3.

Identification of a PPRE Upstream of Exon 1 in Gpihbp1
A, Eight potential PPREs upstream of Gpihbp1 exon 1. Each potential PPRE, its distance from exon 1, and its orientation are listed. B, EMSA testing the ability of unlabeled potential PPREs from Gpihbp1 to compete with a well-characterized (10) 32P-labeled ap2 PPRE for binding to PPARγ/RXRα heterodimers. C, EMSA testing the ability of the indicated 32P-labeled Gpihbp1 PPRE to bind directly to PPARγ/RXRα heterodimers. D, Luciferase activity in HEK293T cells that had been transfected with a luciferase reporter construct containing zero, three, or six copies of the most proximal Gpihbp1 PPRE (PPRE 4) in the presence and absence of PPARγ/RXRα expression vectors (mean ± se). All cells were also transfected with a β-galactosidase expression vector, and luciferase activity was normalized to β-gal expression.
To examine the function of Gpihbp1 PPRE 4, we generated luciferase reporter constructs in which three or six copies of Gpihbp1 PPRE 4 were placed upstream of a minimal promoter. When expressed in HEK293T cells along with PPARγ and RXRα, the PPRE 4 reporter plasmids drove luciferase expression, whereas the control reporter lacking the PPRE did not (Fig. 3D).
Effects of PPAR Agonists on Gpihbp1 Expression
To test the ability of PPARs to modulate Gpihbp1 expression in vivo, we treated mice with PPARα, PPARδ, and PPARγ agonists and then measured Gpihbp1 expression levels in different tissues. After treating mice with the PPARγ agonist rosiglitazone, Gpihbp1 expression levels increased significantly in sc white adipose tissue (Fig. 4A), brown adipose tissue (Fig. 4B), heart (Fig. 4C), and skeletal muscle (Fig. 4D). The magnitude of the rosiglitazone-induced change in Gpihbp1 expression in sc white adipose tissue and brown adipose tissue was similar to that observed for ap2, a classic PPARγ-responsive gene in adipocytes (10). Likewise, the magnitude of the rosiglitazone-induced change in Gpihbp1 expression in skeletal muscle was similar to that observed for Cd36, another PPARγ-responsive gene (11). Equivalent results were obtained from white adipose tissue of mice treated with the PPARγ agonists troglitazone and GW7845 (data not shown). Gpihbp1 expression levels were unaffected by PPARδ and PPARα agonists (Fig. 4, A–E). Hepatic Gpihbp1 expression levels did not change in response to any of the PPAR agonists, although all three agonists increased hepatic Cd36 expression levels (Fig. 4E).
Figure 4.

Changes in Gpihbp1 Expression in Response to PPAR Agonists
Mice were treated with a PPARγ agonist (30 mg/kg rosiglitazone), a PPARα agonist (10 mg/kg GW7647), a PPARδ agonist (10 mg/kg GW742), or vehicle by oral gavage twice daily for 2 days (n = 10 per group). The expression of Gpihbp1 in different tissues was quantified by quantitative RT-PCR, and the data were normalized to 36B4 expression. Cd36, Ucp3, and ap2 expression levels were also measured. Bars show the amount of Gpihbp1 mRNA on different PPAR agonists (mean ± se), relative to those in vehicle-treated mice, for sc fat (A), brown adipose tissue (B), heart (C), muscle (quadriceps) (D), and liver (E).
GPIHBP1 is expressed exclusively in endothelial cells. We hoped to assess the effect of PPARγ agonists on Gpihbp1 expression in cultured endothelial cells. However, human umbilical vein endothelial cells (HUVECs) and rat heart microvascular endothelial cells did not express Gpihbp1, as judged by quantitative RT-PCR (data not shown). Cd31 was expressed highly in rat heart microvascular endothelial cells, but Gpihbp1 expression was virtually undetectable (<0.001% of levels in rat lung). Gpihbp1 expression in rat heart endothelial cells was not induced with a PPARγ agonist (even though these cells express PPARγ). Moreover, Gpihbp1 expression in primary cultured cells decreased rapidly within a single passage (supplemental Fig. S1, published as supplemental data on The Endocrine Society’s Journals Online web site at http://mend.endojournals.org).
Embryonic stem (ES) cells can readily be differentiated into embyroid bodies, which contain multiple cell types including cardiomyocytes and endothelial cells (12). We hypothesized that the endothelial cells within embryoid bodies might express GPIHBP1. Indeed, embryoid bodies express Gpihbp1, whereas undifferentiated mouse ES cells do not (Fig. 5A). Immunostaining of embryoid bodies revealed that GPIHBP1 was expressed exclusively within CD31-expressing endothelial cells (Fig. 5B). GPIHBP1 staining was observed in nonpermeabilized cells, consistent with its location on the cell surface (1).
Figure 5.

Gpihbp1 Expression in Embryoid Bodies and Differentiated ES Cells
A, Expression of Gpihbp1, as judged by quantitative RT-PCR, in mouse ES cells and embryoid bodies derived from ES cells. The data were normalized to 36B4 expression; shown are means ± se (n = 18). B, Epifluorescence microscopy showing the binding of a rat monoclonal antibody against mouse CD31 (red) and a rabbit antiserum against GPIHBP1 (green) to nonpermeabilized (non-perm.) embryoid bodies or embryoid bodies that had been permeabilized with Triton X-100. Images were taken with a ×40 objective. C and D, Gpihbp1 and Cd36 expression in mouse embryoid bodies (C) and differentiated mouse ES cells (D) that had been treated with 5 μm rosiglitazone or vehicle (dimethylsulfoxide) alone. Expression levels of Gpihbp1 and Cd36 were measured by quantitative RT-PCR (mean ± se; n = 4), and the data were normalized to the expression of 36B4. Bars show expression levels on rosiglitazone relative to those on vehicle alone.
Gpihbp1 expression in endothelial cells of embryoid bodies was up-regulated with a PPARγ agonist. Incubating embryoid bodies for 24 h with rosiglitazone significantly increased Gpihbp1 and Cd36 expression (Fig. 5C). Rosiglitazone had similar effects on mouse ES cells that had simply been grown for 2 wk in a medium that induced cell differentiation (Fig. 5D).
Gpihbp1 Expression in an Endothelial Cell PPARγ Knockout Mouse
GPIHBP1 is expressed in endothelial cells of heart, adipose tissue, and skeletal muscle (1). Our studies have shown that PPARγ agonists increase Gpihbp1 expression both in vivo and in vitro in embryoid bodies. Accordingly, we reasoned that Gpihbp1 expression might be lower in mice lacking PPARγ expression in endothelial cells. We therefore examined endothelial cell PPARγ knockout mice (13,14) for changes in Gpihbp1 expression. Gpihbp1 expression levels were tested in Ppargfl/flLdlr−/− Tie2cre mice and littermate Ppargfl/flLdlr−/− control mice. Gpihbp1 expression levels in brown adipose tissue, white adipose tissue, and heart were significantly lower in Ppargfl/flLdlr−/− Tie2cre mice than in littermate Ppargfl/flLdlr−/− control mice (Fig. 6, A–C). Gpihbp1 expression levels in skeletal muscle and liver were not significantly different (Fig. 6, D and E).
Figure 6.
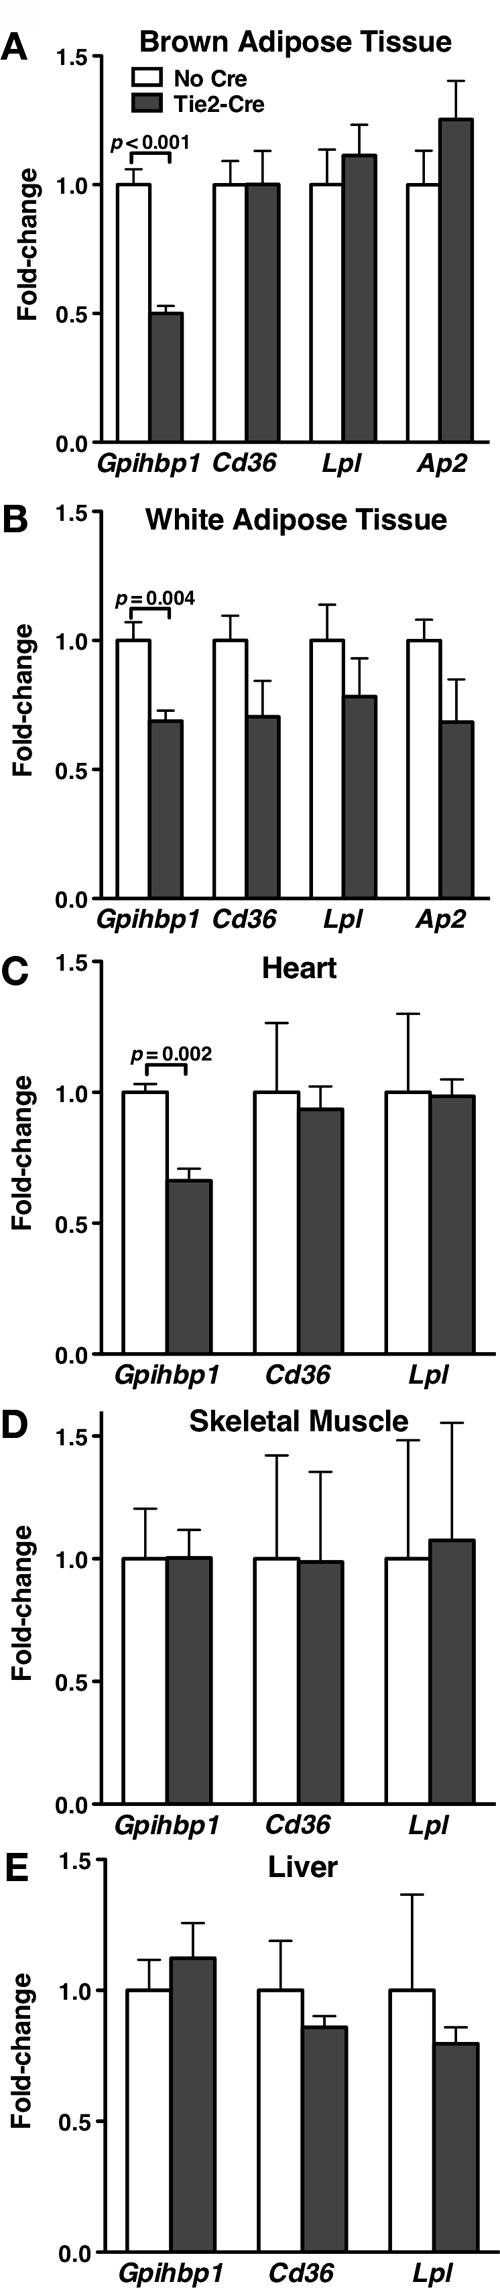
Gpihbp1 Expression in Mice Lacking Endothelial Cell Expression of PPARγ
Adipose tissue RNA was isolated from endothelial cell PPARγ knockout mice (Ppargfl/fl Tie2cre) and control mice (Ppargfl/fl) (n = 3 control and 6 knockout male 7-month-old mice; all mice were in a Ldlr−/− background), and the expression of Gpihbp1 was measured by quantitative RT-PCR (mean ± se). Expression of Cd36, Lpl, and ap2 were also measured. Gpihbp1 expression was normalized to Cd31 expression to account for possible differences in endothelial cell content. All other genes were normalized to β2-microglobulin expression. Bars show the level of different transcripts in brown adipose tissue (A), white adipose tissue (B), heart (C), muscle (D), and liver (E) of Ppargfl/fl Tie2cre mice, relative to those in Ppargfl/fl mice (mean ± se).
DISCUSSION
Hydrolysis of lipoprotein triglycerides is fundamentally important in metabolism, providing fuel to striated muscles and delivering lipids to adipose tissue for storage. LPL, the enzyme that catalyzes the hydrolysis of triglycerides within chylomicrons or very-low-density lipoproteins, acts at the luminal surface of capillaries, and its activity is regulated at multiple levels (3,4). In the current study, we show that GPIHBP1, the putative endothelial cell platform for lipolysis, is also subject to regulation. Gpihbp1 transcript levels in heart, brown adipose tissue, and white adipose tissue increase during fasting and return to normal with refeeding. A high-fat diet increases Gpihbp1 expression levels in white adipose tissue, skeletal muscle, and liver. We found that a PPARγ agonist, but not PPARα or PPARδ agonists, increases Gpihbp1 expression. Several potential PPAR binding sites, or PPREs, exist in the sequences upstream from Gpihbp1 exon 1; one of those bound PPARγ/RXRα heterodimers avidly and drove the expression of a luciferase reporter in a PPARγ-dependent fashion. Mice lacking Pparg expression in endothelial cells expressed lower levels of Gpihbp1 in heart and in both brown and white adipose tissue. Both the PPAR and the fasting/refeeding observations point to metabolic regulation of GPIHBP1.
The changes in Gpihbp1 expression with fasting differ from Lpl. Fasting increased Gpihbp1 expression levels in heart, brown adipose tissue, and white adipose tissue. In contrast, fasting increased Lpl expression in heart and brown adipose tissue but lowered Lpl expression in white adipose tissue. In the case of Lpl, the altered expression levels with fasting make sense, because they would divert fuel away from storage during periods of energy deprivation and enhance fuel delivery to vital tissues such as heart. We do not understand the physiological rationale for increased Gpihbp1 expression in adipose tissue during fasting. It appears that all Gpihbp1-expressing endothelial cells, regardless of tissue, increase Gpihbp1 expression in response to a fast. Nature’s response to fasting may be to ensure high levels of Gpihbp1 expression in all tissues and then to rely on differential expression of LPL to channel lipid nutrients to different tissues. Another possibility, of course, is that increased expression of Gpihbp1 in adipose tissue during fasting serves a second as-yet-undefined purpose unrelated to lipolysis.
The induction of Gpihbp1 expression upon fasting suggested that PPARα might be an important regulator of Gpihbp1, because PPARα mRNA levels increase with fasting and PPARα is known to play a critical role in energy management during fasting (9). However, when mice were treated with agonists for PPARα, PPARδ, and PPARγ, the expression of Gpihbp1 increased in response to a PPARγ agonist, but not a PPARα agonist. We cannot completely exclude PPARα as a regulator of Gpihbp1 because it is conceivable that a response would have occurred at a higher agonist concentration or under different metabolic conditions. However, it is noteworthy that the PPARα agonist that we used did increase the expression of the PPARα target Ucp3 (15) and hepatic Cd36 (16). Thus, the PPARα agonist was clearly active in vivo. The magnitude of the increase in Gpihbp1 expression in response to PPARγ agonist was impressive, equivalent to changes in the expression of the canonical PPARγ target ap2. It is important to note, however, that Gpihbp1 is expressed in endothelial cells, whereas ap2 is expressed in adipocytes (10). Given the rather striking effects of the PPARγ agonist on Gpibhp1 expression in vivo, we had hoped to further examine regulation of Gpihbp1 by PPARγ agonists in a cultured endothelial cell line. Unfortunately, we have not yet identified any endothelial cell line, including microvascular endothelial cells from heart, that express Gpihbp1. We did, however, identify robust expression of Gpihbp1 in endothelial cells of embryoid bodies (created by differentiating mouse ES cells). In the embryoid body system, a PPARγ agonist induced Gpihbp1 significantly, and the magnitude of the increase was similar to that observed in mouse tissues in vivo.
The responsiveness of Gpihbp1 expression to PPARγ agonist was consistent with our identification of several potential PPAR binding sites (PPREs) in the sequences upstream from Gpihbp1 coding sequences. One of these, located immediately upstream from exon 1, bound PPARγ/RXRα heterodimers in both competition and direct-binding assays and drove the expression of a luciferase reporter in a PPARγ-dependent manner. The latter studies were performed in HEK293T cells with a luciferase reporter containing a minimal promoter. We would have preferred to examine the importance of different PPREs in the context of the endogenous Gpihbp1 promoter. Unfortunately, the 5 kb of sequence upstream from exon 1 of Gpihbp1 are utterly devoid of promoter activity in HEK293T or HUVECs (data not shown). One possibility is that crucial promoter elements are located more distant from the structural gene, but another is that the transfected HEK293T and HUVECs lack the proper transcriptional machinery for Gpihbp1 expression. The latter possibility seems plausible, given that Gpihbp1 expression rapidly vanishes from microvascular endothelial cells in culture, even though those cells continue to express Pparg.
The experiments with mice lacking PPARγ in endothelial cells support a role for PPARγ in regulating Gpihbp1. When Pparg was inactivated in endothelial cells, Gpihbp1 expression was significantly lower in white adipose tissue, brown adipose tissue, and heart. It remains possible that the decrease in Gpihbp1 expression in the mice lacking PPARγ in endothelial cells is an indirect effect, because these mice also lack PPARγ in some hematopoietic cells (17). Nonetheless, together with the reporter studies and the in vivo and in vitro studies with PPARγ agonists, these observations strongly suggest that Gpihbp1 expression is controlled, at least in part, by PPARγ.
We emphasize that key questions remain regarding the control of Gpihbp1 expression. For example, we do not understand why Gpihbp1 is expressed at very low levels in the endothelial cells of brain but highly in the endothelial cells of heart and adipose tissue (1). We also do not understand the rapid disappearance of Gpihbp1 expression in endothelial cells when they are grown under standard cell culture conditions. Again, it seems possible that proper Gpihbp1 expression requires transcriptional machinery that is absent in many cell lines. Furthermore, it seems possible that the maintenance of the proper transcriptional machinery could require a metabolic signal from underlying parenchymal cells (i.e. myocytes and adipocytes). Future studies will focus on identifying all of the cis- and trans-acting factors required for Gpihbp1 expression in endothelial cells of lipolytic tissues.
MATERIALS AND METHODS
Mice
Mice were housed in a specific-pathogen-free barrier facility with a 12-h light, 12-h dark cycle. To study the effects of fasting and refeeding on gene expression, C57BL/6 mice were fed a chow diet (LabDiet, St. Louis, MO), fasted for 16 h, and then refed a high-carbohydrate diet (TD.88122; Harlan Teklad, Indianapolis, IN). To examine the effects of a high-fat diet on Gpihbp1 expression, mice with a mixed genetic background (>90% C57BL/6, <10% 129/Sv) were fed either a chow or western diet (Harlan Teklad TD.88137) for 6 months. To examine the effects of PPAR agonists, C56BL/6 mice were given 30 mg/kg rosiglitazone (Cayman Chemical, Ann Arbor, MI), 10 mg/kg GW7647 (Cayman Chemical), 10 mg/kg GW742 (GlaxoSmithKline, Research Triangle Park, NC, courtesy of Timothy Willson), or vehicle [2.6% methylcellulose (StemCell Technologies, Vancouver, British Columbia, Canada) diluted 1:5 in Iscove’s modified Dulbecco’s medium (GIBCO, Carlsbad, CA)] by oral gavage in the morning and evening for two consecutive days. Ppargfl/fl and Ppargfl/fl Tie2cre mice described previously (13,14) were crossed with low-density lipoprotein receptor-deficient (Ldlr−/−) C57BL/6 mice to generate Ppargfl/fl and Ppargfl/fl Tie2cre mice in a Ldlr−/− background.
Quantitative RT-PCR
Total RNA was prepared from mouse tissues with TRI Reagent (Sigma Chemical Co., St. Louis, MO), treated with deoxyribonuclease I (Ambion, Austin, TX), and reverse transcribed with oligo(dT), a mixture of random primers, and Superscript III (Invitrogen, Carlsbad, CA). For the quantitative RT-PCR studies, oligonucleotide primers were designed with the Primer 3 program (http://frodo.wi.mit.edu/cgi-bin/primer3/ primer3_www.cgi). Reactions were assessed by Data Analysis for Real-Time PCR (18) to document equivalent efficiencies between the target gene and the control gene (β2-microglobulin or 36B4). Quantitative PCR analyses were performed with 50 ng cDNA, 200 nm of each oligonucleotide primer, and 10 μl SYBR Green PCR Master Mix (QIAGEN, Valencia, CA). PCRs were performed in triplicate on a 7900 Fast Real-Time PCR System (Applied Biosystems, Foster City, CA). Gene expression levels were calculated with the comparative cycle threshold method.
Differentiation of Mouse ES Cells
Strain 129/OlaHsd mouse ES cells were differentiated into embryoid bodies using the hanging drop method (12). Approximately 500 ES cells in 20 μl differentiation medium (Glasgow MEM with 20% fetal bovine serum, 1× MEM nonessential amino acids, 2 mm l-glutamine, 1 mm sodium pyruvate, and 50 μm 2-mercaptoethanol) were plated in each well of a 96-well, V-bottom, polypropylene plate. The plate was flipped over and incubated upside down at 37 C in 5% CO2 for 3 d. After 3 d, the plate was flipped back over; 200 μl medium was added to each well, and the cells were incubated for an additional 4 d. At that time, embryoid bodies were transferred to gelatinized six-well plates (four to eight per well) or to gelatinized coverslips in 24-well plates (two to four per well) and incubated in differentiation medium for 2 wk, changing the medium every 4 d. To examine the impact of a PPARγ agonist on Gpihbp1 expression, the medium was replaced with fresh medium containing either rosiglitazone (5 μm) or vehicle (dimethylsulfoxide) alone. After 24 h, cells were harvested in TRI Reagent and analyzed by quantitative PCR.
Immunofluorescence Microscopy
To detect GPIHBP1 in embryoid bodies, embryoid bodies on coverslips were fixed in 3% paraformaldehyde, blocked with PBS containing 10% fetal bovine serum and 0.2% BSA, and incubated with a rabbit anti-GPIHBP1 antibody (Novus Biologicals, Littleton, CO) and a rat anti-CD31 monoclonal antibody (BD Pharmingen, San Diego, CA) diluted 1:500 and 1:50, respectively, in the blocking buffer. In some studies, the cells were permeabilized with 0.1% Triton X-100, making it possible to detect intracellular antigens. Bound antibodies were detected with FITC-conjugated donkey antirabbit IgG (1:200; Jackson ImmunoResearch, West Grove, PA) and an Alexa Fluor 568-coupled goat antirat IgG (1:800; Invitrogen). After washing, cell nuclei were stained with 4′,6-diamidino-2-phenylindole. Images of embryoid bodies were obtained with an Axiovert 200 MOT microscope (Zeiss, Oberkochen, Germany) with a 40× objective and processed with AxioVision 4.2 software (Zeiss).
EMSAs
Double-stranded oligonucleotides corresponding to putative PPAR binding sites upstream from exon 1 of Gpihbp1 (Table 1) were labeled with T4 polynucleotide kinase (New England Biolabs, Beverly, MA) and [32P]γ-ATP (NEN Life Science Products, Boston, MA). The labeled oligonucleotide was then purified from unincorporated [32P]γ-ATP with an Illustra microspin G-25 column (GE Healthcare, Piscataway, NJ).
Table 1.
Oligonucleotides for EMSA
| Sequence, 5′–3′ | |
|---|---|
| GPI-1 | |
| Forward | GATCCTGGAGAGGTTACAGGTCAGAGCAC |
| Reverse | GATCGTGCTCTGACCTGTAACCTCTCCAG |
| GPI-2 | |
| Forward | GATCATACTCAGGTCAGAGTTGAGGGGAG |
| Reverse | GATCCTCCCCTCAACTCTGACCTGAGTAT |
| GPI-3 | |
| Forward | GATCATTTGAGGGTCACAGGCCAGGCACC |
| Reverse | GATCGGTGCCTGGCCTGTGACCCTCAAAT |
| GPI-4 | |
| Forward | GATCGTAAGTGGGACATAGGACATTCCTG |
| Reverse | GATCCAGGAATGTCCTATGTCCCACTTAC |
| GPI-5 | |
| Forward | GATCAGCTACAGGCACCAGGCCAGGGACA |
| Reverse | GATCTGTCCCTGGCCTGGTGCCTGTAGCT |
| GPI-6 | |
| Forward | GATCCCTCCGGGGATAGAGAGGAAAGGGA |
| Reverse | GATCTCCCTTTCCTCTCTATCCCCGGAGG |
| GPI-7 | |
| Forward | GATCCCCACTGGCAGAAAGGTCTGTTTAG |
| Reverse | GATCCTAAACAGACCTTTCTGCCAGTGGG |
| GPI-8 | |
| Forward | GATCACAGCTAGCACAGAGGTCTGAGCCC |
| Reverse | GATCGGGCTCAGACCTCTGTGCTAGCTGT |
| AP2 | |
| Forward | GATCCTTACTGGATCAGAGTTCACA |
| Reverse | GATCTGTGAACTCTGATCCAGTAAG |
Underlined sequences indicate potential PPREs.
Murine PPARγ and human RXRα proteins were produced with the TNT T7 Quick Coupled Transcription/Translation System (Promega, Madison, WI). PPARγ, RXRα, and unlabeled oligonucleotides were mixed in binding buffer [20 mm HEPES (pH 7.6), 100 mm NaCl, 1 mm EDTA, 0.01% (vol/vol) Nonidet P-40, 5% (vol/vol) glycerol, 100 ng/μl poly(deoxyinosine-deoxycytosine) (Amersham Pharmacia Biotech, Piscataway, NJ)]. The labeled oligonucleotide (100,000 cpm) was then added and incubated at room temperature for 30 min. Protein-oligonucleotide complexes were resolved on nondenaturing 4% polyacrylamide gels at room temperature for 1.5 h. The gel was dried and exposed to x-ray film.
Luciferase Assays
To determine the functional properties of Gpihbp1 PPRE4, luciferase assays were performed with the pTK-Luc luciferase reporter containing the herpes virus thymidine kinase promoter (19). Constructs with zero, three, or six copies of Gpihbp1 PPRE 4 were created by annealing primers 5′-TATGGATCCAATGTCCTATGTCCCACTTACTGCAGGGAATGTCCTATGTCCCACTTACTGCAGGGAAT GTCCTATGTCCCACTTACTGCAGATCTTATA-3′ and 5′-ATAAGATCTGCAGTAAGTGGGACATAGGACATTCCCTGCAGTAAGTGGGACATAGGACATTCCCTGCA GTAAGTGGGACATAGGACATTGGATCCATAA-3′ (PPRE 4 shown in bold) and then digesting the product with BamHI and BglII. The digested product was cloned into the BamHI and BglII sites of pTK-Luc. HEK293T cells were plated in 48-well plates (1 × 10⁵ cells per well) in 200 μl DMEM (2% fetal bovine serum) without antibiotics. The next day, cells were cotransfected with pTK-Luc containing zero, three, or six copies of PPRE 4, pCMX-mPPARγ, pCMX-hRXRα, and pCMX-β-gal (19) with Lipofectamine 2000 (Invitrogen). After 48 h, cells were lysed in Cell Culture Lysis Reagent (Promega), and luciferase activity was measured with the Luciferase Assay System (Promega). Luciferase expression was normalized to β-galactosidase activity.
Supplementary Material
Footnotes
This work was supported by a Scientist Development Award from the American Heart Association, National Office (to A.P.B.), BayGenomics (HL66621 and HL66600), R01 HL66088 (to P.T.), R01 HL087228 (to S.G.Y.), and 1P01HL090553–01A1 (to S.G.Y.).
Disclosure Statement: The authors have nothing to disclose.
First Published Online September 11, 2008
Abbreviations: ES, Embryonic stem; GPIHBP1, glycosylphosphatidylinositol-anchored high-density lipoprotein-binding protein 1; LPL, lipoprotein lipase; Ly-6, lymphocyte antigen 6; PPAR, peroxisome proliferator-activated receptor; PPRE, peroxisome proliferator response element; RXRα, retinoid X receptor-α.
References
- Beigneux AP, Davies BS, Gin P, Weinstein MM, Farber E, Qiao X, Peale F, Bunting S, Walzem RL, Wong JS, Blaner WS, Ding ZM, Melford K, Wongsiriroj N, Shu X, de Sauvage F, Ryan RO, Fong LG, Bensadoun A, Young SG 2007 Glycosylphosphatidylinositol-anchored high-density lipoprotein-binding protein 1 plays a critical role in the lipolytic processing of chylomicrons. Cell Metab 5:279–291 [DOI] [PMC free article] [PubMed] [Google Scholar]
- Young SG, Davies BS, Fong LG, Gin P, Weinstein MM, Bensadoun A, Beigneux AP 2007 GPIHBP1: an endothelial cell molecule important for the lipolytic processing of chylomicrons. Curr Opin Lipidol 18:389–396 [DOI] [PMC free article] [PubMed] [Google Scholar]
- Goldberg IJ 1996 Lipoprotein lipase and lipolysis: central roles in lipoprotein metabolism and atherogenesis. J Lipid Res 37:693–707 [PubMed] [Google Scholar]
- Mead JR, Irvine SA, Ramji DP 2002 Lipoprotein lipase: structure, function, regulation, and role in disease. J Mol Med 80:753–769 [DOI] [PubMed] [Google Scholar]
- Schoonjans K, Peinado-Onsurbe J, Lefebvre AM, Heyman RA, Briggs M, Deeb S, Staels B, Auwerx J 1996 PPARα and PPARγ activators direct a distinct tissue-specific transcriptional response via a PPRE in the lipoprotein lipase gene. EMBO J 15:5336–5348 [PMC free article] [PubMed] [Google Scholar]
- Ruge T, Bergo M, Hultin M, Olivecrona G, Olivecrona T 2000 Nutritional regulation of binding sites for lipoprotein lipase in rat heart. Am J Physiol Endocrinol Metab 278:E211–E218 [DOI] [PubMed] [Google Scholar]
- Berger J, Moller DE 2002 The mechanisms of action of PPARs. Annu Rev Med 53:409–435 [DOI] [PubMed] [Google Scholar]
- Feige JN, Gelman L, Michalik L, Desvergne B, Wahli W 2006 From molecular action to physiological outputs: peroxisome proliferator-activated receptors are nuclear receptors at the crossroads of key cellular functions. Prog Lipid Res 45:120–159 [DOI] [PubMed] [Google Scholar]
- Kersten S, Seydoux J, Peters JM, Gonzalez FJ, Desvergne B, Wahli W 1999 Peroxisome proliferator-activated receptor α mediates the adaptive response to fasting. J Clin Invest 103:1489–1498 [DOI] [PMC free article] [PubMed] [Google Scholar]
- Tontonoz P, Hu E, Graves RA, Budavari AI, Spiegelman BM 1994 mPPARγ2: tissue-specific regulator of an adipocyte enhancer. Genes Dev 8:1224–1234 [DOI] [PubMed] [Google Scholar]
- Tontonoz P, Nagy L, Alvarez JG, Thomazy VA, Evans RM 1998 PPARγ promotes monocyte/macrophage differentiation and uptake of oxidized LDL. Cell 93:241–252 [DOI] [PubMed] [Google Scholar]
- Boheler KR 2003 ES cell differentiation to the cardiac lineage. Methods Enzymol 365:228–241 [DOI] [PubMed] [Google Scholar]
- He W, Barak Y, Hevener A, Olson P, Liao D, Le J, Nelson M, Ong E, Olefsky JM, Evans RM 2003 Adipose-specific peroxisome proliferator-activated receptor γ knockout causes insulin resistance in fat and liver but not in muscle. Proc Natl Acad Sci USA 100:15712–15717 [DOI] [PMC free article] [PubMed] [Google Scholar]
- Wan Y, Saghatelian A, Chong LW, Zhang CL, Cravatt BF, Evans RM 2007 Maternal PPARγ protects nursing neonates by suppressing the production of inflammatory milk. Genes Dev 21:1895–1908 [DOI] [PMC free article] [PubMed] [Google Scholar]
- Pedraza N, Solanes G, Iglesias R, Vazquez M, Giralt M, Villarroya F 2001 Differential regulation of expression of genes encoding uncoupling proteins 2 and 3 in brown adipose tissue during lactation in mice. Biochem J 355:105–111 [DOI] [PMC free article] [PubMed] [Google Scholar]
- Motojima K, Passilly P, Peters JM, Gonzalez FJ, Latruffe N 1998 Expression of putative fatty acid transporter genes are regulated by peroxisome proliferator-activated receptor α and γ activators in a tissue- and inducer-specific manner. J Biol Chem 273:16710–16714 [DOI] [PubMed] [Google Scholar]
- Wan Y, Chong LW, Evans RM 2007 PPAR-γ regulates osteoclastogenesis in mice. Nat Med 13:1496–1503 [DOI] [PubMed] [Google Scholar]
- Peirson SN, Butler JN, Foster RG 2003 Experimental validation of novel and conventional approaches to quantitative real-time PCR data analysis. Nucleic Acids Res 31:e73 [DOI] [PMC free article] [PubMed] [Google Scholar]
- Forman BM, Tontonoz P, Chen J, Brun RP, Spiegelman BM, Evans RM 1995 15-Deoxy-Δ12,14-prostaglandin J2 is a ligand for the adipocyte determination factor PPARγ. Cell 83:803–812 [DOI] [PubMed] [Google Scholar]
Associated Data
This section collects any data citations, data availability statements, or supplementary materials included in this article.