


Abstract
Investigation of biological processes using selective chemical interventions is generally applied in biomedical research and drug discovery. Many studies of this kind make use of gene expression experiments to explore cellular responses to chemical interventions. Recently, some research groups constructed libraries of chemical related expression profiles, and introduced similarity comparison into chemical induced transcriptome analysis. Resembling sequence similarity alignment, expression pattern comparison among chemical intervention related expression profiles provides a new way for chemical function prediction and chemical–gene relation investigation. However, existing methods place more emphasis on comparing profile patterns globally, which ignore noises and marginal effects. At the same time, though the whole information of expression profiles has been used, it is difficult to uncover the underlying mechanisms that lead to the functional similarity between two molecules. Here a new approach is presented to perform biological effects similarity comparison within small biologically meaningful gene categories. Regarding gene categories as units, a reduced similarity matrix is generated for measuring the biological distances between query and profiles in library and pointing out in which modules do chemical pairs resemble. Through the modularization of expression patterns, this method reduces experimental noises and marginal effects and directly correlates chemical molecules with gene function modules.
INTRODUCTION
Exploring the cellular responses to chemicals is practically meaningful in biomedical research and drug discovery. Microarray technology, due to its potential for monitoring genome-wide expression changes in response to chemical interventions, has applied to many endeavors in chemical biology research, including chemical toxicity investigation (1,2), chemical target discovery (3,4) and chemical regulated pathway identification (5).
Meanwhile some efforts have also been made to construct large-scale libraries of expression profiles corresponding to diverse chemical treatments. Hughes et al. (6) produced a library of expression profiles corresponding to diverse mutations and chemical treatments in Saccharomyces cerevisiae. They illustrated for the first time the utility of transcriptome data in identification as well as functional classification of unknown genes. In Fielden et al. (7) and Nie et al.'s (8) work, combining with results from 2-year rodent bioassay, microarray data of chemical treated rats was used to select gene biomarkers that distinguish carcinogenic chemicals from noncarcinogenic ones. Lamb et al. (9), on the other hand, established a searchable database of expression profiles corresponding to human cell lines treated with diverse chemical molecules. They devised a method for global expression pattern comparison, and constructed a searchable system, Connectivity Map, which survey the identities of biological effects of chemicals by performing profile similarity search. Ideas and systems related to Lamb's work have been used by many research groups and proved helpful in potential therapeutic agent discovery (10) and in identifying pathways regulated by small molecules (11).
Lamb et al. unprecedentedly introduced the concept of ‘similarity search’ into chemical related transcriptome analysis and emphasized global pattern comparison of gene expression profiles. Based on the holistic information of gene expression profiles, Lamb's method provided a new way to decipher the functional relationship among small chemical molecules even if they have different structures. However, it is not possible for researchers to see more deeply into the underlying biology, i.e. in which biological processes the given chemicals are involved in, and how do they result in analogs regulatory mechanisms. If we can shed light on these problems, we may have a chance to understand how the human body handles drugs and how side effects of a drug take place.
Based on those considerations and starting from Connectivity Map (9), we developed a new approach to perform functional similarity search for chemical molecules. To be different from global expression pattern comparison Lamb et al. used, we emphasized on comparing expression patterns in each gene module. The concept of ‘gene module’ here refers to a set of genes that act in concert to carry out a specific function (12). For example, a group of genes involves in cell cycle can be defined as a gene module that participates in cell cycle regulation. So far, many rules have been set from different perspectives to compile genes into biologically meaningful categories, like pathway information (13,14) or function annotations. Gene ontology (GO) (15), with its effort on developing structured vocabularies in describing and classifying gene products, is widely used in exploring biological features of genes with respect to molecular functions, biological processes as well as cellular components. It has also been proved useful in dealing with microarray data, including providing functional annotation of genes observed differentially expressed, gaining insight into the underlying biological mechanisms (16,17) and grouping microarray data according to the functions of the genes or biological processes they are involved in Ref. (18). Considering its advantages, we chose GO as the rule to group genes into units. Each genes unit is called a gene ontology module (GOM) representing a group of functionally associated genes. Instead of taking all genes’ expression pattern into account, we restricted our expression pattern comparison into every GOM. Regarding GOMs as units, a reduced similarity matrix was generated for measuring the biological distances between query profile and profiles in library and pointing out in which modules the chemical pairs resemble. Like Coarse-Graining Approaches (CGA) (19) in theoretical physics, our strategy smoothes over fine detail and extracts crucial elements from overwhelming information. Through the modularization of expression patterns, this method reduces experimental noises and marginal effects and directly correlates small chemical molecules with gene function modules. In our article some cases have been tested to show that our method is sensitive, and can provide reasonable results.
MATERIALS AND METHODS
Data source
Data in reference library was downloaded from Connectivity Map (build 01) (http://www.broad.mit.edu/cmap_build01/). It consists of 564 gene expression profiles corresponding to human cultured cell lines treated with 164 distinct chemical molecules representing a total of 453 instances. Each instance here denotes a treatment and vehicle pair.
Data preprocessing
Raw data were first normalized [RMA (20)] and log transformed. Each instance was then processed using the following three steps:
Step 1: Log ratio of treatment to vehicle (mean) was calculated for each probe;
Step 2: All probes were then mapped to the corresponding Entrez gene IDs using mean values;
Step 3: A rank ordered list of genes was obtained according to the extent of differential expression.
Discovering affected GOMs
Given a query profile, a hyper geometric test is performed for enrichment analysis of every GOM (in default, 2-fold change is used as a threshold to find differentially expressed genes). P-values are calculated to indicate if differentially expressed genes are enriched in certain GOMs. GOMs with P-value <0.01 are selected. Three basic GO (15) categories [BP (Biological Process), CC (Cellular Component) and MF (Molecular Function)] are provided for comparing GOMs with respect to different biological meanings.
Expression pattern comparison with reference instances
The expression pattern similarities of query and reference profiles in every GOM are calculated to generate a reduced similarity matrix with each column representing an expression profile corresponding to a chemical intervention in reference library and each row representing a GOM enriched in the query profile. The value in each grid of the matrix represents the similarity score between the query and a reference chemical in certain GOM. It is derived based on Kolmogorov–Smirnov statistics and was called connectivity score in Lamb et al.'s work (9), here we called it S score. After the calculation of S score, the P-value is calculated to indicate significance of the comparison. Instances with P-value <0.05 (in default) are regarded as having significantly similar (with S score >0) or reverse (with S score <0) pattern of expression with the query in this GOM. Finally, reference instances are ranked decreasingly according to the number of matched or reverse-matched (P-value <0.05) GOMs.
S score calculation
The similarity score is calculated by summarizing Kolmogorov–Smirnov (KS) scores for both over-expressed gene set and under-expressed gene set. We improved the method used in Connectivity Map to make it fit into expression pattern comparison for every single GOM. For each GOM, differentially expressed genes in this GOM are partitioned according to whether they are up- or down-regulated into two groups. KS scores for both up (KSup) and down (KSdown) regulated gene groups are calculated, respectively, using a nonparametric rank-based strategy based on Kolmogorov–Smirnov statistics, the procedure is as follows: let t be the number of genes in either the up- or down-regulated gene group and j denote the jth gene according to the rank of differential expression, assuming there are a total of N genes in array, and the position of the jth gene in the rank ordered whole gene list (also ranked according to the extent of differential expression) is V(j), then KSup/down is calculated as follows:
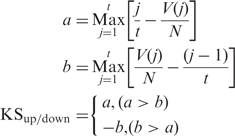 |
The KS score calculated using Kolmogorov–Smirnov statistics indicates the extent of similarity of the data distribution of two samples, when applied here it shows whether two profiles have the same pattern of expression. For each GOM, KSup and KSdown show, respectively, whether up- and down-regulated genes have the same or reverse pattern of expression between two chemicals. The similarity score (S) for each GOM is finally calculated by integrating KSup and KSdown that set S equaling 0 when KSup and KSdown have the same algebraic sign and equaling KSup – KSdown other wise. Array pair with positive similarity score in a certain GOM means they have similar pattern of expression in this GOM, and vice versa.
P-value calculation
In every run of expression pattern comparison random permutations of genome-wide (GO term based) gene rank is implemented in default 1000 times to calculate 1000 fake S scores and the percent of times that the absolute value of the fake S is larger than the absolute value of real S is the P-value for the real S score.
RESULTS
Gene expression modules-based similarity search
The idea of gene expression modules-based similarity search (GEMS2) is partitioning genes into functionally meaningful categories, forming a module-based Coarse-Graining expression pattern and then performing expression pattern comparison according to the differences within each category (Figure 1). It is composed of the following steps:
Figure 1.

Workflow of gene expression module-based similarity search. Workflow of expression function pattern similarity search: (A) A query profile is uploaded and GOMs significantly affected are found using hypergeometric test; (B) for each GOM found in the first step, expression pattern comparison is performed between the query and every reference instance to calculate for each GOM a S score and a P-value. Instances whose P-value is above the threshold (default is 0.05) are filtered out. Instances are arranged in descending order according to the number of matched (or reverse-matched) GOMs; (C) results are returned in both graphic and textual forms.
Step 1: Establish a library of gene expression profiles corresponding to different chemical interventions. Data from Connectivity Map (build 01) (http://www.broad.mit.edu/cmap_build01/) was used to evaluate our method.
Step 2: Given a query profile, discover significantly affected GOMs using hyper geometric test.
Step 3: Within each GOM, search against the library for profiles having analogous or reverse patterns of expression. A similarity matrix is constructed taking each GOM as a unit, and is summarized to measure the biological distances between query and profiles in library (for a detailed description, see the Materials and Methods section).
Web interface
Based on the GEMS2 method and algorithm, a free web-based service is available to perform online similarity search (http://www.biosino.org/GEMS2/).
Case one: searching for molecules having similar functions
We first demonstrate that our method is efficient in finding chemicals having similar functions. This case comes from a study (21) that investigated the effect of valproic acid (VPA) and all-trans-retinoic acid (ATRA) on acute myeloblastic leukemia cells, OCI/AML2. A total of four microarray assays were done in their experiments (data can be downloaded from the gene expression omnibus by ID GDS1215), one array was treated with VPA and another with vehicle. These two were analyzed using our method. After a similarity search, the top 10 chemicals with highest scores were presented (see Table 1). Among them, VPA itself appears three times. For the rest, trichostatin A, vorinostat–HC toxin, though structurally distant are all HDAC inhibitors. Data in the last column (Table 1) shows that these chemicals are almost fully positively correlated with the query, which is consistent with the fact that they perform a similar function. Besides, the cell line used in the query case is myeloblastic leukemia cells which did not exist in our reference library. It indicates that our method is to some extent cell line independent and can provide general functional similarity search among chemical interventions.
Table 1.
Top 10 reference instances found for profiles of VPA-treated cells
| cMap ID | Molecule | Dose | Cell line | GO counts |
|---|---|---|---|---|
| 1072 | Trichostatin A | 1 µM | MCF7 | 21(20+, 1−) |
| 410 | VPA [INN] | 10 mM | HL60 | 20(20+, 0−) |
| 1000 | Vorinostat | 10 µM | MCF7 | 20(20+, 0−) |
| 1050 | Trichostatin A | 100 nM | MCF7 | 20(20+, 0−) |
| 909 | HC toxin | 100 nM | MCF7 | 19(19+, 0−) |
| 989 | VPA [INN] | 1 mM | MCF7 | 19(19+, 0−) |
| 332 | Trichostatin A | 100 nM | MCF7 | 18(18+, 0−) |
| 1112 | Trichostatin A | 100 nM | MCF7 | 17(17+, 0−) |
| 866 | Ikarugamycin | 2 µM | MCF7 | 17(17+, 0−) |
| 409 | VPA [INN] | 1 mM | HL60 | 16(16+, 0−) |
The top 10 instances sharing the largest number of significantly affected GOMs with VPA-treated cells are listed here. For detailed parameter settings: BP is chosen as GO mode, the permutation time is set to be 1000, and the P-value for cutting off insignificantly matched or reverse-matched GO modules is 0.05. ‘plus’ indicates the number of GO terms positively correlated; ‘minus’ indicates the number of GO terms negatively correlated.
Case two: searching for molecules that mimic the cellular response to hypoxia
We then demonstrate our method is also capable of finding chemicals that mimic a certain biological state. This case derives from a work (22) that investigated the effect of hypoxia on ‘gene expression’ in MCF7 cell line. Six microarray assays in their experiments (three replicates for hypoxia treatment and normoxia treatment, respectively, GDS2758) were analyzed using our method. Search results are presented (Table 2). All top 10 agents show fully positively correlation with the query, and most of them (8 of 10) are reported to have a tight relationship with hypoxia. Among them deferoxamine appears for three times. Deferoxamine is a chelating agent capable of binding free iron in the bloodstream and removing excess iron from the body. It is usually used as an hypoxia mimic that simulates the hypoxic state by altering the iron status of hydroxylases (23). Dimethyloxalylglycine, a nonspecific inhibitor of 2-OG-dependent dioxygenase, is another hypoxia mimicking agent. Prochlorperazine, though the exact mechanism is unknown, is reported to have the effect of augmenting hypoxic responsiveness in humans (24). Colforsin has the ability of raising levels of cyclic AMP which leads to the increase of LDH activity. It can also mimic the effects of hypoxia with regard to the hypoxia-induced increase in LDH activity (25). This case demonstrates that our method is quite powerful for finding chemicals that cause or mimic a certain biological state.
Table 2.
Top 10 reference instances found for profiles of hypoxia treated cells
| cMap ID | Molecule | Dose | Cell line | GO counts |
|---|---|---|---|---|
| 573 | Deferoxamine [INN] | 100 μM | MCF7 | 57(57+, 0−) |
| 904 | 5109870 | 25 μM | MCF7 | 57(57+, 0−) |
| 584 | Dimethyloxalylglycine | 1 mM | PC3 | 52(52+, 0−) |
| 1010 | Thioridazine [INN] | 10 μM | MCF7 | 49(49+, 0−) |
| 460 | Deferoxamine [INN] | 100 μM | PC3 | 48(48+, 0−) |
| 1053 | Prochlorperazine [INN] | 10 μM | MCF7 | 46(46+, 0−) |
| 485 | Deferoxamine [INN] | 100 μM | MCF7 | 42(42+, 0−) |
| 977 | Wortmannin | 1 μM | MCF7 | 42(42+, 0−) |
| 1001 | Sirolimus [INN] | 100 nM | MCF7 | 40(40+, 0−) |
| 913 | Colforsin [INN] | 50 μM | MCF7 | 39(39+, 0−) |
The top 10 instances sharing the largest number of significantly affected GOMs with hypoxia treated cells are listed here. For detailed parameter settings: GO mode: BP; permutation time: 1000; P-value: <0.05.
But there are two exceptions in these similarity alignments. We know that wortmannin and sirolimus are PI3K and mTOR inhibitors, respectively. Both of them lead to the inhibition of hypoxia-inducible factor's activity (26,27), which supposed to have a reverse effect to hypoxia. But our data (Table 2) shows that cell lines treated by wortmannin and sirolimus have similar enriched GO pattern of expression compared with that of hypoxia treated cell lines. A possible explanation for this is that other mechanisms may exist which result in this kind of positive correlation.
Case three: searching for molecules that reverse the expression pattern of tumorigenic breast cancer cells
In this case we demonstrate that our method can also been used to find novel molecules reversing the effects of disease, which may provide useful information for therapeutics. This case is taken from a work (28) that analyzed expression changes in breast cancer cells having high tumorigenic capacity. Nine microarray assays (three normal and six tumorigenic, GDS2617) were analyzed using our method. Top 10 hits are presented (Table 3). Trichostatin A is histone deacetylase inhibitor, which has long been investigated as a potential antitumor agent against breast cancer (29,30). For the rest, genistein, resveratrol, metformin, novobiocin are also reported to have general antitumor effects (31–36). Data in the last column (Table 3) shows that the effects of all top 10 chemicals are negatively correlated with expression pattern of tumorigenic cells, which is consistent with their antitumor activities. One the other hand, most GOMs found here associated with top 10 chemicals are cell cycle related, which is consistent with the fact that most antitumor chemicals exert their effects directly or indirectly by influencing cell cycle-associated biological processes.
Table 3.
Top 10 reference instances found for profiles of tumorigenic breast cancer cells
| cMap ID | Molecule | Dose | Cell line | GO counts |
|---|---|---|---|---|
| 448 | Trichostatin A | 100 nM | PC3 | 27(6+, 21−) |
| 1015 | Genistein | 10 μM | MCF7 | 26(0+, 26−) |
| 841 | Resveratrol | 10 μM | MCF7 | 25(0+, 25−) |
| 486 | Calmidazolium | 5 μM | MCF7 | 24(0+, 24−) |
| 164 | Dexverapamil [INN] | 10 μM | MCF7 | 23(0+, 23−) |
| 2 | Metformin [INN] | 10 μM | MCF7 | 23(0+, 23−) |
| 965 | Felodipine [INN] | 10 μM | MCF7 | 20(0+, 20−) |
| 435 | Novobiocin [INN] | 100 μM | PC3 | 20(0+, 20−) |
| 381 | 17-allylamino-geldanamycin | 1 μM | MCF7 | 20(19+, 1−) |
| 383 | Cobalt chloride | 100 μM | MCF7 | 20(0+, 20−) |
The top 10 instances sharing the largest number of significantly affected GOMs with tumorigenic breast cancer cells. For detailed parameter settings: GO mode: BP; permutation time: 1000; P-value: <0.05.
Dependency of Connectivity Map on probe number and probe selection
The input of Connectivity Map search system is a small set of rank-ordered up- and down-regulated gene probes. There is no specific restriction for probe number or probe selection. Global similarity search using only a small fraction of genes may cause insufficient information usage, which may lead to instabilities of search result. Here we took the data already used (GDS1215: VPA treatment versus vehicle) to illustrate the problems that may arise when using Connectivity Map improperly. Table 4 shows both chemicals appears in top 10 and their ranks are highly diverse when randomly using top 10, 20 and 30 up- and down-regulated genes as signatures, respectively. This case indicates that in order to get reliable search results by using Connectivity Map, researchers should carefully select gene signatures and may need a step-by-step analysis to find a suitable probe dataset in order to gain a reliable output. On contrary to the Connectivity Map, our methodology groups genes into certain number of GOMs which are dependent only on the structure of GO, and performs a similarity search that is just based on the comparison of these GOMs. Therefore, by using our similarity search system it is no longer necessary to consider how to select gene signatures. Furthermore, as shown in case one our strategy is sensitive and can provide reasonable and reliable search results.
Table 4.
The result of Connectivity Map is highly dependent on probe number and probe selection
| 10 (instance ID/name) | 20 (instance ID/name) | 30 (instance ID/name) | |
|---|---|---|---|
| 1 | 450 (17-Allylamino-geldanamycin) | 607 (Butein) | 456 (Quinpirole) |
| 2 | 313 (NU-1025) | 456 (Quinpirole) | 267 (Genistein) |
| 3 | 311 (Monastrol) | 450 (17-Allylamino-geldanamycin) | 410 (Valproic acid) |
| 4 | 263 (Clofibrate) | 410 (VPA) | 703 (Genistein) |
| 5 | 606 (Thalidomide) | 317 (N-phenylanthranilic acid) | 1021 (Estradiol) |
| 6 | 611 (Geldanamycin) | 703 (Genistein) | 609 (5666823) |
| 7 | 868 (5182598) | 483 (Imatinib) | 332 (Trichostatin A) |
| 8 | 491 (Dopamine) | 413 (Trichostatin A) | 508 (Staurosporine) |
| 9 | 607 (Butein) | 1075 (Fluphenazine) | 371 (Rofecoxib) |
| 10 | 1075 (Fluphenazine) | 448 (Trichostatin A) | 389 (Wortmannin) |
Log ratios of VPA-treated versus vehicle-treated gene expression values are calculated. Probes are ranked according to the extent of differential expression. The top 10, 20 and 30 probes up- and down-regulated are picked up. Queries (10 up−10 down, 20 up−20 down, 30 up−30 down) are used to search against connectivity map, respectively. Top 10 instances positively correlated are presented in the table. (probeNum: indicates the number of up/down probes used).
DISCUSSION
Algorithms like GSEA (37) and sigPathway (38) have introduced the ‘gene set’ concept into expression profile analysis and are proved useful in explaining gene expression data. Here we brought this concept into chemical induced expression pattern similarity search, which involves partitioning genes into small biological categories and performing expression pattern comparison within each category.
The main focus of our method consists of two points: first, expression pattern comparison-based chemical function similarity search. Be different from traditional structure comparison that also emphasizes on similarity comparison, expression profile comparison is more straightforward because the rule ‘similar structure cause similar function’ does not always hold; second, we restricted the similarity comparison into every gene function module, which can not only tell the extent of overall similarity of two chemicals but also can provide information about in which function modules the two chemicals are similar. It can be seen as an improvement of Connectivity Map as it can provide more biological information of the chemicals.
The advantages of this module-based comparison strategy can be summarized in the following three points: first, module-based expression pattern comparison makes it possible to identify in which pathways or functional modules are two profiles similar. This is useful for deducing functions of unknown chemicals more precisely from those of well studied. Second, as shown in our case studies, module-based expression pattern comparison can help us to find chemicals which though structurally distant are functionally alike because they affect similar pathways or biological processes. This advantage will be helpful to detect main or side effects of chemicals or drugs. Third, in our methodology gene expression patterns are reduced into patterns of GOMs, which are depend only on the structure of GO and the similarity search performed is just based on the comparison of these GOMs. There is no longer necessary to consider how to select gene features as done when using Connectivity Map.
Starting from Connectivity Map, some significant improvements were made in our method. First, all of up- and down-regulated genes in the query profile are used to avoid result instability. Concerning the work of Lamb and his colleagues (9), the input of Connectivity Map can be a small set of probes up- and down-regulated. There is no specific rule to restrict probe number, and probe selection is also quite flexible largely depending on the individual researcher's judgment. This has the risk of insufficient information usage and the consequence is that different selection of probe sets may generate diverse and even conflicting outcomes as shown in the results part (Table 4). Because all up- and down-regulated genes (in default using the criteria of 2-fold change) were used to build patterns of GOMs, our method not only avoids insufficient information usage, but also provides a much more stable search result. Second, in Connectivity Map, only the relative similarity score is provided, which can only indicate whether two given chemicals are more similar than two other. There is no way to know to what extent and in which type of functional level two chemicals resemble or whether it is statistically significant. We make up this flaw by using random sampling method (see Materials and Methods section) to calculate a P-value for each GOM and give a reasonable evaluation score to chemical similarities.
Finally, although our method can be named as ‘similarity searching’ approach, it does not focus only on finding the most closely associated chemicals. When search for related profiles for a given chemical, chemicals ranked with higher scores only indicate that they share more GOMs than others ranked with lower scores. It is hard to say that the former is more relevant to the query than the latter, especially when two target chemicals have close ranks. One of the major purposes of our method is providing as much biological information as possible about unknown interventions, which overcomes the limitation that global comparison has.
So far, whole data from Connectivity Map (build 01) was used as a basic library for validating the rationality of our method. Persistent efforts will be made in adding data from other sources, including different disease states, other cell lines and organisms to upgrade and enlarge our data resource, as well as to continue expanding the system's applications. In this article, the GO system is applied as the rule to partition genes. But it does not mean that this rule is superior to others like pathway information, etc. The focus of our article is to propose a new method for expression pattern comparison that combining priori defined gene set information, and the selection of rules on how to partition genes is actually depend on the researchers needs. Till now, our server only provides GO system to define gene set, and we are trying to add more partitioning rules in the server and also considering adding an option for user to upload their user-defined gene sets.
In the case studies our method has shown its power in discovering chemicals sharing similar biological mechanisms and chemicals reversing disease states. Both sides are of great importance in biological and biomedical research, especially for deciphering potential regulatory mechanisms of small molecules on biochemical pathways. Our methodology is also quite useful to help researchers to discover candidate drugs or new usages of old drugs. Furthermore, it may shed light on some applications involved in applied medicine research, such as unknown toxin identification, side effects discovery or prediction and design of disease specific therapeutics.
FUNDING
863 Hi-Tech Program of China (863) (grant 2007AA02Z304, 2007AA02Z332, 2006AA02Z344, 2006AA02Z334, 2006AA020406); the Shanghai Committee of Science and Technology (grant 07dz22004); National Key Basic Research Program (973) (grant 2006CB910700, 2004CB720103, 2004CB518606, 2003CB715901); Research Program of CAS (grant KSCX2-YW-R-112). BMBF CHN07/38 (to H.-J.T.). Research supported by the listed fundings are open for public access.
Conflict of interest statement. None declared.
ACKNOWLEDGEMENTS
We would like to acknowledge Dr Minerva T. Garcia-Barrio for her critical reading of this manuscript.
REFERENCES
- 1.Wei Y, Liu Y, Wang J, Tao Y, Dai J. Toxicogenomic analysis of the hepatic effects of perfluorooctanoic acid on rare minnows (Gobiocypris rarus) Toxicol. Appl. Pharmacol. 2008;226:285–297. doi: 10.1016/j.taap.2007.09.023. [DOI] [PubMed] [Google Scholar]
- 2.Pogribny IP, Bagnyukova TV, Tryndyak VP, Muskhelishvili L, Rodriguez-Juarez R, Kovalchuk O, Han T, Fuscoe JC, Ross SA, Beland FA. Gene expression profiling reveals underlying molecular mechanisms of the early stages of tamoxifen-induced rat hepatocarcinogenesis. Toxicol. Appl. Pharmacol. 2007;225:61–69. doi: 10.1016/j.taap.2007.07.001. [DOI] [PubMed] [Google Scholar]
- 3.Rahman KW, Li Y, Wang Z, Sarkar SH, Sarkar FH. Gene expression profiling revealed survivin as a target of 3,3′-diindolylmethane-induced cell growth inhibition and apoptosis in breast cancer cells. Cancer Res. 2006;66:4952–4960. doi: 10.1158/0008-5472.CAN-05-3918. [DOI] [PubMed] [Google Scholar]
- 4.Lee SB, Cha KH, Selenge D, Solongo A, Nho CW. The chemopreventive effect of taxifolin is exerted through ARE-dependent gene regulation. Biol. Pharm. Bull. 2007;30:1074–1079. doi: 10.1248/bpb.30.1074. [DOI] [PubMed] [Google Scholar]
- 5.Wei D, Li M, Ding W. Effect of vanadate on gene expression of the insulin signaling pathway in skeletal muscle of streptozotocin-induced diabetic rats. J. Biol. Inorg. Chem. 2007;12:1265–1273. doi: 10.1007/s00775-007-0294-y. [DOI] [PubMed] [Google Scholar]
- 6.Hughes TR, Marton MJ, Jones AR, Roberts CJ, Stoughton R, Armour CD, Bennett HA, Coffey E, Dai H, He YD, et al. Functional discovery via a compendium of expression profiles. Cell. 2000;102:109–126. doi: 10.1016/s0092-8674(00)00015-5. [DOI] [PubMed] [Google Scholar]
- 7.Fielden MR, Brennan R, Gollub J. A gene expression biomarker provides early prediction and mechanistic assessment of hepatic tumor induction by nongenotoxic chemicals. Toxicol. Sci. 2007;99:90–100. doi: 10.1093/toxsci/kfm156. [DOI] [PubMed] [Google Scholar]
- 8.Nie AY, McMillian M, Parker JB, Leone A, Bryant S, Yieh L, Bittner A, Nelson J, Carmen A, Wan J, et al. Predictive toxicogenomics approaches reveal underlying molecular mechanisms of nongenotoxic carcinogenicity. Mol. Carcinog. 2006;45:914–933. doi: 10.1002/mc.20205. [DOI] [PubMed] [Google Scholar]
- 9.Lamb J, Crawford ED, Peck D, Modell JW, Blat IC, Wrobel MJ, Lerner J, Brunet JP, Subramanian A, Ross KN, et al. The Connectivity Map: using gene-expression signatures to connect small molecules, genes, and disease. Science. 2006;313:1929–1935. doi: 10.1126/science.1132939. [DOI] [PubMed] [Google Scholar]
- 10.Wei G, Twomey D, Lamb J, Schlis K, Agarwal J, Stam RW, Opferman JT, Sallan SE, den Boer ML, Pieters R, et al. Gene expression-based chemical genomics identifies rapamycin as a modulator of MCL1 and glucocorticoid resistance. Cancer Cell. 2006;10:331–342. doi: 10.1016/j.ccr.2006.09.006. [DOI] [PubMed] [Google Scholar]
- 11.Hieronymus H, Lamb J, Ross KN, Peng XP, Clement C, Rodina A, Nieto M, Du J, Stegmaier K, Raj SM, et al. Gene expression signature-based chemical genomic prediction identifies a novel class of HSP90 pathway modulators. Cancer Cell. 2006;10:321–330. doi: 10.1016/j.ccr.2006.09.005. [DOI] [PubMed] [Google Scholar]
- 12.Segal E, Friedman N, Koller D, Regev A. A module map showing conditional activity of expression modules in cancer. Nat. Genet. 2004;36:1090–1098. doi: 10.1038/ng1434. [DOI] [PubMed] [Google Scholar]
- 13.Kanehisa M, Goto S, Hattori M, Oki-Kinoshita KF, Itoh M, Kawashima S, Katayama T, Araki M, Hirakawa M. From genomics to chemical genomics: new developments in KEGG. Nucleic Acids Res. 2006;34:D354–D357. doi: 10.1093/nar/gkj102. [DOI] [PMC free article] [PubMed] [Google Scholar]
- 14.Krull M, Pistor S, Voss N, Kel A, Reuter I, Kronenberg D, Michael H, Schwarzer K, Potapov A, Choi C, et al. TRANSPATH: an information resource for storing and visualizing signaling pathways and their pathological aberrations. Nucleic Acids Res. 2006;34:D546–D551. doi: 10.1093/nar/gkj107. [DOI] [PMC free article] [PubMed] [Google Scholar]
- 15.Harris MA, Clark J, Ireland A, Lomax J, Ashburner M, Foulger R, Eilbeck K, Lewis S, Marshall B, Mungall C, et al. The Gene Ontology (GO) database and informatics resource. Nucleic Acids Res. 2004;32:D258–D261. doi: 10.1093/nar/gkh036. [DOI] [PMC free article] [PubMed] [Google Scholar]
- 16.Cunliffe HE, Ringner M, Bilke S, Walker RL, Cheung JM, Chen Y, Meltzer PS. The gene expression response of breast cancer to growth regulators: patterns and correlation with tumor expression profiles. Cancer Res. 2003;63:7158–7166. [PubMed] [Google Scholar]
- 17.van't Veer LJ, Dai H, van dV, He YD, Hart AA, Mao M, Peterse HL, van der KK, Marton MJ, Witteveen AT, et al. Gene expression profiling predicts clinical outcome of breast cancer. Nature. 2002;415:530–536. doi: 10.1038/415530a. [DOI] [PubMed] [Google Scholar]
- 18.Guo Z, Zhang T, Li X, Wang Q, Xu J, Yu H, Zhu J, Wang H, Wang C, Topol EJ, et al. Towards precise classification of cancers based on robust gene functional expression profiles. BMC Bioinform. 2005;6:58. doi: 10.1186/1471-2105-6-58. [DOI] [PMC free article] [PubMed] [Google Scholar]
- 19.Itzkoviz S, Levitt R, Kashtan N, Milo R, Itzkovitz M, Alon U. Coarse-graining and self-dissimilarity of complex networks. Phys. Rev. E. 2005;71:016127. doi: 10.1103/PhysRevE.71.016127. [DOI] [PubMed] [Google Scholar]
- 20.Irizarry RA, Bolstad BM, Collin F, Cope LM, Hobbs B, Speed TP. Summaries of Affymetrix GeneChip probe level data. Nucleic Acids Res. 2003;31:e15. doi: 10.1093/nar/gng015. [DOI] [PMC free article] [PubMed] [Google Scholar]
- 21.Trus MR, Yang L, Suarez SF, Bordeleau L, Jurisica I, Minden MD. The histone deacetylase inhibitor valproic acid alters sensitivity towards all trans retinoic acid in acute myeloblastic leukemia cells. Leukemia. 2005;19:1161–1168. doi: 10.1038/sj.leu.2403773. [DOI] [PubMed] [Google Scholar]
- 22.Elvidge GP, Glenny L, Appelhoff RJ, Ratcliffe PJ, Ragoussis J, Gleadle JM. Concordant regulation of gene expression by hypoxia and 2-oxoglutarate-dependent dioxygenase inhibition: the role of HIF-1alpha, HIF-2alpha, and other pathways. J. Biol. Chem. 2006;281:15215–15226. doi: 10.1074/jbc.M511408200. [DOI] [PubMed] [Google Scholar]
- 23.Vengellur A, Phillips JM, Hogenesch JB, LaPres JJ. Gene expression profiling of hypoxia signaling in human hepatocellular carcinoma cells. Physiol. Genomics. 2005;22:308–318. doi: 10.1152/physiolgenomics.00045.2004. [DOI] [PubMed] [Google Scholar]
- 24.Olson LG, Hensley MJ, Saunders NA. Augmentation of ventilatory response to asphyxia by prochlorperazine in humans. J. Appl. Physiol. 1982;53:637–643. doi: 10.1152/jappl.1982.53.3.637. [DOI] [PubMed] [Google Scholar]
- 25.Marti HH, Jung HH, Pfeilschifter J, Bauer C. Hypoxia and cobalt stimulate lactate dehydrogenase (LDH) activity in vascular smooth muscle cells. Pflugers Arch. 1994;429:216–222. doi: 10.1007/BF00374315. [DOI] [PubMed] [Google Scholar]
- 26.Carver DJ, Gaston B, Deronde K, Palmer LA. Akt-mediated activation of HIF-1 in pulmonary vascular endothelial cells by S-nitrosoglutathione. Am. J. Respir. Cell Mol. Biol. 2007;37:255–263. doi: 10.1165/rcmb.2006-0289SM. [DOI] [PMC free article] [PubMed] [Google Scholar]
- 27.Hudson CC, Liu M, Chiang GG, Otterness DM, Loomis DC, Kaper F, Giaccia AJ, Abraham RT. Regulation of hypoxia-inducible factor 1alpha expression and function by the mammalian target of rapamycin. Mol. Cell Biol. 2002;22:7004–7014. doi: 10.1128/MCB.22.20.7004-7014.2002. [DOI] [PMC free article] [PubMed] [Google Scholar]
- 28.Liu R, Wang X, Chen GY, Dalerba P, Gurney A, Hoey T, Sherlock G, Lewicki J, Shedden K, Clarke MF. The prognostic role of a gene signature from tumorigenic breast-cancer cells. N. Engl. J. Med. 2007;356:217–226. doi: 10.1056/NEJMoa063994. [DOI] [PubMed] [Google Scholar]
- 29.Vigushin DM, Ali S, Pace PE, Mirsaidi N, Ito K, Adcock I, Coombes RC. Trichostatin A is a histone deacetylase inhibitor with potent antitumor activity against breast cancer in vivo. Clin. Cancer Res. 2001;7:971–976. [PubMed] [Google Scholar]
- 30.Singh TR, Shankar S, Srivastava RK. HDAC inhibitors enhance the apoptosis-inducing potential of TRAIL in breast carcinoma. Oncogene. 2005;24:4609–4623. doi: 10.1038/sj.onc.1208585. [DOI] [PubMed] [Google Scholar]
- 31.Cappelletti V, Fioravanti L, Miodini P, Di FG. Genistein blocks breast cancer cells in the G(2)M phase of the cell cycle. J. Cell Biochem. 2000;79:594–600. [PubMed] [Google Scholar]
- 32.El-Mowafy AM, Alkhalaf M. Resveratrol activates adenylyl-cyclase in human breast cancer cells: a novel, estrogen receptor-independent cytostatic mechanism. Carcinogenesis. 2003;24:869–873. doi: 10.1093/carcin/bgg015. [DOI] [PubMed] [Google Scholar]
- 33.Pozo-Guisado E, Merino JM, Mulero-Navarro S, Lorenzo-Benayas MJ, Centeno F, varez-Barrientos A, Fernandez-Salguero PM. Resveratrol-induced apoptosis in MCF-7 human breast cancer cells involves a caspase-independent mechanism with downregulation of Bcl-2 and NF-kappaB. Int. J. Cancer. 2005;115:74–84. doi: 10.1002/ijc.20856. [DOI] [PubMed] [Google Scholar]
- 34.Dowling RJ, Zakikhani M, Fantus IG, Pollak M, Sonenberg N. Metformin inhibits mammalian target of rapamycin-dependent translation initiation in breast cancer cells. Cancer Res. 2007;67:10804–10812. doi: 10.1158/0008-5472.CAN-07-2310. [DOI] [PubMed] [Google Scholar]
- 35.Zakikhani M, Dowling R, Fantus IG, Sonenberg N, Pollak M. Metformin is an AMP kinase-dependent growth inhibitor for breast cancer cells. Cancer Res. 2006;66:10269–10273. doi: 10.1158/0008-5472.CAN-06-1500. [DOI] [PubMed] [Google Scholar]
- 36.Shiozawa K, Oka M, Soda H, Yoshikawa M, Ikegami Y, Tsurutani J, Nakatomi K, Nakamura Y, Doi S, Kitazaki T, et al. Reversal of breast cancer resistance protein (BCRP/ABCG2)-mediated drug resistance by novobiocin, a coumermycin antibiotic. Int. J. Cancer. 2004;108:146–151. doi: 10.1002/ijc.11528. [DOI] [PubMed] [Google Scholar]
- 37.Subramanian A, Tamayo P, Mootha VK, Mukherjee S, Ebert BL, Gillette MA, Paulovich A, Pomeroy SL, Golub TR, Lander ES, et al. Gene set enrichment analysis: a knowledge-based approach for interpreting genome-wide expression profiles. Proc. Natl Acad. Sci. USA. 2005;102:15545–15550. doi: 10.1073/pnas.0506580102. [DOI] [PMC free article] [PubMed] [Google Scholar]
- 38.Tian L, Greenberg SA, Kong SW, Altschuler J, Kohane IS, Park PJ. Discovering statistically significant pathways in expression profiling studies. Proc. Natl Acad. Sci. USA. 2005;102:13544–13549. doi: 10.1073/pnas.0506577102. [DOI] [PMC free article] [PubMed] [Google Scholar]