


Abstract
Gene trapping is used to introduce insertional mutations into genes of mouse embryonic stem cells (ESCs). It is performed with gene trap vectors that simultaneously mutate and report the expression of the endogenous gene at the site of insertion and provide a DNA tag for rapid identification of the disrupted gene. Gene traps have been employed worldwide to assemble libraries of mouse ESC lines harboring mutations in single genes, which can be used to make mutant mice. However, most of the employed gene trap vectors require gene expression for reporting a gene trap event and therefore genes that are poorly expressed may be under-represented in the existing libraries. To address this problem, we have developed a novel class of gene trap vectors that can induce gene expression at insertion sites, thereby bypassing the problem of intrinsic poor expression. We show here that the insertion of the osteopontin enhancer into several conventional gene trap vectors significantly increases the gene trapping efficiency in high-throughput screens and facilitates the recovery of poorly expressed genes.
INTRODUCTION
Gene trapping is a high-throughput approach that is used to introduce insertional mutations across the mouse genome. It is performed with gene trap vectors that simultaneously mutate and report the expression of the endogenous gene at the site of insertion and provide a DNA tag for the rapid identification of the disrupted gene. The generation of mutant mice from a comprehensive collection of mouse embryonic stem cell (ESC) lines harboring gene trap insertions in single genes can be applied to large-scale functional analysis of the ∼25 000 mammalian genes. As gene trap vectors insert randomly throughout the genome, a significant number of ESC mutations can be generated within a limited number of experiments (1).
The most widely used gene traps consist of a promoterless reporter and/or selectable marker gene flanked by an upstream splice acceptor (SA) site and a downstream polyadenylation sequence [poly(A)]. When inserted into an intron of an expressed gene, the gene traps are transcribed from an endogenous promoter, yielding fusion transcripts in which the upstream exons are spliced to the reporter/selectable marker gene. Since transcription is terminated prematurely at the inserted polyadenylation site, the processed fusion transcript encodes a truncated and nonfunctional version of the cellular protein plus the reporter/selectable marker, or—if the insertion is upstream of initiating methionines—just encodes the reporter selectable/marker. Gene traps have been used by both academic and commercial organizations to create libraries of mouse ES cell lines harboring mutations in single genes, which can be used to make mutant mice (2–4). Collectively, it has been estimated that the existing gene trap resources cover about 65% of all protein coding genes in the mouse genome (5). Since most of these resources employed gene trap vectors whose activation is dependent on gene expression, it is likely that the genes not yet covered by the resources are either not expressed or are expressed too weakly to trigger a productive gene trap event.
To address this problem, vectors have been developed for trapping genes independently of their expression. These vectors contain a reporter/selectable marker gene flanked by an upstream constitutive promoter and a downstream splice donor site. After inserting into an intron of any gene, the selectable marker is expressed from the exogenous promoter and spliced to the downstream exons of the trapped gene. By acquiring the endogenous poly(A) site, the resulting fusion transcript is stabilized and exported to the cytosol for further processing. Since capture of a poly(A) sequence is essential for this process, the vectors are referred to as–‘poly(A) traps’ (6,7).
However, due to a nonsense-mediated decay mechanism, fusion transcripts initiated upstream of the last exon junctions are degraded, imposing a strong bias toward insertions into the most 3′-introns, which are usually not highly mutagenic. This problem has been successfully addressed by inserting an internal ribosomal entry site downstream of the selectable marker gene, thereby effectively shifting the insertions toward the 5′-end of genes (8). A drawback of this shift, however, is that the inevitably larger fusion transcripts expressed from the exogenous promoter often include the entire coding sequence of the disrupted gene. Thus, unless this exogenous promoter is postinsertionally removed, many of the mutations induced by the ‘improved’ poly(A) traps will be neutralized by the expression of endogenous proteins that maintain residual function. Moreover, as has been recently reported, poly(A) traps preferentially integrate into expressed genes albeit to a lesser extent than the conventional gene trap vectors (9). This prompted us to test whether increasing gene expression would make more genes accessible to trapping. We show here that the insertion of the osteopontin enhancer into several conditional gene trap vectors significantly increases the gene trapping efficiency in high-throughput screens and facilitates the recovery of poorly expressed genes.
METHODS
Plasmids
pFlipRosaβgeo was assembled in pBabeSrf, a modified pBabepuro retroviral vector lacking the promoter and enhancer elements from the 3′LTR as previously described (10). For eFlipRosaβgeo, six Oct4 responsive elements from the osteopontin gene consisting of the annealed oligonucleotides 5′-GAT CCT GCA CTG ACC TTT CAG CTT TGT ATA ATG TAA GTT AAA ATC ACA TTT GAA ATG CAA ATG GAA AAG CA-3′ and 5′-GAT CTG CTT TTC CAT TTG CAT TTC AAA TGT GAT TTT AAC TTA CAT TAT ACA AAG CTG AAA GGT CAG TGC AG-3′ (11), were first assembled head to tail in the intermediate pEGFP–N1 (Clontech, Heidelberg; Genebank #U55762) using the BamHI/BglII sites in the polylinker. Subsequently the enhancer array was removed from pEGFP-N1 as a BamHI/BglII fragment and cloned into a BglII site located between the 5′ heterotypic frt/F3 sites of pFlipRosaβgeo. pFlipRosaβgeo* and eFlipRosaβgeo* were generated by PCR amplification of neo* from pD383 (12) and subsequent cloning of the amplified fragment into pFlipRosaβgeo and eFlipRosaβgeo via a SphI restriction sites.
The pCAGGS-FLPe expression plasmid was a gift from A. Francis Stewart (13). The pCAGGS-Cre expression plasmid was derived from pCAGGS-FLPe by replacing the FLPe cDNA with the Cre cDNA of pSG5Cre (14).
ES-cell cultures, infections and electroporations
The [C57BL/6J × 129S6/SvEvTac] F1 ES cell lines were grown on irradiated or mitomycin C-treated MEF feeder layers in the presence of 1000 U/ml of leukemia inhibitory factor (LIF) (EsgroR, Chemicon Intl., Hofheim, Germany), as previously described (4).
The E14Tg2a.4 [129P2] ES cell lines were grown without feeders on gelatinized dishes in the presence of 1500 U/ml of LIF.
Gene trap retrovirus was produced in Phoenix-Eco helper cells using the transient transfection strategy described previously (15). ESCs were infected with the virus containing supernatants at an M.O.I. <0.5 as previously described (4). Gene trap expressing ES-cell lines were selected in 130 µg/ml G418 (Invitrogen), manually picked, expanded and stored frozen in liquid nitrogen.
Electroporations were carried out at 240 V in 0.4-mm cuvettes using 1 × 10⁷ ESCs, 10 μg of plasmid DNA and a 500-mF capacitator (BioRad, Hercules, USA) as previously described (16). After incubating for 2 days in medium supplemented with 0.6 μg/ml puromycin (Sigma-Aldrich, München, Germany), the cells were trypsinized and seeded at low density (1000 cells/dish) onto 60-mm Petri dishes. Emerging clones were manually picked after 9 days and expanded.
Nucleic acids and protein analyses
PCRs were performed according to standard protocols using 300–500 ng of genomic DNA or 1 µg of reverse-transcribed total RNA in a total volume of 50 μl. The primer sequences used are available upon request. For high-throughput splinkerette PCR, genomic DNA isolation, restriction digests, ligation reactions and product purification were performed semiautomatically in 96- and 384-well microtiter plates using the MWG-Biotech RoboAmp4200 and the Beckman Coulter Biomek 2000 Robot machines as previously described (17). The primer sequences used are available upon request.
High-throughput, semiautomated 5′-RACE and sequencing were performed as previously described (4).
Real-time RT–PCR analysis of gene expression in ESCs was performed using SYBR green chemistry (ABgene, Epsom, UK) and an iCycler (Biorad) machine. cDNA was synthesized from total RNA using random priming and Superscript II (Invitrogen) reverse transcriptase. Gene-specific primers (20–22 mer) were designed to anneal to the exon upstream of the insertion site and to βgeo to amplify fusion transcript fragments between 100 and 250 nt (i.e. P046C04: 5′-CTT TCC CGG CTG CAA GAT G-3′; P047C11: 5′-CTT TCT ACC CGC GGT CTC C-3′; P048G9: 5′-CCT CCG TCA GCG ACC CAT G-3′; B32: 5′-CAA GGC GAT TAA GTT GGG TAA CG-3′). Gene-specific primers for the amplification of transcripts expressed by genes adjacent to insertion site were designed to anneal to two consecutive exons and are available on request. PCR reactions were run as triplicates on 96-well plates, with each reaction containing cDNA derived from 7.5 to 15 ng of total RNA, 5 pmol of each primer, and 1× ABsolute SYBR fluorescein mix (ABGene) in a 25-µl volume and normalized to simultaneously carried out PCRs for RNApolII (mmRPII s: 5′-ATG AGC TGG AAC GGG AAT TTG A-3′; mmRPII as: 5′-ACC ACT TTG ATG GGA TGC AGG T-3′). The temperature profile was 10 min at 94°C and then 40 cycles at 94°C for 15 s, 60°C for 30 s and 72°C for 30 s.
Western blots were performed as previously described (18), using anti-mouse Oct4 (Abcam, Cambridge, UK) and tubulin (Dianova, Hamburg, Germany) primary antibodies.
Chromatin immunoprecipitation (ChiP)
Immunoprecipitation of chromatin was performed as described by Riecke and Bielinsky (19). Briefly, ESCs were treated with 1% formaldehyde at room temperature for 15 min. The reaction was saturated by adding glycine to a final concentration of 125 mM. Cells were lysed and sonified. One milligram of whole-cell extract was subjected to immunoprecipitation using 3 µg of anti-Oct4 antibody (Abcam) or 3-µg anti-V5 antibody (Invitrogen) as a specificity control. Crosslinks were reversed and immunoprecipitated chromatin was purified using a GeneElute PCR kit (Sigma). The purified DNA was subjected to PCR using endogeous osteopontin and gene trap specific primers (osteopontin = P27 5-AAGATATCTTTGTTTCTTTCAGC-3′x P34: 5′-TATTTGTGTGCCTTTTCTACCTC-3′, gene trap = P29: 5′-ATCGATTCAAGCCACTATGC-3′x B032: 5′- CAAGGCGATTAAGTTGGGTAACG- 3′. PCR products were resolved on 1% agarose gels and visualized by ethidium bromide staining.
Gene trap sequence tag processing and annotation
Genomic sequence tags were processed as previously described (17). Similarity searches were performed in the ENSEMBL (v49.37) and NCBI mouse genome reference (build 37) databases using the BLASTN algorithm and an e-value <1e−6. Based on the genome coordinates obtained, tags were annotated to ENSEMBL protein coding and EST genes. Insertions into genomic regions without any annotation were considered intergenic. Insertions were considered ‘antisense’ when sequence tags mapped the noncoding (antisense) strand of annotated protein-coding or EST genes. Gene expression values for trapped ENSEMBL genes were derived from GEO series accession GSE8128 (9) (http://www.ncbi.nlm.nih.gov/geo/query/acc.cgi?acc=GSE8128).
For mapping antisense insertions to regions of naturally occurring antisense transcripts, we used the annotations assembled in the Natural Antisense Transcripts Database (NATsDB) (http://natsdb.cbi.pku.edu.cn/) (20).
RESULTS
Concept of enhanced gene trapping
The concept of enhanced gene trapping is based on the prediction that a transcriptional enhancer placed into an intron of a gene by means of a gene trap vector would activate the gene trap by inducing gene expression at the insertion site (Figure 1A). To test this, we inserted six copies of a modified enhancer derived from the first intron of the osteopontin gene into the previously reported conditional gene trap vector—FlipRosaβgeo—(10) (Figure 1B). Such an array of osteopontin enhancer elements (OPEs) has been shown to activate gene expression by up to 70-fold when introduced into undifferentiated ESCs along with a luciferase reporter (11). Since OPE activity is dependent on Oct4 transcription factor binding (11), most if not all of the OPE effects should be restricted to pluripotent ESCs in which Oct4 is differentially expressed.
Figure 1.

Graphic illustration of enhanced gene trapping. (A) Mechanism of enhanced gene trap activation. Insertion of the osteopontin enhancer (OPE) into an intron of a gene via a gene trap vector activates the endogenous promoter by binding the transcription factor Oct4. The induced promoter sets off the expression of the gene trap cassette, resulting in a productive gene trap event. (B) Enhanced conditional gene trap vector –‘eFlipRosaβgeo’. E, exon; OPE, osteopontin enhancer elements; SA, splice acceptor; pA, polyadenylation sequence; LTR, long terminal repeat; frt/F3, heterotypic FLPe recombinase target sequences; loxP/lox5171, heterotypic Cre recombinase target sequences; βgeo, β-galactosidase/neomycinposphotransferase fusion gene.
The OPE induces gene expression at insertions sites
To investigate whether the OPE induces the expression of trapped genes, we took advantage of the conditional features of the eFlipRosaβgeo vector (Figure 1B) whose SAβgeopA cassette can undergo directional inversions in the presence of FLPe and/or Cre site-specific recombinases. As has been previously reported, consecutive exposure of FlipRosaβgeo gene trap insertions to FLPe and Cre recombinases inverts the SAbgeopA cassette from coding to noncoding strands and back (10). Since the OPE is excised from eFlipRosaβgeo during the FLPe inversion, a subsequent re-inversion induced by Cre provides an enhancerless variant of the original gene trap allele (Figure 2A, Supplementary Figure 1). Assuming that the OPE induces gene expression, we expected the enhancerless allele to express less βgeo. To test this, we cotransfected three eFlipRosaβgeo lines derived from a gene trap screen (see below) with FLPe and Cre expression plasmids and isolated re-inverted subclones with enhancerless alleles (Figure 2A). Quantification of βgeo transcripts by qRT-PCR consistently revealed a decreased βgeo expression from the enhancerless alleles (Figure 2B). To ensure that this effect was caused by the loss of the enhancer rather than by a decrease of Oct4 expression, we estimated the levels of Oct4 in the trapped ESC lines before and after recombination. Figure 2B shows that Oct4 levels were stable, strongly suggesting that the loss of the enhancer is directly responsible for the reduced βgeo transcribed from the recombined gene trap alleles.
Figure 2.

Induction of gene expression by the osteopontin enhancer (OPE). (A) Top: Schematic representation of the trapped allele before (with enhancer) and after (without enhancer) FLPe- and Cre-mediated recombination. Positions of primers used for the allele specific PCRs are indicated by arrows. Bottom: Allele specific PCR products resolved on 1% agarose gel stained with ethidium bromide. (B) Top: Quantitative RT-PCR analysis of fusion transcripts using gene- and βgeo-specific primers. Results represent the mean relative expression levels ± SD from three separate experiments. Bottom: Oct4 expression in the trapped and recombined ESC lines. Total protein lysates from ESC lines were subjected to SDS–PAGE and analyzed by western blotting using anti-mouse Oct4 and tubulin antibodies. Note that Oct4 expression does not significantly change in the recombined subclones, indicating that the cells are still undifferentiated.
To confirm these findings on a larger scale, we analyzed a set of 645 eFlipRosaβgeo and 983 FlipRosaβgeo gene trap clones for which the genomic splinkerette adaptor (SPLK) PCR was used along with 5′-RACE for gene identification. Unlike SPLK tags obtained directly from the genomic integration sites, RACE tags are derived from fusion transcripts and, therefore, their retrieval is entirely dependent on gene expression (17). Consequently, the RACE success rate should improve by elevating gene expression. Indeed, eFlipRosaβgeo increased the RACE success rate by 15%, clearly reflecting the OPE's positive effect on gene expression (Figure 3). Moreover, 95% of the RACE products revealed correct splicing between upstream exons and the gene trap cassette, indicating that the OPE does not interfere with conventional gene trap reporting.
Figure 3.
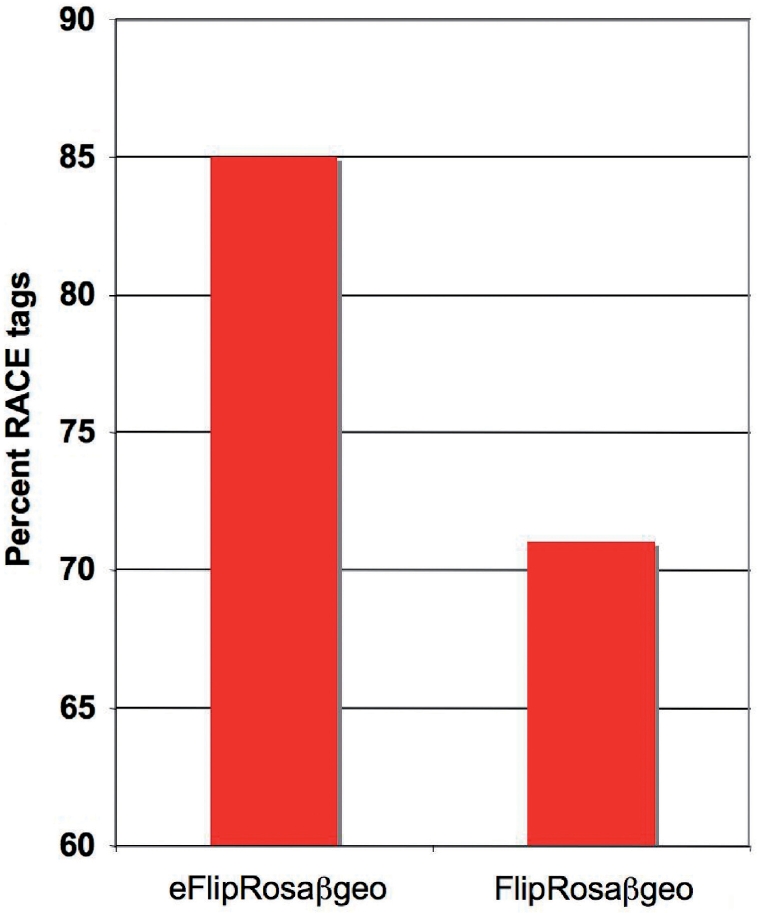
5′-RACE efficiency in trapped ESC lines. The fraction of trapped ESC cell lines for which both SPLK-tag and a RACE tag were obtained is shown for 645 eFlipRosaβgeo and 983 FlipRosaβgeo insertions.
The OPE binds Oct4 at gene trap insertion sites
To test whether the Oct4 transcription factor actually binds to the ectopic OPEs, we subjected the eFlipRosaβgeo trapped cell line P048G09 and its enhancer deleted progeny clone P048G09-G1 to ChiP with an anti-Oct4 antibody. As expected, the antibody precipitated OPE containing fragments from the endogenous osteopontin gene (Figure 4). However, the antibody also precipitated OPE containing fragments from the P048G09- but not P048G09-G1 gene trap insertion site, indicating that Oct4 physically associates with the gene trap's OPE (Figure 4).
Figure 4.

Oct4 binding by the OPE in trapped ESCs. Chromatin immunoprecipitation was performed as described in the Methods section using anti-Oct4 and anti-V5 antibodies. PCRs of the precipitated and purified DNAs were performed with osteopontin gene- and gene-trap-specific primers. P048G09, parental clone with enhancer; P048G09 G1, recombined subclone without enhancer; MW, molecular weight standard (1 kb plus ladder, Invitrogen).
eFlipRosaβgeo is highly mutagenic and does not affect gene expression in the vicinity of insertion sites
As expected from the reported preference of retroviral integrations near the 5′-end of genes, and from the observations made in previous trapping screens, the majority of both FlipRosaβgeo and eFlipRosaβgeo insertions occurred into the first or second intron of a gene, suggesting that the OPE does not affect the usually highly mutagenic 5′-end insertion bias intrinsic to retroviruses (Supplementary Figure 2).
To directly test the quality of the eFlipRosaβgeo-induced mutations, we selected three ESC lines with insertions in X-chromosomal genes (Supplementary Table 1). As the parental ESC line is male derived, these cell lines provided a haploid background for the mutational analysis. As expected, all genes were expressed in ESCs and trapped cell lines expressed a fusion transcript as a result of splicing the upstream exons to the gene trap cassette (Figure 5A). Quantitative RT-PCR analysis revealed that in each of these cell lines the endogenous transcripts were reduced below 1.2% of wild-type levels, which is equivalent to a null mutation (Figure 5B).
Figure 5.

Transcriptional analysis of X-linked mutations in eFlipRosaβgeo trapped ESC lines (also see Supplementary Table 1). (A) Top: RT-PCR products obtained from fusion transcripts expressed in the trapped ESC lines resolved on a 1% agarose gel stained with ethidium bromide. Amplification reactions were performed using trapped gene- and βgeo- specific primers. The double bands in lane 1 correspond to alternative N-terminal splice variants of the ATRX gene. Bottom: RT-PCR products obtained from wild-type transcripts expressed in trapped and parental E14-ESCs resolved on a 1% agarose gel stained with ethidium bromide. Gene-specific primers were chosen in exons flanking the intron containing the insertion. Note the complete absence of detectable wild-type transcripts in the trapped ESC clones. (B) Quantitative RT-PCR of the wild-type transcripts shown in A. Results are derived from triplicate reactions and were normalized to corresponding gene expression levels in E14 parental cells (=100%).
To investigate whether the OPE would affect genes upstream or downstream of the insertion sites, we quantified the transcriptional activity for several of these genes in the presence or absence of the OPE (Supplementary Table 1). Since in none of the eFlipRosaβgeo trapped cell lines, the genes adjacent to the insertion sites were expressed at significantly higher levels than in wild-type cells or in postrecombination subclones with enhancerless alleles, we concluded that the OPE effect is largely limited to the trapped genes. This inability of the OPE to activate more distant genes makes enhanced alleles passaged to the mouse germline unlikely to induce phenotypes unrelated to the gene trap.
The OPE increases trapping rate in high-throughput screens
We have recently shown that the high-throughput implementation of the SPLK approach for trapped gene identification in combination with a more potent βgeo fusion gene (i.e. βgeo*) significantly improves the overall recovery of gene trap events (17). To test whether the OPE-induced increase in gene expression also improves gene trapping, we compared the rate at which unique genes were trapped by the enhanced (eFlipRosaβgeo or eFlipRosaβgeo*) versus the nonenhanced (FlipRosaβgeo and FlipRosaβgeo*) parental vectors, using a data set of genomic sequence tags recovered from 1200 trapped ESC lines per vector. Figure 6A shows that the OPE improved the trapping efficiencies of both FlipRosaβgeo and FlipRosaβgeo*, confirming that an increase in gene expression makes more genes accessible to trapping. Not unexpectedly, the highest trapping rate was observed with eFlipRosaβgeo*, suggesting that the OPE- and βgeo* effects on trapping are additive (Figure 6A).
Figure 6.

Gene trapping efficiencies with enhanced vectors. (A) Overall trapping efficiency. The number of novel genes trapped was plotted against the number of accumulating gene trap sequence tags (GTSTs). (B) Trapping rate of hard to trap genes (httgs). ‘Hard-to-trap genes’ are defined as genes that have no entry or only one entry in the IGTC, Omnibank I or Omnibank II gene trap libraries. The number of hard-to-trap ENSEMBL genes trapped was plotted against the cummulative number of unique genes trapped. Note that only ENSEMBL protein-coding genes were considered for this analysis. (C) Trapping rate of antisense transcripts and intergenic regions. Results are based on SPLK tags obtained from a minimum of 1500 ECS lines trapped with each vector.
To investigate whether the increased unique gene trapping rates induced by the enhancer included protein-coding genes that are poorly represented in the gene trap libraries, we determined the efficiency with which each vector trapped genes that have either never been trapped or have been trapped only once before. As shown in Figure 6B, 90 of the 350 unique ENSEMBL genes trapped by eFlipRosaβgeo* (26%) belonged to this category. When compared with FlipRosaβgeo, eFlipRosaβgeo* trapped three times more genes with poor database representation, suggesting that the OPE renders a significant fraction of previously untrappable genes accessible to trapping (Figure 6B).
Enhanced vectors also inserted more frequently into intergenic regions and into the noncoding (antisense) strands of annotated genes (Figure 6C). Analysis of the nine intergenic insertions recovered from the 551 eFlipRosaβgeo trapped ESC lines for which both SPLK and RACE tags were available (Figure 3) showed that in six of them the RACE tags matched genomic sequence between 0.7 and 33.6 kb upstream of the SPLK tags (Supplementary Figure 3), suggesting that the tags are from novel, nonannotated genes. The other three RACE tags corresponded to novel 3′-exons of annotated genes (Supplementary Figure 3). Thus, by inserting with higher frequency into intergenic regions (Figure 6C), eFlipRosaβgeo appears far better suited for novel gene identification and genome annotation than the conventional gene trap vectors.
While the gene trap-activation mechanism from antisense insertions remains to be established by future experiments, the fact that 15% of the antisense eFlipRosaβgeo* insertions mapped to naturally occurring antisense transcripts (20), suggests that a significant fraction the enhanced gene traps disrupt noncoding genes.
eFlipRosaβgeo traps poorly expressed genes
To directly test whether the OPE enables the trapping of genes that are expressed too weakly for detection with conventional gene trap vectors, we assigned absolute gene expression values to the genes trapped with each vector using a recently published Affymetrix Chip Array data set providing quantitative information on the expression levels of 7435 ENSEMBL genes in undifferentiated E14 ESCs (9). Figure 7 shows that the gene expression level of the genes trapped by the two enhanced vectors—whether evaluated as the mean, median, 90th, 75th, 25th or 10th percentile—was significantly lower than the expression level of genes trapped with the corresponding non-enhanced vectors (see also Supplementary Table 2). Moreover, the minimum gene expression level required to enable trapping by one of the enhanced vectors was only half the level of that required for trapping by the corresponding non-enhanced vector (Table 1, Supplementary Table 2).
Figure 7.

Box-Plot of absolute gene expression levels of genes trapped with the FlipRosaβgeo vectors. Gene expression values for trapped ENSEMBL genes were derived from the GEO series accession GSE8128 (9). Box boundaries represent the first and third quartiles (Q.25, Q.75). The median is indicated by the horizontal line dividing the interquartile range. Upper and lower ticks indicate the 10th and 90th percentiles. The mean value is indicated by the dashed line (also see Supplementary Table 1).
Table 1.
Predicted numbers of trappable genes per gene trap vector
| Gene trap vector | Minimum expression levela | Predicted gene number |
Predicted saturation (Nord et al. dataset) (%) | |
|---|---|---|---|---|
| Trappable | Untrappable | |||
| FlipRosaβgeo | 22.88 | 5170 | 2265 | 69.5 |
| eFlipRosaβgeo | 9.95 | 5999 | 1436 | 80.7 |
| FlipRosaβgeoa | 14.71 | 5526 | 1909 | 74.3 |
| eFlipRosaβgeoa | 7.92 | 6278 | 1157 | 84.4 |
aAbsolute gene expression values were obtained from the GEO series accession GSE8128 (http://www.ncbi.nlm.nih.gov/geo/query/acc.cgi?acc=GSE8128).
DISCUSSION
In the present study we have developed and validated a novel class of conditional gene trap vectors that activate gene expression at their insertion sites. Activation is achieved by Oct4 transcription factor binding to ectopic OPEs inserted into the target genes via gene trap vectors. By activating gene expression, these vectors make more genes accessible to trapping including genes that are poorly represented in the gene trap libraries. Since the increase in trappability also included antisense transcripts and intergenic regions, enhanced gene trapping will improve genome annotation and also aid the functional analysis of the over 40 000 antisense transcripts that are thought to be expressed in mouse genome (21).
The enhanced vectors are highly mutagenic, report bona fide gene trap events and have no effect on genes neighboring the insertion sites. Thus, enhanced alleles may be used directly for generating knockout mice as they are unlikely to complicate interpretation of the resulting phenotypes.
Recently published quantitative gene expression data in E14 ESCs (22), makes it possible to estimate the number of genes rendered accessible to trapping by the use of the enhanced vectors. Using minimum expression level to define trappability, numbers of trappable and untrappable genes can be estimated and compared for the different vectors (Figure 7). As shown in Table 1, out of the 7435 genes of the Nord et al. (9) data set, the nonenhanced FlipRosaβgeo vector would be predicted to trap 5170 genes (70% of genes in the Nord et al. data set). This value for percentage of genes accessible to gene trapping is similar to a previous estimate for genome-wide trappability, which was based on 8000 full-length ENSEMBL genes trapped in the existing resources (5). By comparison, the use of the eFlipRosaβgeo* vector would be predicted to increase the number of trappable genes in the Nord et al. data set by about 15% (n = 1108; Table 1). When extrapolated to the entire genome, this suggests that nearly 85% of annotated protein-coding genes may be accessible through the use of enhanced gene trap vectors. This overall increase in trappability appears to be distributed among functional categories of protein coding genes, as the distribution of genes trapped with or without enhancer is similar among the GeneOntology-defined subclasses (Supplementary Table 3).
Finally, the OPE is likely to find wider use beyond gene trapping. For example, enhanced gene trapping cassettes may increase the effficiency of ‘targeted’ trapping, which also requires gene expression (23). In addition, the OPE may improve the performance of exogenous promoters that drive the expression of selectable marker genes in conventional gene targeting vectors.
In conclusion, the results described here are highly relevant to the worldwide large-scale ESC mutagenesis programs started recently under the umbrella of the International Knock Out Mouse Consortium (IKMC) (24). The IKMC programs employ a combination of gene trapping and gene targeting in the effort to knock out every single gene in the mouse genome, and an optimal balance between the two technologies is sought in order to apply the most efficient mutagenesis strategy (24). Because trapping is cheaper and generally involves less work, targeted mutagenesis is normally reserved for genes that are least accessible via trapping. Accordingly, genes well represented in gene trap libraries are generally excluded from gene targeting. Based on the results presented here however, we predict that the enhanced gene trapping approach will significantly increase the pool of genes accessible via trapping or targeting and thus reduce the overall effort and costs of the ongoing mouse mutagenesis programs. Furthermore, these results provide evidence that although gene-trapping vectors have been widely used for almost two decades, the evolution of these vectors is still ongoing and further vector innovations have the potential to significantly impact the accessibility of genes for functional analyses.
SUPPLEMENTARY DATA
Supplementary Data are available at NAR Online.
FUNDING
Deutsche Forschungsgemeinschaft (to H.v.M.), European Union [to the European Conditional Mouse Mutagenesis (EUCOMM) program]. Funding for open access charge: Deutsche Forschungsgemeinschaft.
Conflict of interest statement. None declared.
Supplementary Material
ACKNOWLEDGEMENTS
We thank Dr Laurie von Melchner for valuable suggestions and for editing the final manuscript. We also thank Julia Schmidt, Silke Garkisch, Andrea Siepmann, Carsta Werner, Beata Thalke, Melanie Hollatz, Dorotha German, Anh-Thu Tieu and Sandra Buchner for excellent technical assistance.
REFERENCES
- 1.Stanford WL, Epp T, Reid T, Rossant J. Gene trapping in embryonic stem cells. Methods Enzymol. 2006;420:136–162. doi: 10.1016/S0076-6879(06)20008-9. [DOI] [PubMed] [Google Scholar]
- 2.Stryke D, Kawamoto M, Huang CC, Johns SJ, King LA, Harper CA, Meng EC, Lee RE, Yee A, L’Italien L, et al. BayGenomics: a resource of insertional mutations in mouse embryonic stem cells. Nucleic Acids Res. 2003;31:278–281. doi: 10.1093/nar/gkg064. [DOI] [PMC free article] [PubMed] [Google Scholar]
- 3.Zambrowicz BP, Abuin A, Ramirez-Solis R, Richter LJ, Piggott J, BeltrandelRio H, Buxton EC, Edwards J, Finch RA, Friddle CJ, et al. Wnk1 kinase deficiency lowers blood pressure in mice: a gene-trap screen to identify potential targets for therapeutic intervention. Proc. Natl Acad. Sci. USA. 2003;100:14109–14114. doi: 10.1073/pnas.2336103100. [DOI] [PMC free article] [PubMed] [Google Scholar]
- 4.Hansen J, Floss T, Van Sloun P, Fuchtbauer EM, Vauti F, Arnold HH, Schnutgen F, Wurst W, von Melchner H, Ruiz P. A large-scale, gene-driven mutagenesis approach for the functional analysis of the mouse genome. Proc. Natl Acad. Sci. USA. 2003;100:9918–9922. doi: 10.1073/pnas.1633296100. [DOI] [PMC free article] [PubMed] [Google Scholar]
- 5.Skarnes WC, von Melchner H, Wurst W, Hicks G, Nord AS, Cox T, Young SG, Ruiz P, Soriano P, Tessier-Lavigne M, et al. A public gene trap resource for mouse functional genomics. Nat. Genet. 2004;36:543–544. doi: 10.1038/ng0604-543. [DOI] [PMC free article] [PubMed] [Google Scholar]
- 6.Zambrowicz BP, Friedrich GA, Buxton EC, Lilleberg SL, Person C, Sands AT. Disruption and sequence identification of 2,000 genes in mouse embryonic stem cells. Nature. 1998;392:608–611. doi: 10.1038/33423. [DOI] [PubMed] [Google Scholar]
- 7.Niwa H, Araki K, Kimura S, Taniguchi S, Wakasugi S, Yamamura K. An efficient gene-trap method using poly A trap vectors and characterization of gene-trap events. J. Biochem. 1993;113:343–349. doi: 10.1093/oxfordjournals.jbchem.a124049. [DOI] [PubMed] [Google Scholar]
- 8.Shigeoka T, Kawaichi M, Ishida Y. Suppression of nonsense-mediated mRNA decay permits unbiased gene trapping in mouse embryonic stem cells. Nucleic Acids Res. 2005;33:e20. doi: 10.1093/nar/gni022. [DOI] [PMC free article] [PubMed] [Google Scholar]
- 9.Nord AS, Vranizan K, Tingley W, Zambon AC, Hanspers K, Fong LG, Hu Y, Bacchetti P, Ferrin TE, Babbitt PC, et al. Modeling insertional mutagenesis using gene length and expression in murine embryonic stem cells. PLoS ONE. 2007;2:e617. doi: 10.1371/journal.pone.0000617. [DOI] [PMC free article] [PubMed] [Google Scholar]
- 10.Schnutgen F, De-Zolt S, Van Sloun P, Hollatz M, Floss T, Hansen J, Altschmied J, Seisenberger C, Ghyselinck NB, Ruiz P, et al. Genomewide production of multipurpose alleles for the functional analysis of the mouse genome. Proc. Natl Acad. Sci. USA. 2005;102:7221–7226. doi: 10.1073/pnas.0502273102. [DOI] [PMC free article] [PubMed] [Google Scholar]
- 11.Botquin V, Hess H, Fuhrmann G, Anastassiadis C, Gross MK, Vriend G, Scholer HR. New POU dimer configuration mediates antagonistic control of an osteopontin preimplantation enhancer by Oct-4 and Sox-2. Genes Dev. 1998;12:2073–2090. doi: 10.1101/gad.12.13.2073. [DOI] [PMC free article] [PubMed] [Google Scholar]
- 12.Zazopoulos E, Lalli E, Stocco DM, Sassone-Corsi P. DNA binding and transcriptional repression by DAX-1 blocks steroidogenesis. Nature. 1997;390:311–315. doi: 10.1038/36899. [DOI] [PubMed] [Google Scholar]
- 13.Rodriguez CI, Buchholz F, Galloway J, Sequerra R, Kasper J, Ayala R, Stewart AF, Dymecki SM. High-efficiency deleter mice show that FLPe is an alternative to Cre-loxP. Nat. Genet. 2000;25:139–140. doi: 10.1038/75973. [DOI] [PubMed] [Google Scholar]
- 14.Feil R, Wagner J, Metzger D, Chambon P. Regulation of Cre recombinase activity by mutated estrogen receptor ligand-binding domains. Biochem. Biophys. Res. Commun. 1997;237:752–757. doi: 10.1006/bbrc.1997.7124. [DOI] [PubMed] [Google Scholar]
- 15.Nolan GP, Shatzman AR. Expression vectors and delivery systems. Curr. Opin. Biotechnol. 1998;9:447–450. doi: 10.1016/s0958-1669(98)80027-x. [DOI] [PubMed] [Google Scholar]
- 16.Floss T, Wurst W. Functional genomics by gene-trapping in embryonic stem cells. Methods Mol. Biol. 2002;185:347–379. doi: 10.1385/1-59259-241-4:347. [DOI] [PubMed] [Google Scholar]
- 17.Horn C, Hansen J, Schnütgen F, Seisenberger C, Floss T, Irgang M, De-Zolt S, Wurst W, von Melchner H, Ruiz P. Splinkerette PCR for the more efficient characterization of gene trap event. Nat. Genet. 2007;39:807–808. doi: 10.1038/ng0807-933. [DOI] [PubMed] [Google Scholar]
- 18.Lutz M, Wempe F, Bahr I, Zopf D, von Melchner H. Proteasomal degradation of the multifunctional regulator YB-1 is mediated by an F-Box protein induced during programmed cell death. FEBS Lett. 2006;580:3921–3930. doi: 10.1016/j.febslet.2006.06.023. [DOI] [PubMed] [Google Scholar]
- 19.Ricke RM, Bielinsky AK. Easy detection of chromatin binding proteins by the histone association assay. Biol. Proced. Online. 2005;7:60–69. doi: 10.1251/bpo106. [DOI] [PMC free article] [PubMed] [Google Scholar]
- 20.Zhang Y, Li J, Kong L, Gao G, Liu QR, Wei L. NATsDB: Natural Antisense Transcripts DataBase. Nucleic Acids Res. 2007;35:D156–D161. doi: 10.1093/nar/gkl782. [DOI] [PMC free article] [PubMed] [Google Scholar]
- 21.Katayama S, Tomaru Y, Kasukawa T, Waki K, Nakanishi M, Nakamura M, Nishida H, Yap CC, Suzuki M, Kawai J, et al. Antisense transcription in the mammalian transcriptome. Science. 2005;309:1564–1566. doi: 10.1126/science.1112009. [DOI] [PubMed] [Google Scholar]
- 22.Nord AS, Chang PJ, Conklin BR, Cox AV, Harper CA, Hicks GG, Huang CC, Johns SJ, Kawamoto M, Liu S, et al. The International Gene Trap Consortium Website: a portal to all publicly available gene trap cell lines in mouse. Nucleic Acids Res. 2006;34:D642–D648. doi: 10.1093/nar/gkj097. [DOI] [PMC free article] [PubMed] [Google Scholar]
- 23.Friedel RH, Plump A, Lu X, Spilker K, Jolicoeur C, Wong K, Venkatesh TR, Yaron A, Hynes M, Chen B, et al. Gene targeting using a promoterless gene trap vector (“targeted trapping”) is an efficient method to mutate a large fraction of genes. Proc. Natl Acad. Sci. USA. 2005;102:13188–13193. doi: 10.1073/pnas.0505474102. [DOI] [PMC free article] [PubMed] [Google Scholar]
- 24.Collins FS, Rossant J, Wurst W. A mouse for all reasons. Cell. 2007;128:9–13. doi: 10.1016/j.cell.2006.12.018. [DOI] [PubMed] [Google Scholar]
Associated Data
This section collects any data citations, data availability statements, or supplementary materials included in this article.