

Abstract
Side population (SP) cells are characterized by their ability to efflux the vital dye Hoechst 33342 (Sigma-Aldrich, St. Louis, MO) due to expression of the ATP binding cassette (ABC)-dependent transporter ABCG2, and are highly enriched for stem/progenitor cell activity. In this study we identified SP cells in murine thyroid, which are composed of two populations of cells: CD45(−)/c-kit(−)/Sca1(+) and CD45(−)/c-kit(−)/Sca1(−) cells. Quantitative RT-PCR analysis revealed that SP cells highly express ABCG2 and the stem cell marker genes encoding nucleostemin and Oct4, whereas the expression of genes encoding the thyroid differentiation markers, thyroid peroxidase, thyroglobulin (TG), and TSH receptor, and two transcription factors, thyroid transcription factor 1 (TITF1) and paired PAX8, critical for thyroid specific gene expression, are low in SP cells as compared with the main population cells. In situ hybridization and double immunofluorescence demonstrated that cells expressing Abcg2 gene reside in the interfollicular space of the thyroid gland. Approximately half and a small percentage of the ABCG2-positive cells were also positive for vimentin and calcitonin, respectively. After 9 wk under three-dimensional thyroid primary culture conditions, main population cells formed an epithelial arrangement and follicle-like structures that are immunoreactive for TITF1 and TG. In contrast, SP cells demonstrated very few morphological changes without any epithelial or follicle-like structure and negative immunostaining for TITF1 and TG. These results demonstrate that thyroid possesses SP cells that may represent stem/progenitor cells.
SIDE POPULATION (SP) cells were first identified in the adult murine bone marrow as a small but distinct subset of cells that was able to efflux the vital dye Hoechst 33342 (Sigma-Aldrich, St. Louis, MO) when cells treated with the dye were analyzed by flow cytometry (1). This ability was later shown to be due to expression of the ATP binding cassette (ABC)-dependent transporter, ABCG2 (also called BCRP1), thus rendering the dye efflux of SP cells sensitive to verapamil, an inhibitor of ABCG2 (2). SP cells were subsequently identified in various nonhematopoietic adult tissues, including the liver, skeletal muscle, lung, kidney, and mammary gland (3–10). SP cells are in general considered to have characteristics consistent with stem cells; transplanted SP cells isolated from adult bone marrow or muscle actively participated in the formation of skeletal myotubes during regeneration (9). Furthermore, hepatic SP cells made a substantial contribution to the regeneration of liver parenchyma and bile duct epithelial cells (6).
Tissue SP cells are comprised of CD45(+) and CD45(−) SP cells (3). CD45 is a cell surface tyrosine phosphatase that is expressed on all nucleated cells of hematopoietic origin, including hematopoietic stem cells, but not on any nonhematopoietic cells (10, 11). The CD45(+) subpopulation of tissue-derived SP cells exhibits hematopoietic progenitor activity in vitro (3). However, both CD45(+) and CD45(−) SP cells in the lung and liver were partially derived from donor stem cells after transplantation of bone marrow SP cells (6, 8). Another cell surface marker for murine hematopoietic stem cells is stem cell antigen 1 (Sca1) (10, 12). Sca1 is also expressed on some differentiated cell types, including those in the heart, kidney, and brain (13). Sca1 is expressed on bone marrow, muscle, and mammary gland-derived SP cells (1, 7, 9, 10).
Thyroid is mainly composed of thyroid follicular cells, called the thyrocytes, arranged in follicles with calcitonin-producing C cells as a minor component (14). Once differentiation is completed, the tissue grows roughly in parallel with body weight and remains at the same size throughout adult life (15). What inherently limits the number of thyroid cells is not known. The thyroid turns over very slowly, only five times over the course of the lifetime (15, 16). However, most thyrocytes in the thyroid appear to be able to respond by a few divisions to a proliferation stimulus in vivo and in vitro, and the existence of stem cells that are able to replenish the pool of fully differentiated thyrocytes has been postulated (15).
This study was undertaken to determine whether a Hoechst effluxing population of cells exist in mouse thyroid. We demonstrate for the first time the presence of SP cells in mouse thyroid that display stem/progenitor cell like-characteristics. Previously, mouse embryonic stem cells were successfully differentiated into thyroid follicular cells in vitro in the presence of TSH (17, 18). The current results compensate these studies to provide a new direction in research for physiology, regeneration, and carcinogenesis of the thyroid.
Materials and Methods
Animals
All animal studies were performed in accordance with the Using Animals in Intramural Research Guidelines (National Institutes of Health Animal Research Advisory Committee, National Institutes of Health, Bethesda, MD) and after approval by the institutional Animal Care and Use Committee. Animals used were mainly C57BL/6 with the occasional use of a mixed background of C57BL/6 and 129/Sv, or Black Swiss and 129/Sv. Basically no significant differences were found among these three lines of mice. Thyroid glands were dissected from 4-to 5-wk-old mice after euthanasia, then immediately fixed in 4% paraformaldehyde for histological analysis, or subjected to enzymatic digestion for fluorescence activated cell sorting (FACS) analysis.
Preparation of thyroid cell suspension
To obtain a single cell suspension of thyroid follicles, dissected thyroid lobes were subjected to two-step enzymatic digestion. The first step of digestion was performed to release solitary thyroid follicles according to a previously described method (19). Briefly, dissected thyroid lobes were collected in a 2.0-ml cryotube containing 1 ml digestion medium, which consisted of 100 U/ml type I collagenase (Sigma-Aldrich) and 1.0 U/ml dispase I (Roche Diagnostics, Indianapolis, IN) dissolved in DMEM/F12 medium containing 10% fetal bovine serum (FBS). The digestion was performed in a 37 C air incubator with shaking at 250 revolutions per min for 30 min or until fragments no larger than thyroid follicles were visible. After digestion, all isolated follicles and individual cells, including interfollicular cells, obtained during this process were washed twice with DMEM/F12, seeded in a 60-mm culture dish, and maintained in DMEM/F12 with 10% FBS in a 37 C CO2 incubator. Basically all follicles and individual cells were attached to the bottom of the dish after several hours, while follicles maintained their three-dimensional structures. These attached follicles/cells were carefully washed twice with PBS and then digested with 0.25% trypsin-EDTA for 15 min in a 37 C CO2 incubator. This second step of digestion allowed thyroid follicles to dissociate into single follicular cells. To remove undissociated cell clumps and cell debris, the isolated cells were filtered twice through a 40-μm cell strainer (BD Biosciences, San Jose, CA) and washed twice with DMEM/F12 containing 10% FBS. Filtered cells were resuspended in DMEM/F12 with 2% FBS for the following FACS analysis or cell sorting.
Hoechst 33342 and antibody staining for FACS analysis
Isolated thyroid cells, resuspended in prewarmed DMEM/F12 containing 2% FBS, were stained for 90 min with Hoechst 33342 at a final concentration of 3.0 μg/ml in a 37 C CO2 incubator with occasional shaking to ensure even staining. Control cells were pretreated with verapamil (Sigma-Aldrich) at a final concentration of 150 μM. At the end of the incubation period, cells were immediately placed on ice to terminate staining and washed twice with ice-cold DMEM/F12 containing 2% FBS. For antibody staining, Hoechst-stained cells were washed twice and resuspended in ice-cold Hanks balanced salt solution containing 2% FBS. Antibodies used were fluorescein isothiocyanate (FITC)-conjugated rat antimouse Sca-1, FITC-conjugated rat antimouse CD45, and phycoerythrin (PE)-conjugated rat antimouse c-kit (CD117) (BD PharMingen, San Diego, CA). Antibodies were added to cells at 1:100 dilution and incubated in the dark at 4 C for 30 min. After staining, the cells were washed twice and resuspended in Hanks balanced salt solution supplemented with 2% FBS, and kept on ice until FACS analysis.
A FACS Vantage SE with DiVa option (BD Biosciences) was used for cell sorting and analysis in this study. Cells stained with Hoechst 33342 were excited by a krypton laser (multiline ultraviolet (338–356 nm); 50 mW], and the emitted fluorescence was measured at two wavelengths using a 440/40 (Hoechst blue) and 675LP (Hoechst red) optical filter. A beam splitter 610SP was used to separate the emission wavelengths. Both FITC and PE were excited by an argon laser (488 nm, 150 mW), and the fluorescence was detected through 530/30 and 585/42 filters, respectively. Seven-amino-actinomycin D was added to cells immediately before analysis or sorting as a viability dye to exclude dead cells. For some analyses, the SP cells were further subfractioned to SP1 and SP2 based on the level of Hoechst efflux by setting a gate in which the number of cells in each fraction become equal (Fig. 1C).
Fig. 1.

Detection of SP cells in adult mouse thyroid. Hoechst 33342 staining of mouse thyroid cell suspensions revealed the SP pattern of staining within the gated area (A), which was eliminated by treatment with verapamil (B). For some experiments, the SP fraction was further subdivided into SP1 and SP2 by setting a gate where the number of cells in the two regions becomes equal (C). Note that AB vs. C are two different thyroid preparations.
Cell culture
Collagen solution for three-dimensional culture was prepared as follows. Rat tail collagen (Roche Diagnostics) was dissolved in sterile 0.2% acetic acid (vol/vol) (pH 3.0) at a final concentration of 3 mg/ml. Eight parts of collagen solution were mixed on ice with one part of 10 × concentrated DMEM and one part of reconstitution buffer (32.2 g NaHCO3 + 4.77 g HEPES in 100 ml 0.05 N NaOH), and 0.5 ml of this reconstituted collagen solution was placed on a 12-well culture dish, which was immediately warmed at 37 C for gel formation. Sorted cells of main population (MP), SP1, and SP2 were seeded on top of the collagen gel and maintained in DMEM/F12 with 10% FBS. After cells attached to the basal collagen layer, the culture medium was carefully removed, and then another collagen layer was overlaid. After the upper collagen layer was solidified, the gel was further covered with culture medium (DMEM/F12 with 10% FBS) containing penicillin G, streptomycin, and amphotericin B (antibiotic-antimycotic; Invitrogen, Carlsbad, CA).
Histochemical analyses
Dissected thyroid glands from 1-month-old mice were fixed in 4% paraformaldehyde, embedded in paraffin, and sliced at a thickness of 5 μm. Collagen gels, in which cultured thyroid cells were embedded, were directly subjected to fixation, embedding, and sectioning without any further manipulation. For nonisotopic in situ hybridization, a digoxigenin-labeled RNA probe was used at 0.5 μg/ml. Horseradish peroxidase-conjugated antidigoxigenin Fab fragment was used at 1:5000. To increase sensitivity, the tyramide signal amplification system (PerkinElmer Life and Analytical Sciences, Boston, MA) was used according to the manufacturer’s instructions. Sense and antisense RNA probes were prepared from a 530-bp RT-PCR product of Abcg2 mRNA, which was obtained using RNAs isolated from thyroid and the following primers: for sense probe, forward primer 5′-GGAATTCCAGGTTATGTGGTTCAAGATGACG-3′ containing an EcoRI site at the 5′ end and reverse primer 5′-CGGGATCCCGAATCCGCAGGGTTGTTGTAGG-3′ containing a BamHI site at the 5′ end; and for the antisense probe, forward primer 5′-CGGGATCCCGCAGGTTATGTGGTTCAAGAT-GACG-3′ containing a BamHI site at the 5′ end and reverse primer 5′-GGAATTCCAATCCGCAGGGTTGTTGTAGG-3′ containing an EcoRI site at the 5′ end. Both resulting amplicons of 530 bp were subcloned into the EcoRI-BamHI sites of the pTRIamp plasmid (Ambion, Austin, TX), where the EcoRI site is close to the promoter. Each plasmid was then linearized by digestion with BamHI, and in vitro transcription of digoxigenin-labeled RNA was performed using the DIG RNA labeling kit and T3 RNA polymerase (Roche Diagnostics).
For immunohistochemistry, deparaffinized sections (5 μm) were incubated in a solution of 0.3% H2O2 (vol/vol) in methanol for 30 min to inactivate endogenous peroxidases, followed by rinsing three times for 10 min each with PBS. Sections were subjected to antigen retrieval in citric acid buffer (pH 6.0) at 95 C for 30 min or by microwave for 15 min. Tissues were blocked in 10% goat serum (Vector Laboratories, Burlingame, CA) for 30 min at RT and then incubated overnight with rabbit antithyroid transcription factor 1 antibody (1:1000 dilution; Biopat, Caserta, Italy) or antithyroglobulin antibody (1:400; Biomeda, Foster City, CA) at 4 C in a humidified chamber. After washing three times for 20 min in PBS, the tissues were processed by the ABC method using a commercially available kit (Vector Laboratories) according to the manufacturer’s instruction. For both in situ hybridization and immunohistochemistry, signals were visualized with 3,3′-diaminobenzidine tetra-hydrochloride (Dako, Carpinteria, CA).
Double immunofluorescence was performed using OCT embedded frozen thyroid sections (7 μm). Sections were fixed in acetone at 4 C for 10 min, washed with PBS, and blocked in 5% skim milk at RT for 30 min. After rinsing three times with PBS, tissues were incubated overnight at 4 C with rabbit antithyroglobulin (1:400; Biomeda), anticalcitonin (1:200; Dako), anti-E-cadherin (1:500; Epitomics, Burlingame, CA), anti-p63 (1: 50; Santa Cruz Biotechnology, Santa Cruz, CA), or antivimentin antibody (1:200; Abcam, Cambridge, MA). Tissues were washed with PBS, and then serially incubated with rat anti-BCRP/ABCG2 antibody (1:100; Abcam) at RT for 1 h, biotin-conjugated goat antirabbit IgG (Dako) at RT for 30 min, TRITC-conjugated streptavidin (1:100; Zymed, South San Francisco, CA) at RT for 30 min in the dark, and FITC-conjugated antirat IgG (1:50; Dako) at RT for 30 min in the dark, with washing in between each step. For ABCG2-Sca1 double immunofluorescence, tissues were serially incubated with rat anti-BCRP/ABCG2 antibody at 4 C overnight, FITC-conjugated antirat IgG at RT for 30 min in the dark, and PE-conjugated antimouse Ly-6A/E (Sca1) antibody (1:200; BD Bioscience) at RT for 1 h in the dark. After a final wash in the dark, a coverslip was placed on the tissue sections with ProLong Gold antifade reagent with 4′,6-diamidino-2-phenylindole (Invitrogen). Fluorescent signals were analyzed with the Olympus Provis AX80 microscope and DPmanager software (Olympus, Tokyo, Japan). The number of cells positive for in situ or immunofluorescence signals was calculated using four to five sections each from three mouse thyroids and was expressed as the mean ± SD.
Quantitative RT-PCR
Total RNAs were isolated using Trizol (Invitrogen) according to the instructions provided by the manufacturer, with an additional DNase I treatment (Ambion), and was reverse transcribed into cDNA using Superscript II (Invitrogen) and random hexamers. Quantitative RT-PCR was performed with the ABI PRISM 7900 sequence detection system (PerkinElmer Applied Biosystems, Foster City, CA). A TaqMan assay was adopted for analysis of thyroid transcription factor 1 (Titf1) and TSH receptor (TSHr) mRNAs, and SYBR green master mix (PerkinElmer Applied Biosystems) was used for the analysis of Abcg2, nucleostemin, Oct4, Pax8, thyroid peroxidase (Tpo), and thyroglobulin (Tg) mRNAs. The primers and probes used are listed in Table 1. Data were analyzed by the standard curve method and normalized for 18S rRNA measured using TaqMan Ribosomal RNA Control Reagent, VIC Probe (PerkinElmer Applied Biosystems).
TABLE 1.
Primer sequences used for real-time PCR
| Gene | Forward primer (5′–3′) | Reverse primer (5′–3′) | TaqMan probe (5′–3′) |
|---|---|---|---|
| Abcg2 | CTGGTCCTCTCCCTGCTTTTTC | GCCGTTGTTGTTTCTCTGCG | |
| Nucleostemin | TCGGAGTCCAGCAAGCATTG | GCAGCACTTTCCACATTTGGG | |
| Oct4 | ATCGGACCAGGCTCAGAGGTATTG | TTCTCCAACTTCACGGCATTG | |
| Titf1 | GCGCCGGGTGCTCTTC | CGTGGGTGTCAGGTGAATCA | (6FAM)CCGGAGCGCGAGCATCTGG (TAMRA) |
| Pax8 | AAAGGCCCCTCCTAGTTGATTC | CCGGCGATGCCTCACA | |
| Tpo | GGAAGTGACAAGGCACCTCATTC | GGGGAAGCAAGGATTTTGGTTC | |
| Thyroglobulin | TCAGGAAGGCACTGCTTATGG | GCCCTCTCTGGGCTGATAATT | |
| TSHr | AAGACACCTGGACTCTCAAAAAGC | AGAGAGGTCAGCCCGAGTGA | (6FAM)CCCGCTGTCGTTGAGTTTCCTCCAC (TAMRA) |
Results
SP cells are present in mouse thyroid
To determine whether a cell population with SP phenotype exists in the mouse thyroid gland, dissociated thyroid cells from 4- to 5-wk-old mice were stained with Hoechst 33342. FACS analysis revealed a small, but distinct and reproducible population of Hoechst-effluxing cells, ranging from 0.3–1.4% the total population of cells (n = 15, each using thyroids from at least five mice), which was eliminated by verapamil pretreatment (Fig. 1, A and B). This Hoechst-effluxing population is analogous to the bone marrow SP population as previously described (1), suggesting that a cell population with SP phenotype is present in the mouse thyroid. The thyroid cells were further immunostained with mouse anti-CD45 for segregation of hematopoietic, CD45(+), and thyroid, CD45(−), cells. The SP cells were also sorted based on Sca1 expression, a marker that is commonly expressed in murine hematopoietic SP cells as well as in SP cells of other organs (1, 7, 9, 13). For some analyses, the thyroid SP cells were further subfractioned to SP1 and SP2 (Fig. 1C), based on the assumption that the stronger the dye efflux ability, the higher the stem/progenitor activity may be. In fact, there are reports describing that SP cells with the lowest efflux of Hoechst dye contain the highest progenitor activity (20, 21). FACS analysis revealed that CD45(+) cells constitute only approximately 3% the SP population of cells (SP1 and SP2 combined) (Fig. 2A), whereas Sca1-positive cells represented approximately 56% (Fig. 2C). Within the SP fraction, a similar degree of Sca1-positive cells were found between SP1 and SP2 (~69 and 57%, respectively; n = 7; no statistical difference). The MP fraction had approximately 7 and 11% CD45(+) and Sca1(+) cells, respectively (Fig. 2, B and D). Basically no positive cells for the receptor tyrosine kinase, c-kit, another marker for hematopoietic lineage, also called CD117 (10, 22), were seen in either the SP or MP fraction of cells (~0.5 and 0.2%, respectively) (Fig. 2, E and F). These results suggest that thyroid SP cells are composed of two population of cells: CD45(−)/c-kit(−)/Sca1(+) and CD45(−)/c-kit(−)/Sca1(−).
Fig. 2.
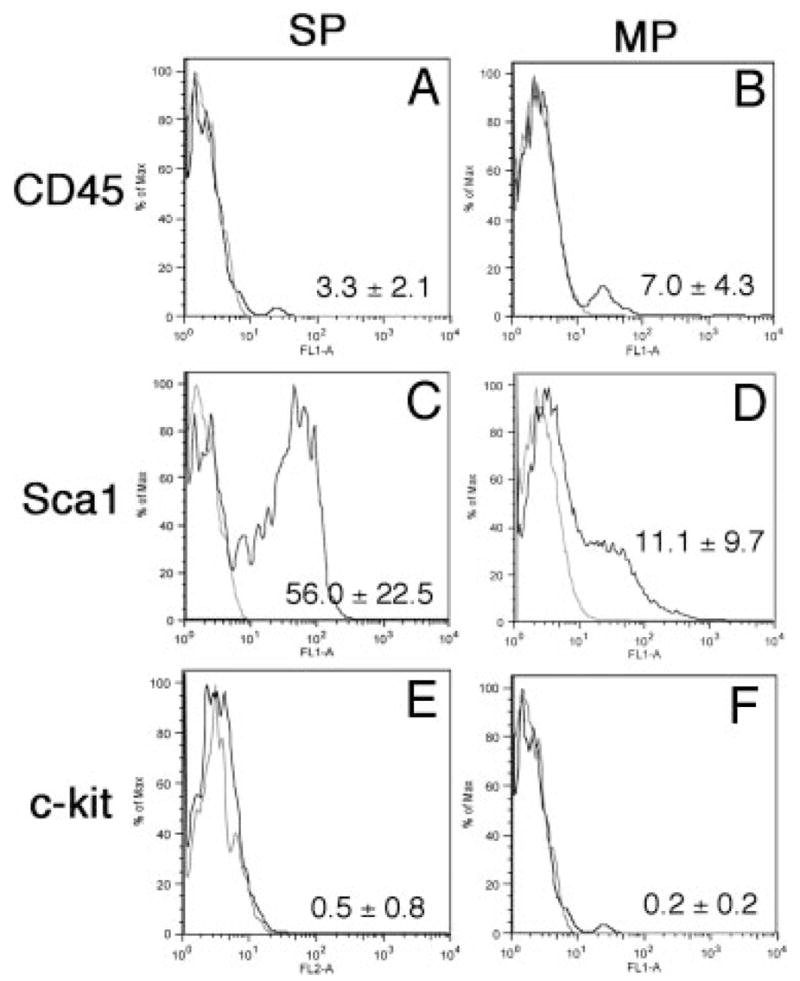
Expression of stem cell markers in thyroid SP and MP populations. Representative FACS results from three to eight independent experiments are shown for CD45 (A and B), Sca1 (C and D), and c-kit (E and F), and the mean number of percentage of (%) positive cells ± SD from these experiments are displayed at the lower right corner. MP cells are basically negative for all three markers, whereas approximately half the SP cells are positive for Sca1.
Thyroid SP cells are less differentiated and may have the property of stem/progenitor cells
The thyroid SP cells were further characterized using gel analysis of RT-PCR products and quantitative RT-PCR for expression of the Abcg2 gene and genes associated with thyroid differentiation such as Titf1 (T/ebp, Ttf1, Nkx2.1), Pax 8, Tpo, Tg, and TSHr, and genes characteristic of embryonic cell lineages, such as nucleostemin and Oct4 (23–25). (Fig. 3). The Abcg2 gene was mainly expressed at similar levels both in SP1 and SP2 cells, but not in MP cells, which was in agreement with the fact that Hoechst dye efflux by SP cells requires ABCG2-associated ATPase activity (2). The stem cell marker gene nucleostemin was in general highly expressed in SP1, followed by SP2 cells as compared with MP cells, whereas Oct4 expression was found at similar levels in both SP fractions, as revealed by the more accurate quantitative RT-PCR (Fig. 3B). Although it appears that the Oct4 RT-PCR band on agarose gel was higher in SP2 cells, it should be noted that the signal was very weak because the quantitative RT-PCR cycle threshold was a very high approximately 34–35. Thus, Oct4 mRNA was expressed in SP1 and SP2 cells, and not significantly expressed in MP cells. In contrast, thyroid-specific genes were highly expressed in MP cells, followed by SP2 and SP1. In particular, Tpo and Tg, the genes directly involved in thyroid hormone synthesis, were not significantly expressed in either SP1 or SP2 cells, as compared with MP cells, in which the two genes were highly expressed. Interestingly, weak, but clear expression of Titf1 and TSHr was detected in the SP2 fraction, suggesting a possible role for these two genes in commitment and/or maintenance of thyroid lineage. Altogether, these results suggest that thyroid SP cells, in particular SP1 cells, are less differentiated or not terminally differentiated as compared with MP cells, and have characteristics of a stem/progenitor cell when judged by gene expression patterns.
Fig. 3.

Gene expression patterns in thyroid SP and MP cells. RNAs isolated from SP1, SP2, and MP fraction of cells were subjected to RT-PCR, followed by agarose gel electrophoresis (representative results are shown in A) and quantitative RT-PCR analysis (B) for various genes as indicated. B, Expression levels are shown as a relative ratio in logarithmic scale based on the level of MP cells as one for Abcg2, nucleostemin and Oct 4, and the expression levels of SP1 cells as one for Titf1, Pax 8, Tpo, Tg, and TSHr. Note that the y-axis has different scales depending on the gene. Values are the mean ± SD from four different experiments, each performed in duplicate. *, P < 0.05. Note that in A, some images were intensified by Photoshop (Adobe Systems, Inc., San Jose, CA) to show clearly the presence of bands.
Cells expressing ABCG2 reside in the interfollicular space of the thyroid gland
Localization of ABCG2-expressing cells in the thyroid gland was determined using nonisotopic in situ hybridization and immunofluorescence (Fig. 4). Abcg2 expression was detected only in a small number of cells in the interfollicular space, but not in cells lining the follicles (Fig. 4A). The percentage of positive cells was calculated to be 5.6 ± 1.9% by in situ hybridization and 1.0 ± 0.24% by immunofluorescence (Fig. 4B). The latter was in good agreement with the number of SP cells obtained by FACS analysis. The difference could be due to the fact that a positive signal for in situ hybridization does not necessarily denote the presence of active protein. Some ABCG2-positive cells were also positive for Sca1, as determined by fluorescence double immunostaining, confirming FACS analysis (Fig. 4B). The number of double-positive cells was 39.4 ± 12.2% out of all ABCG2 positive cells, which was within the range of that obtained by FACS.
Fig. 4.

ABCG2 expression in adult mouse thyroid by in situ hybridization and immunofluorescence. A, In situ hybridization with sense (SS) and anti-sense Abcg2 probes (AS) was performed to locate the expression of Abcg2. Positive signals were detected only in cells surrounding thyroid follicles, but not cells lining follicles (lower panel). B, Immunofluorescence revealed that some cells are positive for only ABCG2 or Sca1, whereas others are double positive for both genes. Only representative areas are shown in which double-positive cells are present. A, upper panel: magnification, ×200; bar, 100 μm. A, lower panel, B: magnification, ×400; and bar, 50 μm.
Double immunostaining was further performed to gain insight into the origin of the ABCG2-positive cells located in the interfollicular space (Fig. 5). Antibodies used included TG as a follicular cell marker, calcitonin as a C cell marker, E-cadherin as an endothelial cell marker, vimentin as a mesenchymal cell marker, and p63 that was proposed to have an epithelial stem cell ability (26). Among them, vimentin-positive cells partially overlapped with ABCG2-positive cells (Fig. 5A). Double-positive cells were 47.9 ± 23.3%. Further interestingly, a few C cells exhibited positive immunofluorescence for ABCG2 (3.0 ± 2.9%) (Fig. 5B).
Fig. 5.

Double-immunofluorescence study. Immunofluorescence was performed to detect double-positive cells for ABCG2 and vimentin (A), and ABCG2 and calcitonin (B). Only representative areas are shown in which double-positive cells are present. Magnification, ×400. Bar, 50 μm.
Thyroid SP cells grow slowly compared with MP cells and stay undifferentiated
To understand the morphological differences between SP and MP cells, sorted cells from each fraction were cultured in a three-dimensional collagen gel system (Fig. 6A). At 1 wk, SP1 cells demonstrated polygonal or multipolar shape, which by 3 wk became well connected to each other by their cytoplasmic projections. This morphological appearance showed little change even after 5 wk, and the number of cells stayed similar to that found at 1 wk. MP cells also demonstrated polygonal or multipolar morphologies at the beginning of the culture period, however, by 1 wk, they expanded rapidly and organized continuous pavement with occasional tubular structure. Interestingly, spherical structures began to form around 3 wk, which further increased in number and size by 5 wk. These morphological characteristics of SP1 and MP cells remained the same after 9 wk of culture, however, histological analysis performed at this time revealed that MP cells with hyperchromatic oval nuclei formed epithelial arrangement and follicle-like structure (Fig. 6B, right panel), which were immunoreactive for TITF1 and TG (Fig. 6C), indicating that MP cells can form a functional thyroid follicle. On the other hand, in the SP1 faction, only spindle or polygonal cells with processes were found with no epithelial arrangement or follicle-like structure (Fig. 6B, left panel). SP2 cells showed an intermediate character between SP1 and MP cells regarding growth rate and morphology, but the epithelial arrangement or follicle-like structure as seen in MP cells were never formed. Immunohistochemical staining of both SP1 and SP2 cells for TITF1 or TG did not show any positive cells (data not shown).
Fig. 6.
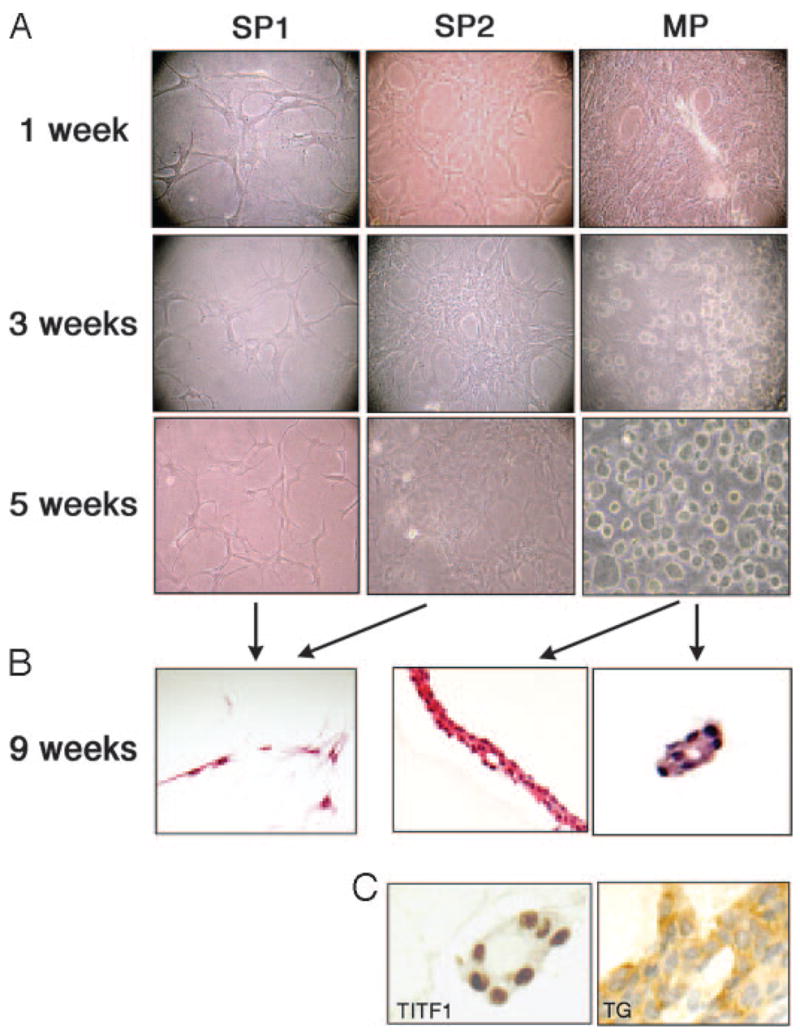
Morphological assessment of mouse thyroid SP and MP cells. SP1, SP2, and MP fractions were cultured using a three-dimensional collagen gel system, and cell morphology was recorded after 1, 3, and 5-wk culture (A). After 9 wk, cells were analyzed by hematoxylin and eosin staining for histology (B) and by immunohistochemistry (C) for TITF1 and TG. Only MP cells, but not SP1 or SP2 cells, developed epithelial arrangement and follicle-like structures that express TITF1 and TG. Magnification: ×100 (A), ×200 (B), and ×400 (C).
Discussion
In this study we report for the first time the identification of thyroid SP cells in normal adult mice. The SP cells from thyroid show similar phenotypes with those identified in other organs (1, 3–10). SP cells are defined as a verapamil-sensitive small population of cells that efflux Hoechst 33342 through the ATP transporter ABCG2 in these cells (2). ABCG2-positive SP cells are located in the interfollicular space of the thyroid at a frequency of approximately 1%, as determined by FACS analysis and immunohistochemistry. The presence of SP cells in the thyroid was recently reported using human thyroid cancer cell lines (27).
Approximately half the thyroid SP cells, regardless of SP1 or SP2, possess the surface phenotype Sca1(+), as reported for other SP cells (1, 7, 9, 10). We do not know at this point whether Sca1-positive and Sca1-negative cells behave differently or express different lineage markers. In contrast to Sca1, CD45 expression is mostly negative in thyroid SP cells. Other organs are known to contain CD45(+) SP cells to various extents (3). However, the origin of SP cells in non-hematopoietic tissues remains largely unclear. Although CD45 is a specific marker for pan-hematopoietic cells (11), recent studies using bone marrow transplantation analysis showed that CD45(−) SP cells in the lung and liver are derived from bone marrow (6, 8). Furthermore, SP cells in skeletal muscle were replenished over time from the bone marrow SP population (28). Thus, even though thyroid SP cells are mostly negative for CD45, we cannot exclude the possibility that thyroid SP cells are derived from bone marrow. Besides lung and skeletal muscle, the SP population in any given organ may be replenished by bone marrow SP cells if their SP population has been depleted due to certain pathological conditions requiring the use of SP cells as stem/progenitor cells, such as physiological cellular turnover or tissue regeneration. If this were the case, a great diversity in a percentage of CD45(+) SP cells among organs may depend on a cellular turnover rate specific to each organ. Assuming that newly replenished bone marrow-derived SP cells express CD45 in each organ, they may gradually lose this expression while they stay unused for tissue regeneration for a long period of time. Thus, it is possible that organs with a high turnover rate may be rich in fresh CD45(+) SP cells, whereas most SP cells in organs with low turnover rates may have lost CD45 expression. The thyroid has a very low cellular turnover rate of only five times in the lifespan of mammals (15, 16). Thus, this hypothesis might explain the low percentage of CD45(+) cells in the thyroid SP population. In fact, heart and brain, both of which are generally believed not to regenerate under physiological conditions, contain markedly low levels of CD45(+) cells in their SP populations (3).
Quantitative RT-PCR analysis revealed that Abcg2 was up-regulated in thyroid SP cells, which fits the criteria for SP cells; their phenotype is attributed to the function of ABCG2 (2). The gene expression profile further demonstrated that thyroid SP cells are less differentiated compared with MP cells and are likely to have some properties of stem/progenitor cells, as judged from limited expression of thyroid differentiation marker genes (i.e. Tpo and Tg), and exclusive expression of genes related to stem cell proliferation and self-renewal (i.e. nucleostemin and Oct4) (23–25). In agreement with other reports that describe a correlation between the strongest dye efflux activity and the highest progenitor activity (20, 21), thyroid SP2 cells appeared to be slightly more differentiated, or closer to mature thyrocytes than SP1 cells when SP cells were further subfractioned to SP1 and SP2. This notion fits the fact that Titf1 and TSHr genes were not significantly expressed in SP1 cells, whereas weak expression was found in SP2 cells, which suggests the possible involvement of these two genes in thyroid lineage commitment. Moreover, expression of nucleostemin that regulates cell cycle progression in stem cells (23) drastically decreased in step-wise as cells moved from SP1, SP2 to MP, which appeared to correlate with the marked step-wise increase in expression of Tpo and Tg, the thyroid differentiation marker genes. These results suggest that nucleostemin may be a good marker for the undifferentiated state of the thyroid. However, we do not know whether SP1 and SP2 cells play any different biological roles. Note that a recent study describes expression of Oct4 in adult human goitrous thyroids, suggesting the presence of adult stem cells (29). In the thyroid, TITF1 and PAX8 are critical transcription factors essential for both normal development and maintenance of the function in postnatal life (14, 30, 31). These transcription factors begin to be expressed from the beginning of thyroid organogenesis (14). Interestingly, these transcription factors were down-regulated in thyroid SP cells, suggesting that thyroid SP cells may have different characters from embryonic thyroid progenitor cells.
Double-immunofluorescence results revealed that approximately half the ABCG2-positive cells were also positive for vimentin, a marker for mesenchyme, suggesting that these ABCG2-positive cells may be of the mesenchymal lineage. Similar enriched vimentin expression was reported in lung SP cells (32) and liver adult stem cells (33). These results suggest that at least some thyroid SP cells may share the common characteristics with other organs’ SP/stem cells. Furthermore, a very small percentage of ABCG2-calcitonin double-positive cells were found by immunofluorescence. This result might suggest the presence of intermediate, partially differentiated cells that possess characteristics of both stem/progenitor cells and C cells, and that some thyroid stem/progenitor cells might be of the lineage of C cells. Alternatively, there is a possibility that a small number of C cells might retain ABCG2 activity. In this regard, it is interesting to note that a small minority of C cells in the normal thyroid produce and store somatostatin, whereas in some C cell adenomas and most of the C cell carcinomas, nearly all calcitonin-positive cells coexpress somatostatin (34, 35). Therefore, it was suggested that C cell tumors are more likely to occur from somatostatin-expressing stem cells (34, 35).
SP cells prepared from tissues such as liver, kidney, muscle, and mammary gland have undergone tissue-specific differentiation in vivo and/or in vitro (4–7, 9, 36). In the current study, thyroid SP cells exhibited very slow growth and no sign of differentiation in culture for at least 9 wk. It is known that in in vitro cultures, serum and/or defined chemical environment characterized by growth factors and/or cytokines is required for the maintenance of undifferentiated stem cells and for their differentiation, and which growth factors/cytokines are required differs depending on cell types and/or tissues (37). It is possible that the culture conditions we used may not be suited for thyroid SP cells to self-renew and/or differentiate efficiently. Mouse embryonic stem cells were successfully differentiated into thyroid follicular cells in vitro, in which TSH was responsible for the induction of thyroid development (17, 18). Our numerous attempts to differentiate SP cells into thyroid cells did not yield reproducible results, regardless of the presence of TSH in the media. The conditions that are the best suited for differentiation of thyroid SP cells to thyroid cells remain to be determined.
The existence of stem cells that are able to replenish the pool of fully differentiated thyrocytes was postulated (15). The frequency of such stem cells in the thyroid would have been estimated at most to be 1 of 1000 (15). This number somewhat agrees with the SP population we identified in this study if in fact these SP cells were the stem/progenitor cells. Studies are underway to demonstrate the ability of SP cells to contribute to the growth of thyroid by in vivo transplantation of SP cells into recipient animals that have undergone partial ablation of thyroid function. Our current findings may provide a new direction in research for physiology, regeneration, and carcinogenesis of the thyroid.
Acknowledgments
We thank Frank Gonzalez for his careful review of the manuscript.
This work was supported by the National Cancer Institute, Intramural Research Program, and Fukushima Medical University Research Project.
Abbreviations
- ABC
ATP binding cassette
- FACS
fluorescence activated cell sorting
- FBS
fetal bovine serum
- FITC
fluorescein isothiocyanate
- MP
main population
- PE
phycoerythrin
- Sca1
stem cell antigen 1
- SP
side population
- TG
thyroglobulin
- TITF1
thyroid transcription factor 1
- TPO
thyroid peroxidase
- TSHr
TSH receptor
Footnotes
Disclosure Statement: The authors have nothing to declare.
References
- 1.Goodell MA, Brose K, Paradis G, Conner AS, Mulligan RC. Isolation and functional properties of murine hematopoietic stem cells that are replicating in vivo. J Exp Med. 1996;183:1797–1806. doi: 10.1084/jem.183.4.1797. [DOI] [PMC free article] [PubMed] [Google Scholar]
- 2.Zhou S, Schuetz JD, Bunting KD, Colapietro AM, Sampath J, Morris JJ, Lagutina I, Grosveld GC, Osawa M, Nakauchi H, Sorrentino BP. The ABC transporter Bcrp1/ABCG2 is expressed in a wide variety of stem cells and is a molecular determinant of the side-population phenotype. Nat Med. 2001;7:1028–1034. doi: 10.1038/nm0901-1028. [DOI] [PubMed] [Google Scholar]
- 3.Asakura A, Rudnicki MA. Side population cells from diverse adult tissues are capable of in vitro hematopoietic differentiation. Exp Hematol. 2002;30:1339–1345. doi: 10.1016/s0301-472x(02)00954-2. [DOI] [PubMed] [Google Scholar]
- 4.Iwatani H, Ito T, Imai E, Matsuzaki Y, Suzuki A, Yamato M, Okabe M, Hori M. Hematopoietic and nonhematopoietic potentials of Hoechst(low)/side population cells isolated from adult rat kidney. Kidney Int. 2004;65:1604–1614. doi: 10.1111/j.1523-1755.2004.00561.x. [DOI] [PubMed] [Google Scholar]
- 5.Hussain SZ, Strom SC, Kirby MR, Burns S, Langemeijer S, Ueda T, Hsieh M, Tisdale JF. Side population cells derived from adult human liver generate hepatocyte-like cells in vitro. Dig Dis Sci. 2005;50:1755–1763. doi: 10.1007/s10620-005-2933-x. [DOI] [PMC free article] [PubMed] [Google Scholar]
- 6.Wulf GG, Luo KL, Jackson KA, Brenner MK, Goodell MA. Cells of the hepatic side population contribute to liver regeneration and can be replenished with bone marrow stem cells. Haematologica. 2003;88:368–378. [PubMed] [Google Scholar]
- 7.Welm BE, Tepera SB, Venezia T, Graubert TA, Rosen JM, Goodell MA. Sca-1(pos) cells in the mouse mammary gland represent an enriched progenitor cell population. Dev Biol. 2002;245:42–56. doi: 10.1006/dbio.2002.0625. [DOI] [PubMed] [Google Scholar]
- 8.Summer R, Kotton DN, Sun X, Fitzsimmons K, Fine A. Translational physiology: origin and phenotype of lung side population cells. Am J Physiol Lung Cell Mol Physiol. 2004;287:L477–L483. doi: 10.1152/ajplung.00020.2004. [DOI] [PubMed] [Google Scholar]
- 9.Gussoni E, Soneoka Y, Strickland CD, Buzney EA, Khan MK, Flint AF, Kunkel LM, Mulligan RC. Dystrophin expression in the mdx mouse restored by stem cell transplantation. Nature. 1999;401:390–394. doi: 10.1038/43919. [DOI] [PubMed] [Google Scholar]
- 10.Challen GA, Little MH. A side order of stem cells: the SP phenotype. Stem Cells. 2006;24:3–12. doi: 10.1634/stemcells.2005-0116. [DOI] [PubMed] [Google Scholar]
- 11.Trowbridge IS, Thomas ML. CD45: an emerging role as a protein tyrosine phosphatase required for lymphocyte activation and development. Annu Rev Immunol. 1994;12:85–116. doi: 10.1146/annurev.iy.12.040194.000505. [DOI] [PubMed] [Google Scholar]
- 12.Spangrude GJ, Heimfeld S, Weissman IL. Purification and characterization of mouse hematopoietic stem cells. Science. 1988;241:58–62. doi: 10.1126/science.2898810. [DOI] [PubMed] [Google Scholar]
- 13.van de Rijn M, Heimfeld S, Spangrude GJ, Weissman IL. Mouse hematopoietic stem-cell antigen Sca-1 is a member of the Ly-6 antigen family. Proc Natl Acad Sci USA. 1989;86:4634–4638. doi: 10.1073/pnas.86.12.4634. [DOI] [PMC free article] [PubMed] [Google Scholar]
- 14.Di Lauro R, De Felice M. Thyroid gland: anatomy and development. In: DeGroot L, Jameson J, editors. Endocrinology. Philadelphia: Saunders; 2001. pp. 1268–1278. [Google Scholar]
- 15.Dumont JE, Lamy F, Roger P, Maenhaut C. Physiological and pathological regulation of thyroid cell proliferation and differentiation by thyrotropin and other factors. Physiol Rev. 1992;72:667–697. doi: 10.1152/physrev.1992.72.3.667. [DOI] [PubMed] [Google Scholar]
- 16.Coclet J, Foureau F, Ketelbant P, Galand P, Dumont JE. Cell population kinetics in dog and human adult thyroid. Clin Endocrinol (Oxf) 1989;31:655–665. doi: 10.1111/j.1365-2265.1989.tb01290.x. [DOI] [PubMed] [Google Scholar]
- 17.Lin RY, Kubo A, Keller GM, Davies TF. Committing embryonic stem cells to differentiate into thyrocyte-like cells in vitro. Endocrinology. 2003;144:2644–2649. doi: 10.1210/en.2002-0122. [DOI] [PubMed] [Google Scholar]
- 18.Arufe MC, Lu M, Kubo A, Keller G, Davies TF, Lin RY. Directed differentiation of mouse embryonic stem cells into thyroid follicular cells. Endocrinology. 2006;147:3007–3015. doi: 10.1210/en.2005-1239. [DOI] [PMC free article] [PubMed] [Google Scholar]
- 19.Jeker LT, Hejazi M, Burek CL, Rose NR, Caturegli P. Mouse thyroid primary culture. Biochem Biophys Res Commun. 1999;257:511–515. doi: 10.1006/bbrc.1999.0468. [DOI] [PubMed] [Google Scholar]
- 20.Matsuzaki Y, Kinjo K, Mulligan RC, Okano H. Unexpectedly efficient homing capacity of purified murine hematopoietic stem cells. Immunity. 2004;20:87–93. doi: 10.1016/s1074-7613(03)00354-6. [DOI] [PubMed] [Google Scholar]
- 21.Parmar K, Sauk-Schubert C, Burdick D, Handley M, Mauch P. Sca+CD34- murine side population cells are highly enriched for primitive stem cells. Exp Hematol. 2003;31:244–250. doi: 10.1016/s0301-472x(02)01074-3. [DOI] [PubMed] [Google Scholar]
- 22.Wognum AW, Eaves AC, Thomas TE. Identification and isolation of hematopoietic stem cells. Arch Med Res. 2003;34:461–475. doi: 10.1016/j.arcmed.2003.09.008. [DOI] [PubMed] [Google Scholar]
- 23.Tsai RY, McKay RD. A nucleolar mechanism controlling cell proliferation in stem cells and cancer cells. Genes Dev. 2002;16:2991–3003. doi: 10.1101/gad.55671. [DOI] [PMC free article] [PubMed] [Google Scholar]
- 24.Niwa H, Miyazaki J, Smith AG. Quantitative expression of Oct-3/4 defines differentiation, dedifferentiation or self-renewal of ES cells. Nat Genet. 2000;24:372–376. doi: 10.1038/74199. [DOI] [PubMed] [Google Scholar]
- 25.Pesce M, Scholer HR. Oct-4: gatekeeper in the beginnings of mammalian development. Stem Cells. 2001;19:271–278. doi: 10.1634/stemcells.19-4-271. [DOI] [PubMed] [Google Scholar]
- 26.McKeon F. p63 and the epithelial stem cell: more than status quo? Genes Dev. 2004;18:465–469. doi: 10.1101/gad.1190504. [DOI] [PubMed] [Google Scholar]
- 27.Mitsutake N, Iwao A, Nagai K, Namba H, Ohtsuru A, Saenko V, Yamashita S. Characterization of side population in thyroid cancer cell lines: cancer stem-like cells are enriched partly but not exclusively. Endocrinology. 2007;148:1797–1803. doi: 10.1210/en.2006-1553. [DOI] [PubMed] [Google Scholar]
- 28.Majka SM, Jackson KA, Kienstra KA, Majesky MW, Goodell MA, Hirschi KK. Distinct progenitor populations in skeletal muscle are bone marrow derived and exhibit different cell fates during vascular regeneration. J Clin Invest. 2003;111:71–79. doi: 10.1172/JCI16157. [DOI] [PMC free article] [PubMed] [Google Scholar]
- 29.Thomas T, Nowka K, Lan L, Derwahl M. Expression of endoderm stem cell markers: evidence for the presence of adult stem cells in human thyroid glands. Thyroid. 2006;16:537–544. doi: 10.1089/thy.2006.16.537. [DOI] [PubMed] [Google Scholar]
- 30.Kimura S, Hara Y, Pineau T, Fernandez-Salguero P, Fox CH, Ward JM, Gonzalez FJ. The T/ebp null mouse: thyroid-specific enhancer-binding protein is essential for the organogenesis of the thyroid, lung, ventral forebrain, and pituitary. Genes Dev. 1996;10:60–69. doi: 10.1101/gad.10.1.60. [DOI] [PubMed] [Google Scholar]
- 31.Mansouri A, Chowdhury K, Gruss P. Follicular cells of the thyroid gland require Pax8 gene function. Nat Genet. 1998;19:87–90. doi: 10.1038/ng0598-87. [DOI] [PubMed] [Google Scholar]
- 32.Reynolds SD, Shen H, Reynolds P, Betsuyaku T, Pilewski J, Gambelli F, Deguiseppe M, Ortiz LA, Stripp B. Molecular and functional properties of lung SP cells. Am J Physiol Lung Cell Mol Physiol. 2007;292:L972–L983. doi: 10.1152/ajplung.00090.2006. [DOI] [PubMed] [Google Scholar]
- 33.Herrera MB, Bruno S, Buttiglieri S, Tetta C, Gatti S, Deregibus MC, Bussolati B, Camussi G. Isolation and characterization of a stem cell population from adult human liver. Stem Cells. 2006;24:2840–2850. doi: 10.1634/stemcells.2006-0114. [DOI] [PubMed] [Google Scholar]
- 34.Pilling A, Jones S, Turton J. Expression of somatostatin mRNA and peptides in C-cell tumours of the thyroid gland in Han Wistar rats. Int J Exp Pathol. 2004;85:13–23. doi: 10.1111/j.0959-9673.2004.00367.x. [DOI] [PMC free article] [PubMed] [Google Scholar]
- 35.Martin-Lacave I, Rojas F, Bernabe R, Utrilla JC, Fernandez-Santos JM, De Miguel M, Conde E. Comparative immunohistochemical study of normal, hyperplastic and neoplastic C cells of the rat thyroid gland. Cell Tissue Res. 2002;309:361–368. doi: 10.1007/s00441-002-0599-7. [DOI] [PubMed] [Google Scholar]
- 36.Asakura A, Seale P, Girgis-Gabardo A, Rudnicki MA. Myogenic specification of side population cells in skeletal muscle. J Cell Biol. 2002;159:123–134. doi: 10.1083/jcb.200202092. [DOI] [PMC free article] [PubMed] [Google Scholar]
- 37.Ulloa-Montoya F, Verfaillie CM, Hu WS. Culture systems for pluripotent stem cells. J Biosci Bioeng. 2005;100:12–27. doi: 10.1263/jbb.100.12. [DOI] [PubMed] [Google Scholar]