Abstract
The extrathoracic region, including the nasal and oral passages, pharynx, and larynx, is the entrance to the human respiratory tract and the first line of defense against inhaled air pollutants. Estimates of regional deposition in the thoracic region are based on data obtained with human volunteers, and that data showed great variability in the magnitude of deposition under similar experimental conditions. In the past decade, studies with physical casts and computational fluid dynamic simulation have improved upon the understanding of deposition mechanisms and have shown some association of aerosol deposition with airway geometry. This information has been analyzed to improve deposition equations, which incorporate characteristic airway dimensions to address intersubject variability of deposition during nasal breathing. Deposition in the nasal and oral airways is dominated by the inertial mechanism for particles >0.5 μm and by the diffusion mechanism for particles <0.5 μm. Deposition data from adult and child nasal airway casts with detailed geometric data can be expressed as En = 1 − exp(−110 Stk), where the Stokes number is a function of the aerodynamic diameter (da), flow rate (Q), and the characteristic nasal airway dimension, the minimum cross-sectional area (Amin). In vivo data for each human volunteer follow the equation when the appropriate value of Amin is used. For the diffusion deposition, in vivo deposition data for ultrafine particles and in vivo and cast data for radon progeny were used to derive the following deposition: , where Sf is the normalized surface area in the turbinate region of the nasal airway, and D is the diffusion coefficient. The constant is not significantly different for inspiratory deposition than for expiratory deposition. By using the appropriate characteristic dimension, Sf, one can predict the variability of in vivo nasal deposition fairly well. Similar equations for impaction and diffusion deposition were obtained for deposition during oral breathing. However, the equations did not include airway dimensions for intersubject variability, because the data set did not have airway dimension measurements. Further studies with characteristic airway dimensions for oral deposition are needed. These equations could be used in lung deposition models to improve estimates of extrathoracic deposition and intersubject variability.
INTRODUCTION
Inhalation exposure is the major route by which workers and the general population are exposed to airborne pollutants. The extrathoracic region, including the nasal and oral passages, pharynx, and larynx, is the entrance to the human respiratory tract and the first line of defense against inhaled air pollutants. Substantial deposition of airborne material in the head airways prevents vapors and aerosols from reaching the tracheobronchial and pulmonary regions of the respiratory tract. Aerosol deposition in the extrathoracic region has also been associated with certain diseases such as nasal and oral cancers. Extrathoracic deposition of therapeutic aerosols from medical inhalers or nasal sprays has important implications in delivery efficiency and dosimetry (Clark et al. 1998; Cheng et al. 2001a, 2001b).
Data obtained from human volunteers were the basis for estimates of regional deposition in the thoracic region. The Task Group on Lung Dynamics (1966) adopted an empirical relationship for nasal deposition of particles based on in vivo data of Pattle (1961) for particles >1 μm in diameter. The deposition efficiency was expressed as a function of the inertial parameter , where da is the aerodynamic diameter, and Q (L min−1) is the flow rate:
| [1] |
This inertial parameter becomes the Stokes number if a characteristic length (L) and cross-sectional area (A) of the nasal airway geometry are used, where μ is air viscosity. Yu et al. (1981) derived similar deposition equations in nasal and oral airways by summarizing in vivo deposition data from several studies with two logarithmic functions of the inertial parameter. Their analysis showed great variability of deposition efficiency in both nasal and oral regions under similar experimental conditions. These equations have been used in many lung deposition models to predict regional dosimetry of inhaled particles. However, these analyses are limited. Because of the variability of the data sets, it is not possible to confirm the assumption that the head airway deposition is a unique function of the inertial parameter. The fitted equations predicted over 100% deposition at larger values of the inertial parameter, indicating that the equation may not show the correct mathematical form of the deposition mechanism. The aerosol deposition should range from 0 to 1. At small values of the inertial parameter, the deposition approaches zero, indicating no deposition due to inertial mechanism; on the other hand, at large values of the inertial parameter, the deposition efficiency should approach 1.
In the new lung deposition model of the International Commission on Radiological Protection (ICRP) (ICRP 1994), nasal and oral deposition equations were obtained using a different mathematical form:
| [2] |
The Task Group of the National Council on Radiation Protection and Measurement (NCRP) (Yeh et al. 1996; NCRP 1997) used a slightly different deposition equation:
| [3] |
where ρ is the particle density and d is the geometric diameter. Using these equations, the deposition efficiency E approaches 1 for large values of the inertial parameter and 0 for small values of the inertial parameter.
Later, experimental deposition in physical casts of extrathoracic airways showed that for ultrafine particles ≤0.2 μm, deposition increases with decreasing particle size and flow rates, indicating diffusion deposition for ultrafine particles (Cheng et al. 1988,1990,1993; Swift etal. 1992; Yamada etal. 1988). Based on a turbulent diffusion model, deposition efficiency can be expressed as a function of diffusion coefficient (D) and flow rate Q (Cheng et al. 1993):
| [4] |
Values of constant a were estimated from fitting the curves of experimental data for nasal and oral deposition. This equation was used in the new ICRP (1994) and NCRP (Yeh et al. 1996) lung deposition models. In vivo deposition data of head airways for ultrafine particles and radon progeny (Cheng, Y. S. et al. 1996; Cheng, K. H. et al. 1996; Swift and Strong 1996) confirmed the data from physical casts. In vivo data also show intersubject variability in the diffusion deposition regime.
In the past decade, studies with physical casts and computational fluid dynamic simulation have improved the understanding of deposition mechanisms. Extrathoracic airway dimensions were also measured in detail (Guilmette et al. 1989,1997; Cheng, Y. S. et al. 1996; Cheng, K. H. et al. 1996, 1997). Nasal airway geometry showed great variability among groups of adult volunteers (Guilmette et al. 1997; Cheng, Y. S. et al. 1996; Cheng, K. H. et al. 1996; Kesavanathan et al., 1998). Furthermore, diffusion deposition of the nasal airway has been associated with airway geometry (Cheng, Y. S. et al. 1996; Cheng, K. H. et al. 1996). The objective of this study was to incorporate new information on airway geometry and in vivo and in vitro deposition data to improve deposition equations. These equations incorporate characteristic airway dimensions to address intersubject variability of deposition during nasal breathing.
METHODS
In this study, in vivo and in vitro (airway replica) data were analyzed to obtain deposition equations in the extrathoracic region for nasal and oral breathing, respectively. In several studies, the nasal airway dimensions for casts and human volunteers have also been measured (Swift 1991; Cheng, Y. S. et al. 1996,1999; Cheng, K. H. et al. 1996, 1997; Kesavanathan et al. 1998). Under the assumption that the airway geometry is a major factor in deposition, it was then possible to include the relevant airway dimensions in the deposition equation to explain the intersubject variability of deposition in the in vivo experiments. The inertial mechanism for particles >0.5 μm and the diffusion mechanism for particles <0.5 μm dominate deposition in the nasal and oral airways. A turbulent deposition flow in the extrathoracic airways was assumed, so the deposition equation (Cheng et al. 1991) could be expressed as
| [5] |
where Stk , SC (ν/D), and Re (UL/ν) are the Stokes, Schmidt, and Reynolds numbers, respectively. The first term of the argument is for the impaction mechanism, and the second is for the diffusion mechanism. For particles > 1 μm in size, the diffusion term is negligible compared to the inertial term, and the deposition efficiency can be approximated as
| [6] |
On the other hand, for particle sizes <0.1 μm, the diffusion term is dominant, and Equation (4) can be simplified as
| [7] |
As the Stokes number increases, Equations (5) and (6) approach 1, whereas for ultrafine particles Equations (5) and (7) approach 1 as the value of Sc−1/2Re−1/8 becomes large. The minimum deposition occurs for particle sizes between 0.1 and 1 μm when both inertial and diffusion effects are at a minimum. In vivo and in vitro deposition data were then used to test the validity of these equations and/or to derive modified equations for nasal and oral deposition. Nonlinear curve-fitting procedures of SigmaPlot software (SPSS Inc, Chicago, EL) were used to obtain best fits.
Nasal and oral deposition measurements for inspiratory and expiratory flow were analyzed separately and compared. In many cases, data from the same cast or volunteers were available. These data were used to test the hypothesis that inspiratory and expiratory depositions are significantly different by using a oneway analysis of covariance (Christensen 1996). The F statistics can be calculated from the following expression:
| [8] |
where SS is the sum of the squares calculated from the difference of predicted values of the fitted equation and data, subscript t denotes curve fitting using both the inspiratory and expiratory deposition data, and subscript c denotes the combined sum of squares from a separate curve fit of inspiratory and expiratory depositions. DFin and DFex are the degrees of freedom from the curve fitting of inspiratory and expiratory depositions, respectively. If F values are smaller than the values at the 95th percentiles of F distribution, then we assume that the inspiratory and expiratory depositions are not significantly different.
RESULTS AND DISCUSSION
Nasal Deposition in the Inertial Regime
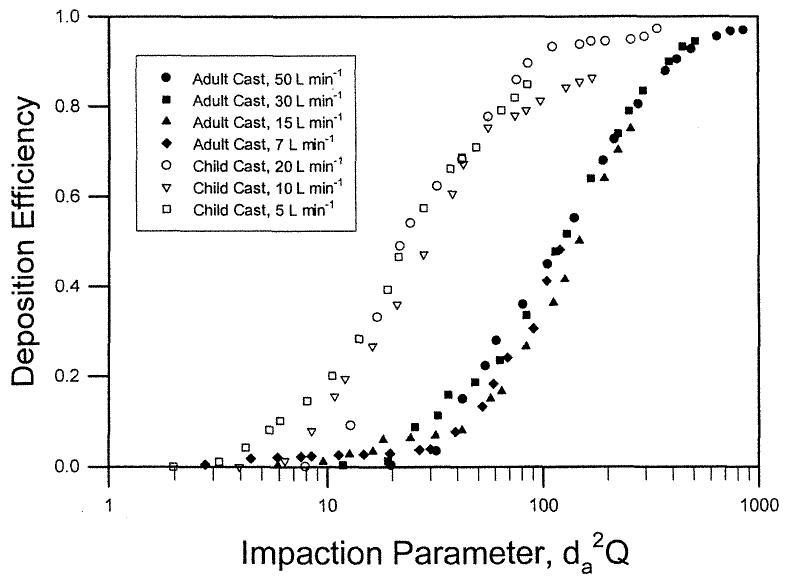
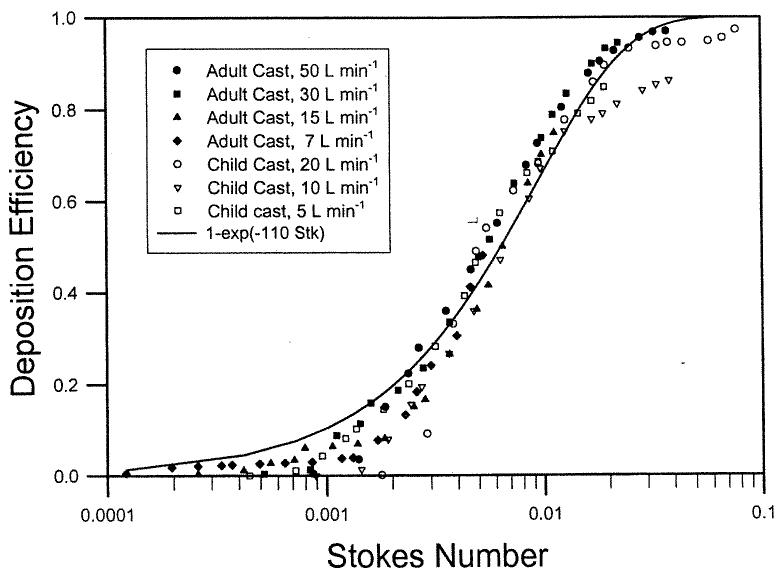
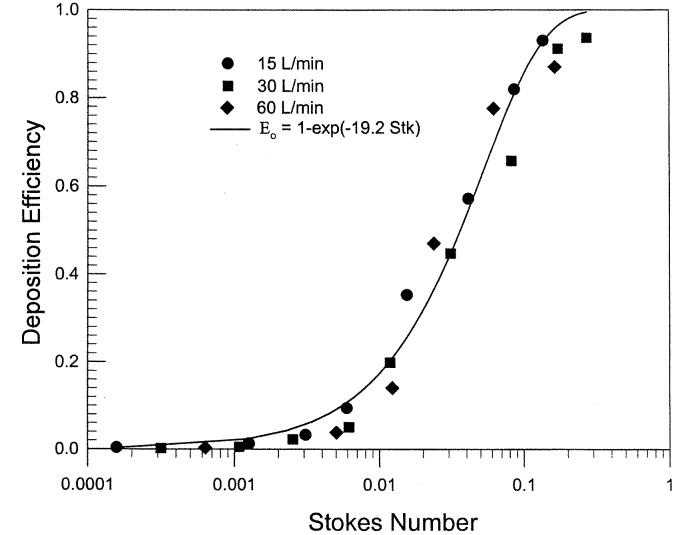
Deposition data were obtained using two nasal airway replicas made from MRI scans with detailed airway dimensions (Swift 1991). These models extended from the nostril entrance to the end of the nasopharyngeal passage and were constructed using a series of 3 mm coronal magnetic resonance imaging (MRI) scans of the nasal airways of a normal 53-year-old male and a normal 6-week-old female infant. The replicas were composed of 3 mm thick clear plastic layers. Constant inspiratory flow rates of 7–50 L min−1 and 5–20 L min−1 were used for the deposition study. Deposition efficiency in the nasal replicas is plotted as a function of the impaction parameter, (Figure 1). Data from the different flow rates for the adult and child replicas collapse into a single curve. Furthermore, the deposition efficiency for the infant cast was higher than the adult values for the same impaction parameter. Our hypothesis is that the difference in deposition is due to nasal airway geometry. Assuming that the critical dimension is the minimum cross-sectional area in the nasal passage (Swift 1991), a dimensionless Stokes number can be calculated as a function of the aerodynamic diameter (da), flow rate (Q), and the minimum cross-sectional area (Amin). Amin of the adult and infant airway replicas obtained by MRI scans are 1.61 and 0.54 cm2, respectively (Swift 1991). When the deposition efficiency is plotted against the Stk (Figure 2), both sets of deposition data appeared to fall into a single curve similar to Equation (6):
| [9] |
The constant (110 ± 2.6) (mean ± SEM) was obtained using a nonlinear regression procedure of SigmaPlot software (SPSS). The value of r2 is 0.97, indicating good fit. This suggests that impaction deposition is the dominant deposition mechanism in the nasal airway passage for particles > 1.0 μm.
Figure 1.
Nasal deposition efficiency as a function of impaction parameter for adult and child airway replicas (Swift 1991).
Figure 2.
Nasal deposition efficiency as a function of Stokes number for adult and child airway replicas (Swift 1991).
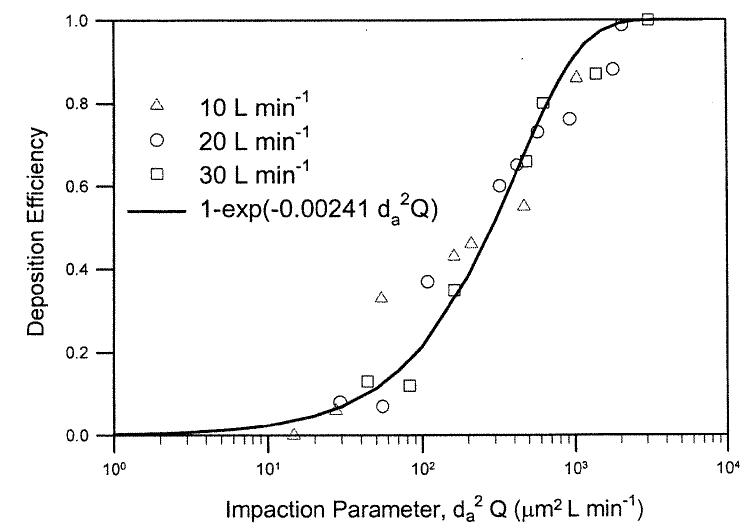
The next step is to look at the in vivo nasal deposition data in human volunteers. Four deposition studies (Landahl and Black 1947; Pattle 1961; Hounam etal. 1971; Heyder and Rudolf 1977) provided enough data sets to cover a sufficient range of particle sizes and flow rates for testing the model. These data sets did not include information on airway dimensions, but did have sufficient information to test Equation (10). The inspiratory nasal deposition efficiency for a subject in Pattle's study (1961) can be shown as a unique function of the impaction parameter, (Figure 3). The data can be fitted with the following equation:
| [10] |
where a′ = 0.00241 ± 0.002 (mean ± SEM) and r2 = 0.94, indicating a good fit. Assuming that Equation (9) is the correct expression for the impaction deposition in the human nasal airway, we can equate the Equations (9) and (10), and calculate the Amin of the nasal airway for the human subject used in Pattle's study:
| [11] |
In this case, a′ = 0.00241 and Amin = 2.55 cm2. Similarly, inspiratory nasal deposition data for three subjects in a study reported by Hounam et al. (1971) and mean values of six subjects reported by Landahl and Black (1947) could also be fitted by the same expression and calculated Amin listed in Table 1.
Figure 3.
Nasal deposition efficiency as a function of impaction parameter for an adult human volunteer (Pattle 1961).
Table 1.
Impaction deposition data in the human nasal airway
| Subject | a′ (constant) | r2 | Amin (cm2) |
|---|---|---|---|
| Landahl and Black (1947) | 0.00148 | 0.90 | 3.52 |
| Pattle (1961) | 0.00241 | 0.94 | 2.55 |
| Heyder and Rudolf (1977) | 0.00839 | 0.93 | 1.11 |
| Subject 1 | |||
| Heyder and Rudolf (1977) | 0.00391 | 0.88 | 1.85 |
| Subject 3 | |||
| Heyder and Rudolf (1977) | 0.00319 | 0.97 | 2.12 |
| Subject 5 | |||
| Heyder and Rudolf (1977) | 0.00403 | 0.96 | 1.81 |
| Subject 6 | |||
| Hounam et al. (1971) | 0.00128 | 0.72 | 3.90 |
| Subject A | |||
| Hounam et al. (1971) | 0.00133 | 0.88 | 3.79 |
| Subject B | |||
| Hounam et al. (1971) | 0.00175 | 0.91 | 3.16 |
| Subject C | |||
| Mean | 0.00309 | 2.16 | |
| SD | 0.00233 | 1.00 |
.
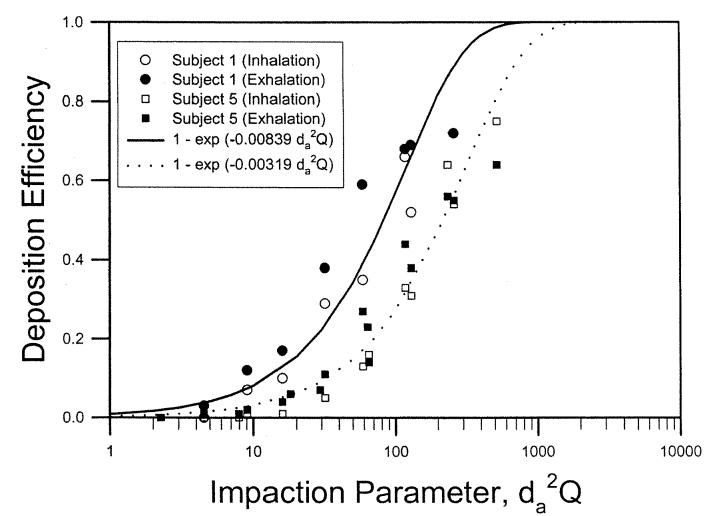
Heyder and Rudolf (1977) measured both inspiratory and expiratory nasal deposition data in four adult male subjects. Figure 4 shows deposition data for subjects 1 and 5 as a function of the impaction parameter. Equation (10) was used to fit the deposition data for the inspiratory and expiratory flows. Best-fitted values of a′ for the inspiratory and expiratory flows were compared using the one-way analysis of covariance as described in Methods, and the F value was calculated. The statistical analysis indicated that nasal deposition for the flows was not significantly different for subjects 1,5, and 6, but was significantly different at p < 0.05 for subject 3. Combining all data from the four subjects, we showed that the inspiratory and expiratory nasal depositions were not statistically different (data not shown). Table 1 lists the fitted parameter for the four subjects using the combined deposition data for inspiratory and expiratory flows. This analysis indicates that the assumption used in most lung deposition models for equal nasal deposition efficiency for the inspiratory and expiratory flows is reasonable.
Figure 4.
Nasal deposition efficiency as a function of impaction parameter for two adult human volunteers (Heyder and Rudolf 1977).
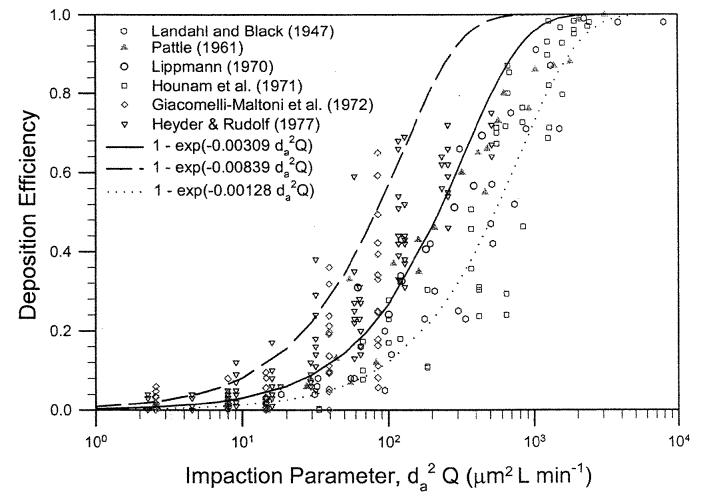
Based on the analysis of nasal deposition in human volunteers, we show that the deposition data can be expressed in Equation (10). The fitted equation shows a large variation in the magnitude of the deposition values as indicated by the fitted constant values ranging from 0.00128–0.00839. The mean and SD are 0.00309 ± 0.00233. If we assume that the airway dimension causes the variability of nasal deposition and Equation (9) is the correct mathematical expression for impaction deposition, then the corresponding value of the minimum cross-sectional area in the nasal airway for each subject can be calculated using Equation (11). Table 1 lists values of Amin for the nine subjects (one report by Landahl and Black [1947] is a mean value of six subjects) ranging from 1.11–3.90 cm2. The value of Amin corresponding to the mean value of a′ = 0.00309 is 2.11 cm2. K.H.Cheng etal. (1996) reported measurement of the nasal airway dimensions of 10 adult male volunteers using MRI scans. The value of Amin ranged from 1.28–3.10 cm2 with a mean value of 2.08 cm2. The calculated values of Amin from this analysis of deposition data are basically in the same range, indicating that the values were reasonable. Figure 5 shows a summary of in vivo nasal deposition data with the mathematical expression, . The center curve is for a mean value of 0.00309 (Amin = 2.16 cm2) and the curves for upper and lower bounds corresponding to 0.00839 (Amin = 1.11 cm2) and 0.00128 (Amin = 3.90 cm2). Nasal airway is a dynamic filter. Its dimensions change during breathing. As a result, there exist considerable intrasubject variability in the in vivo data set. The results obtained here represent an estimate under the experimental conditions.
Figure 5.
Summary of nasal deposition efficiency as a function of impaction parameter in human volunteers.
Nasal Deposition in the Diffusion Regime
For diffusion deposition, in vivo deposition data in adult, male volunteers for particles ≤0.2 μm (Cheng, K. H. et al. 1996) and for radon progeny (Swift and Strong 1996) were used to derive the following equation:
| [12] |
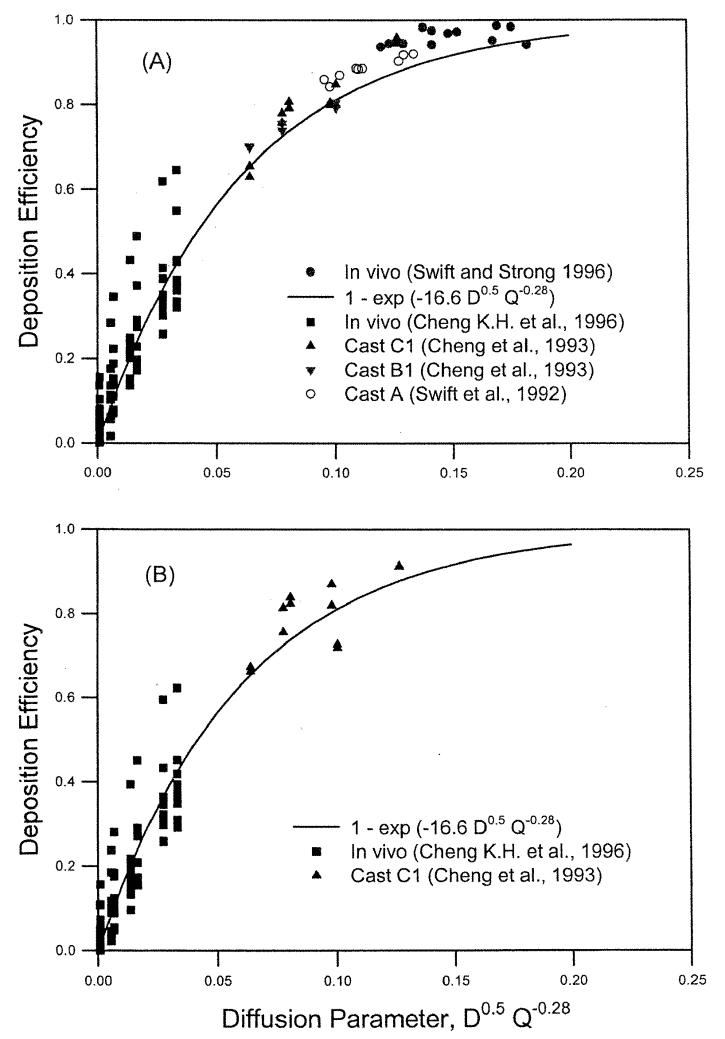
where r2 = 0.90, indicating a reasonably good fit. The functional form of the diffusion coefficient, D0.5, is the same as previously obtained for deposition measurements in nasal airway replicas (Cheng et al. 1993), whereas the functional form of the flow rate, Q−0.28, is slightly different from those obtained in human nasal airway replicas (Q−0.125) (Cheng et al. 1993). To compare the inspiratory and expiratory nasal depositions, ultra-fine particle deposition data from 10 human volunteers reported by K. H. Cheng et al. (1996) and radon progeny deposition from one airway replica (Model C1) reported by Cheng et al. (1993) were used. An equation of En = 1 − exp(−bD0.5Q−0.28) was used to fit the inspiratory, expiratory, and combined data. The best-fitted values of b were 17.0 ± 0.9 and 15.7 ± 0.7, for the inspiratory and expiratory flow, respectively, which were not statistically different from each other (p < 0.05). Therefore, we could state that nasal deposition for the inspiratory and expiratory flows at the diffusion regime was the same. Figure 6 shows the reported data for nasal deposition obtained in human volunteers and replicas in the diffusion regime for inspiratory and expiratory flows (Swift 1991; Cheng et al. 1993; Swift and Strong 1996; Cheng, K. H. et al. 1996).
Figure 6.
Nasal deposition efficiency as a function of diffusion parameter for radon progeny and ultrafine particles in human volunteers and airway replicas for inspiratory flow (A) and expiratory flow (B).
Figure 6 showed that for the same value of the diffusion parameter, D0.5Q−0.28, the deposition efficiency measured for the 10 human volunteers (Cheng, K. H. et al. 1996) showed considerable variation. The nasal airway dimensions were measured using MRI scans, and the nasal deposition could be correlated with an averaged shape factor of the turbinate region, defined as the ratio of the airway perimeter to a reference perimeter or a normalized surface area (Cheng, K. H. et al. 1996). The shape factors were obtained from in vivo MRI scans of the human subjects under study. The following equation was used to fit the nasal deposition data for 10 human volunteers (Cheng, K. H. etal. 1996):
| [13] |
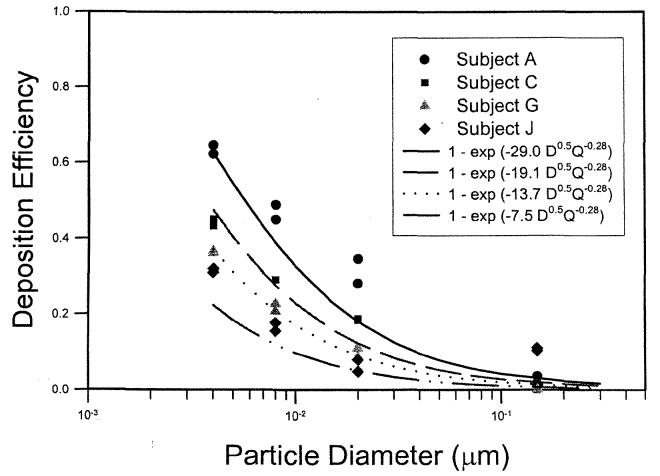
where k = 0.355 ± 0.096, m = 4.14 ± 0.28, and r2 = 0.87. Table 2 lists the nasal airway dimensions of the 10 adult subjects in the study of K. H. Cheng et al. (1996). Comparing Equations (12) and (13), one obtains a = . For deposition data of each volunteer, the value of a was calculated and listed in Table 2. The variability of the nasal deposition can be then shown in Figure 7. This analysis suggested that by using the appropriate characteristic dimension, Sf, one can predict the variability of in vivo nasal deposition fairly well.
Table 2.
Diffusion deposition data in the human nasal airway (Cheng, K.H. et al. 1996)
| Subject | As (cm2) | Amin (cm2) | Sf | a |
|---|---|---|---|---|
| A | 263.9 | 2.28 | 2.90 | 29.0 |
| B | 228.9 | 1.65 | 2.76 | 23.7 |
| C | 237.7 | 2.42 | 2.62 | 19.1 |
| D | 216 | 2.21 | 2.60 | 18.5 |
| E | 210.5 | 1.87 | 2.45 | 14.5 |
| F | 219.3 | 3.10 | 2.56 | 17.3 |
| G | 183.7 | 2.06 | 2.42 | 13.7 |
| H | 214.7 | 1.54 | 2.29 | 10.9 |
| I | 204.8 | 1.28 | 2.38 | 12.8 |
| J | 189.5 | 2.37 | 2.09 | 7.5 |
| Mean | 216.9 | 2.08 | 2.51 | 16.7 |
| SD | 23.2 | 0.52 | 0.23 | 6.3 |
.
As, surface area of the nasal passage; Amin, minimum cross-sectional area of the nasal passage; Sf, the average shape factor of the turbinate region.
Figure 7.
Inspiratory nasal deposition efficiency as a function of particle size at a 10 L min−1 inspiratory flow for four human volunteers (Cheng, K. H. et al. 1996).
Oral Deposition in the Impaction Regime
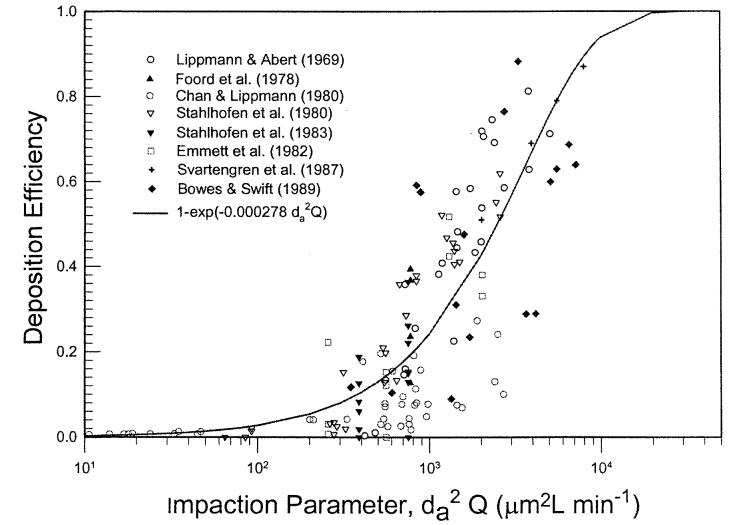
There were many in vivo regional deposition studies for mouth-breathing using adult human volunteers (Lippmann and Albert 1969; Foord et al. 1978; Chan and Lippmann 1980; Stahlhofen et al. 1980, 1983; Emmett et al. 1982; Svartengren et al. 1987; Bowes and Swift 1989). One can calculate the deposition efficiency in the oropharyngeal airway by assuming that either the exhalation deposition was zero (Yu et al. 1981) or that the deposition efficiencies for inspiratory and expiratory flows were the same (ICRP 1994; NCRP 1997). It is reasonable to assume equal deposition efficiency for oral deposition in the absence of specific data. In these studies, there was no information on the oral airway dimensions. The oral deposition efficiency was measured in an in vitro deposition study using a physical airway replica consisting of the oral passage, larynx, and upper tracheobronchial airway from a cadaver with a defined geometry (Cheng et al. 1999). Figure 8 shows the oral deposition efficiency as a function of the Stokes number :
| [14] |
where the velocity U was calculated using the average cross-sectional area (4.43 cm2) of the entire oropharyngeal airway, and the characteristic length L is the equivalent diameter from the averaged cross-sectional area, r2 = 0.98, indicating a very good fit. The oral airway can be viewed as a curved tube of varying diameter, which would have a mathematical form as in Equation (14) (Cheng et al. 1999). Equation (14) can be simplified to give the following expression as a function of the impaction parameter, :
| [15] |
Figure 8.
Oral deposition efficiency as a function of Stokes number for an adult airway replica (Cheng et al. 1999).
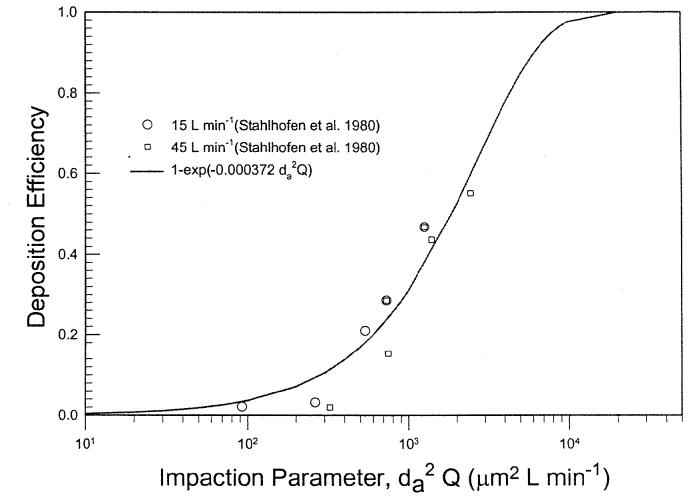
Figure 9 shows oral deposition efficiency obtained from subject 4 of a study reported by Stahlhofen et al. (1980) for two flow rates. The figure shows that the data can be expressed by the same mathematical form. Similar results were obtained for the data from two other subjects in the same study. Figure 10 depicts a summary of in vivo oral deposition data expressed as a function of the impaction parameter. The scatter of data indicates variation in oral deposition efficiency among subjects. At the present time, there is no information on how to express the deposition as a function of the oral airway dimension. The mean value of the deposition data can be expressed as:
| [16] |
where r2 = 0.65. In vivo deposition through mouth was frequently conducted with the use of a mouth tube. This may differ considerably from the natural mouth breathing in terms of the opening of the mouth and its geometry. This would need to be examined in the future analysis.
Figure 9.
Oral deposition efficiency as a function of impaction parameter for an adult human subject (Stahlhofen et al. 1980).
Figure 10.
Summary of oral deposition efficiency as a function of impaction parameter in human volunteers.
Oral Deposition in the Diffusion Regime
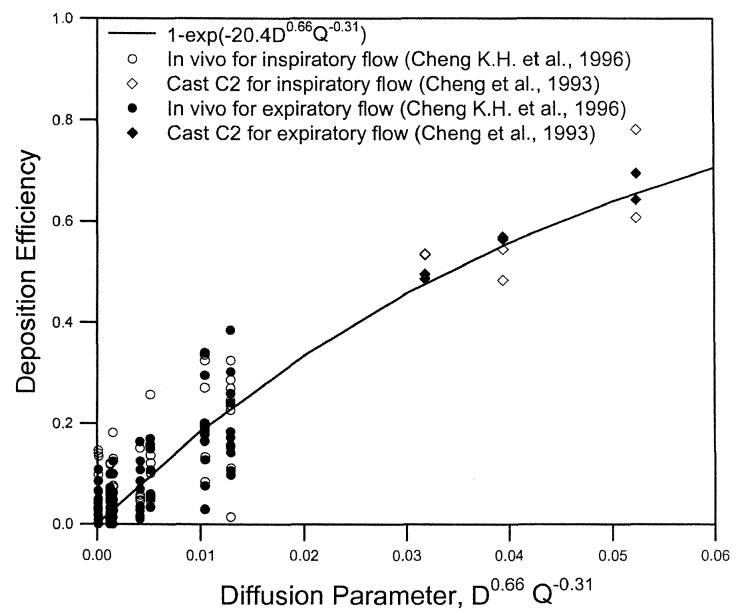
For diffusion deposition, in vivo deposition data in 10 adult, male volunteers for ultrafine particles ≤0.2 μm (Cheng, K. H. et al. 1996) and an airway replica (Replica C2) for radon progeny (Cheng et al. 1993) were used to derive the following equation:
| [17] |
where r2 = 0.83, indicating a reasonable fit. To compare the inspiratory deposition to the expiratory oral deposition, the same two sets of data were used. The equation of E0 = 1 − exp(−bD0.66Q−0.31) was used to fit the inspiratory, expiratory, and combined data. The best-fitted values of b were 21.0 ± 1.1 and 19.8 ± 0.9 for the inspiratory and expiratory flows, respectively, which were not statistically different from each other (p < 0.05). Therefore, we could state that oral deposition for the inspiratory and expiratory flows in the diffusion regime was the same. Figure 11 shows data reported for oral deposition in human volunteers for ultrafine particles and airway replicas for radon progeny for inspiratory and expiratory flows (Cheng et al. 1993; Cheng, K. H. et al. 1996). Figure 10 also shows that for the same value of the diffusion parameter, D0.66Q−O.31, the deposition efficiency measured for the 10 human volunteers (Cheng, K. H. et al. 1996) showed considerable variation. However, no information was reported on the airway dimensions of the oral passage for these subjects, and therefore the relationship is unknown between the oral deposition efficiency and airway dimensions.
Figure 11.
Oral deposition efficiency as a function of diffusion parameter for radon progeny and ultrafine particles in human volunteers and airway replicas for inspiratory and expiratory flows.
CONCLUSIONS
This analysis shows that by combining the deposition data from human volunteers and physical casts, deposition mechanisms could be better defined. For particles >0.5 μm, impaction is the dominant mechanism, and deposition is a function of the Stokes number. For particles ≤0.5 μm, diffusion is dominant, and deposition is a function of the Schmidt and Reynolds numbers. Based on in vivo deposition data, the inspiratory and expiratory deposition efficiencies in the nasal and oral airways are not significantly different. Furthermore, the intersubject variability of nasal deposition can be predicted when characteristic airway dimensions for impaction and diffusion are known.
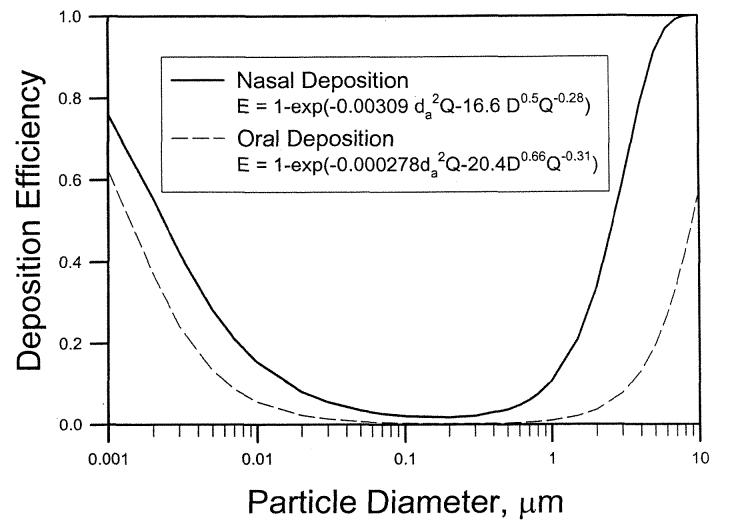
For the impaction-dominant regime, the minimum cross-sectional area is the critical dimension, because the nasal deposition for large particles can be modeled as deposition in a constricted tube or orifice, where the orifice area or diameter is the critical dimension in calculating the Stokes number (Kim etal. 1984; Ito etal. 1985; Sato etal. 2002). On the other hand, the critical dimension in the diffusion-dominant regime in the nasal region is a normalized surface area, indicating that the diffusion deposition in a turbinate region with large surface area is important. Additional studies of oral deposition should be pursued to understand the intersubject variability in the oropharyngeal region. The deposition equations developed in this report could be used in lung deposition models to calculate regional deposition patterns. The nasal deposition equations could be used to evaluate the influences of intersubject variation on inhaled doses. For an adult human subject the regional deposition efficiency of nasal and oral region can be expressed as:
| [18] |
| [19] |
Figure 12 shows the deposition efficiency as a function of particle size using Equations (18) and (19) for nasal and oral breathing at 30 L min−1.
Figure 12.
Deposition efficiency as a function of particle size for nasal (Equation (18)) and oral (Equation (19)) breathing at 30 L min−1.
Acknowledgments
This research is supported by the U.S. National Institute of Environmental Health Sciences program project P01-ES10594ZES1 and National Institute for Occupational Safety and Health grant ROl OH03900-01A1.
REFERENCES
- Bowes SM, Swift DL. Deposition of Inhaled Particles in the Oral Airway During Oronasal Breathing. Aerosol Sci. Technol. 1989;11:157–167. [Google Scholar]
- Chan TL, Lippmann M. Experimental Measurements and Empirical Modeling of the Regional Deposition of Inhaled Particles in Humans. Am. lnd. Hyg. Assoc. J. 1980;41:399–409. doi: 10.1080/15298668091424942. [DOI] [PubMed] [Google Scholar]
- Cheng KH, Cheng YS, Yeh HC, Guilmette RA, Simpson SQ, Yang SQ, Swift DL. In Vivo Measurements of Nasal Airway Dimensions and Ultrafine Aerosol Depositing in Human Nasal and Oral Airways. J. Aerosol Sci. 1996;27:785–801. [Google Scholar]
- Cheng KH, Cheng YS, Yeh HC, Swift DL. Measurements of Airway Dimensions and Calculation of Mass Transfer Characteristics of the Human Oral Passage. J. Biomed. Eng. 1997;119:475–482. doi: 10.1115/1.2798296. [DOI] [PubMed] [Google Scholar]
- Cheng YS, Fu C, Yazzie D, Zhou Y. Respiratory Deposition Patterns of Salbutamol pMDI with CFC and HFA-134a Formulations in a Human Airway Replica. J. Aerosol Med. 2001a;14:255–266. doi: 10.1089/08942680152484180. [DOI] [PubMed] [Google Scholar]
- Cheng YS, Holmes TD, Gao J, Guilmette RA, Li S, Surakitbanharn Y, Rowlings C. Characterization of Nasal Spray Pumps and Deposition Pattern in a Replica of the Human Nasal Airway. J. Aerosol Med. 2001b;14:267–270. doi: 10.1089/08942680152484199. [DOI] [PubMed] [Google Scholar]
- Cheng YS, Su YF, Yeh HC, Swift DL. Deposition of Thoron Progeny in Human Head Airways. Aerosol Sci. Technol. 1993;18:359–375. [Google Scholar]
- Cheng YS, Yamada Y, Yeh HC. Deposition of Ultrafine Aerosols in a Human Oral Cast. Aerosol Sci. Technol. 1990;12:1075–1081. [Google Scholar]
- Cheng YS, Yamada Y, Yeh HC, Swift DL. Diffusional Deposition of Ultrafine Aerosols in a Human Nasal Cast. J. Aerosol Sci. 1988;19:741–751. [Google Scholar]
- Cheng YS, Yeh HC, Guilmette RA, Simpson SQ, Cheng KH, Swift DL. Nasal Deposition of Ultrafine Particles in Human Volunteers and Its Relationship to Airway Geometry. Aerosol Sci. Technol. 1996;25:274–291. [Google Scholar]
- Cheng YS, Yeh HC, Swift DL. Aerosol Deposition in Human Nasal Airway for Particles 1 nm to 20 μm. Radiat. Prot. Dosim. 1991;38:41–47. [Google Scholar]
- Cheng YS, Zhou Y, Chen BT. Particle Deposition in a Cast of Human Oral Airways. Aerosol Sci. Technol. 1999;31:286–300. [Google Scholar]
- Christensen R. Analysis of Variance, Design, and Regression. Chapman and Hall; London, UK: 1996. [Google Scholar]
- Clark AR, Newman SP, Dasovich N. Mouth and Oropharyngeal Deposition of Pharmaceutical Aerosols. J. Aerosol Med. 1998;11:S116–S121. [PubMed] [Google Scholar]
- Emmett PC, Aitken RJ, Hannan WJ. Measurements of the Total and Regional Deposition of Inhaled Particles in the Human Respiratory Tract. J. Aerosol Sci. 1982;13:549–560. [Google Scholar]
- Foord N, Black A, Walsh M. Regional Deposition of 2.5–7.5 μm Diameter Inhaled Particles in Healthy Male Non-Smokers. J. Aerosol Sci. 1978;9:283–290. [Google Scholar]
- Guilmette RA, Cheng YS, Griffith WC. Characterizing the Variability in Adult Human Nasal Airway Dimensions. Ann. Occup. Hyg. 1997;41(Suppl l):491–496. [Google Scholar]
- Guilmette RA, Wicks JD, Wolff RK. Morphometry of Human Nasal Airways In Vivo Using Magnetic Resonance Imaging. J. Aerosol Med. 1989;2:365–377. [Google Scholar]
- Heyder J, Rudolf G. Inhaled Particle IV, Pergamon Press; Oxford: 1977. Deposition of Aerosol in the Human Nose; pp. 107–125. [PubMed] [Google Scholar]
- Hounam RF, Black A, Walsh M. Deposition of Aerosol Particles in the Nasopharyngeal Region of the Human Respiratory Tract. J. Aerosol Sci. 1971;2:341–352. [PubMed] [Google Scholar]
- ICRP . Human Respiratory Tract Model for Radiological Protection, Publication 66, Annals of ICRP. Pergamon; London, UK: 1994. [Google Scholar]
- Ito H, Smaldone GC, Swift DL, Wagner HN., Jr. Quantitative Evaluation of Aerosol Deposition in Constricted Tube. J. Aerosol Sci. 1985;16:167–174. [Google Scholar]
- Kesavanathan J, Bascom R, Swift DL. The Effect of Nasal Passage Characteristics on Particle Deposition. J. Aerosol Med. 1998;11:27–39. doi: 10.1089/jam.2000.13.17. [DOI] [PubMed] [Google Scholar]
- Kim CS, Lewars GG, Eldridge MA, Sackner MA. Deposition of Aerosol Particle in a Straight Tube with an Abrupt Obstruction. J. Aerosol Sci. 1984;15:167–176. [Google Scholar]
- Landahl HD, Black S. Penetration of Air-Bome Particulates Through the Human Nose. J. Ind. Hyg. Toxicol. 1947;29:269–277. [PubMed] [Google Scholar]
- Lippmann M, Albert RE. The Effect of Particle Size on the Regional Deposition of Inhaled Aerosols in the Human Respiratory Tract. Am. Ind. Hyg. Assoc. J. 1969;30:257–275. doi: 10.1080/00028896909343120. [DOI] [PubMed] [Google Scholar]
- NCRP . Deposition, Retention, and Dosimetry of Inhaled Radioactive Substances. National Council on Radiation Protection and Measurements; Bethesda, MD: 1997. (NCRP Report No. 125). [Google Scholar]
- Pattle RE. The Retention of Gases and Particles in the Human Nose. In: Davies CN, editor. Inhaled Particles and Vapours, Pergamon Press; Oxford, UK: 1961. pp. 302–309. [Google Scholar]
- Sato S, Chen DR, Pui DYH. Particle Transport at Low Pressure: Particle Deposition in a Tube with an Abrupt Contraction. J. Aerosol Sci. 2002;33:659–671. [Google Scholar]
- Stahlhofen W, Gebhart J, Heyder J. Experimental Determination of the Regional Deposition of Aerosol Particles in the Human Respiratory Tract. Am. Ind. Hyg. Assoc. J. 1980;41:385–398. doi: 10.1080/15298668091424933. [DOI] [PubMed] [Google Scholar]
- Stahlhofen W, Gebhart J, Heyder J, Scheuch G. New Regional Deposition Data of the Human Respiratory Tract. J. Aerosol Sci. 1983;14:186–188. [Google Scholar]
- Svartengren M, Falk R, Linnman L, Philipson K, Camner P. Deposition of Large Particles in Human Lung. Exp. Lung Res. 1987;12:75–88. doi: 10.3109/01902148709068815. [DOI] [PubMed] [Google Scholar]
- Swift DL. Inspiratory Inertial Deposition of Aerosols in Human Airway Replicate Casts: Implication for the Proposed NCRP Lung Model. Radiat. Prot. Dosim. 1991;38:29–34. [Google Scholar]
- Swift DL, Montassier N, Hopke PK, Kim KH, Cheng YS, Su YF, Yeh HC, Strong JC. Inspiratory Deposition of Ultrafine Particles in Human Nasal Replicate Casts. J. Aerosol Sci. 1992;23:65–72. [Google Scholar]
- Swift DL, Strong JC. Nasal Deposition of Ultrafine 218Po Aerosols in Human Subjects. J. Aerosol Sci. 1996;27:1125–1132. [Google Scholar]
- Task Group on Lung Dynamics Deposition and Retention Models for Internal Dosimetry of the Human Respiratory Tract. Health Phys. 1966;29:673–680. [PubMed] [Google Scholar]
- Yamada Y, Cheng YS, Yeh HC, Swift DL. Inspiratory and Expiratory Deposition of Ultrafine Particles in a Human Nasal Cast. Inhal. Toxicol. Premier Issue. 1988;1:1–11. [Google Scholar]
- Yeh HC, Cuddihy RG, Phalen RF, Chang IY. Comparisons of Calculated Respiratory Tract Deposition of Particles Based on the Proposed NCRP Model and ICRP 66 model. Aerosol Sci. Technol. 1996;25:134–140. [Google Scholar]
- Yu CP, Diu CK, Soong TT. Statistical Analysis of Aerosol Deposition in Nose and Mouth. Am. Ind. Hyg. Assoc. J. 1981;42:726–733. doi: 10.1080/15298668191420602. [DOI] [PubMed] [Google Scholar]


