Abstract
The role of autophagy in oncogenesis remains ambiguous, and mechanisms that induce autophagy and regulate its outcome in human cancers are poorly understood. The maternally imprinted Ras-related tumor suppressor gene aplasia Ras homolog member I (ARHI; also known as DIRAS3) is downregulated in more than 60% of ovarian cancers, and here we show that re-expression of ARHI in multiple human ovarian cancer cell lines induces autophagy by blocking PI3K signaling and inhibiting mammalian target of rapamycin (mTOR), upregulating ATG4, and colocalizing with cleaved microtubule-associated protein light chain 3 (LC3) in autophagosomes. Furthermore, ARHI is required for spontaneous and rapamycin-induced autophagy in normal and malignant cells. Although ARHI re-expression led to autophagic cell death when SKOv3 ovarian cancer cells were grown in culture, it enabled the cells to remain dormant when they were grown in mice as xenografts. When ARHI levels were reduced in dormant cells, xenografts grew rapidly. However, inhibition of ARHI-induced autophagy with chloroquine dramatically reduced regrowth of xenografted tumors upon reduction of ARHI levels, suggesting that autophagy contributed to the survival of dormant cells. Further analysis revealed that autophagic cell death was reduced when cultured human ovarian cancer cells in which ARHI had been re-expressed were treated with growth factors (IGF-1, M-CSF), angiogenic factors (VEGF, IL-8), and matrix proteins found in xenografts. Thus, ARHI can induce autophagic cell death, but can also promote tumor dormancy in the presence of factors that promote survival in the cancer microenvironment.
Introduction
Defects in programmed cell death (PCD) can promote oncogenesis and resistance to chemotherapy. Apoptosis (type I PCD) has been well studied as a caspase-regulated cellular response to environmental stress and to the activation of oncogenes. Autophagy (type II PCD) is characterized by the accumulation of multi-lamellar vesicles that engulf cytoplasm and organelles, forming autophagosomes marked by microtubule-associated protein light chain 3 (LC3) (1, 2). Autophagosomes then fuse with lysosomes, releasing their contents for hydrolysis. Autodigestion of intracellular proteins and lipids can temporarily sustain energy production by stressed cells, but can prove lethal if prolonged (3, 4).
Controversy persists regarding whether autophagy induces the death of cancer cells or promotes their survival (5, 6). Autophagic cell death can occur in response to chemotherapeutic agents (7); however, autophagy may also permit survival of cancer cells in response to environmental stress or cytotoxic drugs (5, 8, 9). Several tumor suppressor genes have been implicated in autophagy of human cancers. For example, beclin 1, TP53, death-associated protein kinase, and PTEN can all contribute to autophagic pathways, and loss of their function could inhibit the induction of autophagy (10–12) and increase the incidence of cancer (12).
Our group has identified aplasia Ras homolog member I (ARHI; also known as DIRAS3), a maternally imprinted tumor suppressor gene that is expressed by normal ovarian surface epithelial (NOSE) cells. Expression of ARHI is lost or markedly downregulated in 60%–70% of ovarian and breast cancers through loss of heterozygosity, DNA methylation, transcriptional regulation, and shortened mRNA half-life (13–17). Loss of ARHI expression is associated with tumor progression and poor prognosis (15, 16). ARHI encodes a 26-kDa GTPase with 55%–62% homology to Ras and Rap. In contrast to Ras, however, ARHI inhibits cancer cell growth, motility, and invasion. Distinct from other Ras family members, ARHI contains a unique 34–amino acid extension at its N terminus that is required to inhibit cell growth (18). Re-expression of ARHI in cancer cells inhibits signaling through the Ras/MAP pathway, induces p21WAF1/CIP1, and downregulates cyclin D1 (13, 18). Marked overexpression of ARHI using an adenovirus system induces caspase-independent, calpain-dependent apoptosis (19), but the effect of re-expressing physiologic levels of ARHI comparable with those in NOSE cells has not to our knowledge been explored.
Using transient expression of ARHI and stable ovarian cancer cell lines in which ARHI expression can be induced to its physiologic levels, we demonstrate that expression of ARHI induces autophagy, but not apoptosis, in cultured cancer cells and in xenografts. Re-expression of ARHI affects PI3K/AKT/mammalian target of rapamycin (PI3K/AKT/mTOR) and AMPK/TSC1/TSC2 signaling pathways implicated in autophagy, activates the ATG4 cysteine protease, and colocalizes with its cleavage product LC3-II on autophagosomes. Whereas expression of ARHI in cultured cells induces autophagic cell death, ARHI sustains dormant cancer cell survival for weeks in vivo. Therefore, the survival of dormant cancer cells may be a critical factor contributing to the poor prognosis of ovarian cancer patients. Our studies suggest that growth factors, cytokines, and stromal proteins in the in vivo microenvironment contribute to determine the fate of autophagic cells.
Results
Expression of ARHI inhibits growth of ovarian cancer cells.
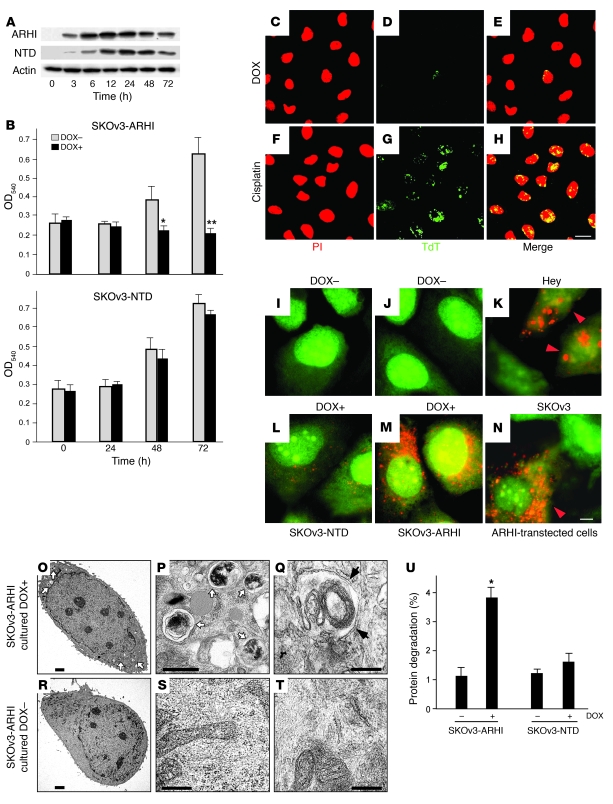
We have developed stable sublines of SKOv3 ovarian cancer cells with Tet-on inducible expression of ARHI (SKOv3-ARHI) or its N-terminal deletion mutant (SKOv3-NTD). Incubation of each subline with 1 μg/ml of doxycycline (DOX) produced stable physiologic levels of ARHI or N-terminal–deleted ARHI (NTD) (Figure 1A), comparable with those in NOSE cells (Supplemental Figure 1; supplemental material available online with this article; doi: 10.1172/JCI35512DS1). Induction of ARHI expression, but not NTD, inhibited cell proliferation (Figure 1B). The failure of NTD to inhibit cell growth provides an important specificity control and demonstrates the requirement for the N-terminal region of ARHI in growth inhibition in these and subsequent studies.
Figure 1. Expression of ARHI induces autophagy in ovarian cancer cells.
(A) Kinetics of induction of ARHI. Lysates from SKOv3-ARHI or SKOv3-NTD cells cultured with DOX for the indicated time periods were probed for ARHI or NTD on western blots. (B) Cell proliferation of inducible ovarian cancer cells in the presence of DOX (DOX+) or absence of DOX (DOX–). *P < 0.05, **P < 0.01 compared with no DOX. (C–H) DOX (1 μg/ml) or cisplatin (5 μg/ml) was added to cultured SKOv3-ARHI cells for 72 hours. Propidium iodide (PI) staining and terminal dUTP transferase (TdT) assay were used to detect apoptosis. Scale bar: 10 μm. (I–N) Inducible SKOv3 cells were stained with acridine orange and examined by fluorescence microscopy. Large orange punctate spots were considered to be AVOs, markers for autophagosomes. (K and N) Hey and SKOv3 cells, transfected with pcDNA3-ARHI and incubated for 48 hours, were stained with acridine orange to visualize AVOs (orange arrowheads). (I, J, L, and M) No AVOs were seen in nontransfected cells (data not shown). Scale bar: 1 μm. (O–T) TEM images of induced and uninduced SKOv3-ARHI cells. White arrows indicate autophagosome vesicles, and black arrows indicate typical double-membrane of autophagosome. Scale bars: 5 μm (O and R); 1 μm (P and S); 500 nm (Q and T). (U) Expression of ARHI increases degradation of long-lived proteins. SKOv3-ARHI or -NTD cells were labeled with [35S]-methionine/cysteine for 6 hours after incubation with or without DOX for 48 hours. Data are representative of the mean ± SEM from at least 3 experiments. *P < 0.05.
Re-expression of ARHI induces autophagy in cultured cells.
Re-expression of ARHI at physiologic levels in SKOv3-ARHI cells did not induce significant apoptosis, even after 72 hours of induction (Figure 1D). Apoptosis could, however, be readily induced in SKOv3-ARHI cells by cisplatin (Figure 1G), indicating intact apoptotic pathway(s) in these cells. Induction of ARHI, however, produced cellular changes consistent with autophagy, including development of acidic vesicular organelles (AVOs) (Figure 1, J and M). Similar AVO staining was observed in Hey and SKOv3 cells transiently transfected with ARHI (Figure 1, K and N), but not in nontransfected cells (data not shown), documenting that autophagy can be induced by ARHI in multiple ovarian cancer cell lines. In contrast, only a few AVOs were observed after induction of SKOv3-NTD cells (Figure 1, I and L), consistent with a lack of growth inhibition by the NTD mutant. Ultrastructural studies with transmission electron microscopy (TEM) detected scattered double-membrane vacuolar structures 24 hours after induction of ARHI and more prominent structures 72 hours after induction (Figure 1, O–T). Typical autophagosome vesicles that contained multiple lamellae, intact cytoplasmic structures, and residual digested materials were identified (Figure 1, O and P). In some cells, an “onion-like” lamellar structure (Figure 1Q) or empty vesicles were observed. Consistent with AVO staining, no autophagic vesicles were detected in non-induced SKOv3-ARHI cells (Figure 1, R–T) and substantially fewer and smaller autophagic vesicles were observed in SKOv3-NTD cells (data not shown). As another measure for autophagy, cells with increased autophagic vesicles were associated with enhanced degradation of long-lived proteins (Figure 1U).
To confirm that the observed cellular responses in SKOv3-ARHI cells were mediated by the induced ARHI expression and not unique to SKOv3 cells, we established a second stable ovarian cancer cell line (Hey-ARHI). Similar to SKOv3-ARHI cells, induction of ARHI by DOX in Hey-ARHI cells resulted in inhibition of cell growth, development of AVOs, and the formation of double-membrane autophagosome vesicles (Supplemental Figure 2).
ARHI is required for autophagy.
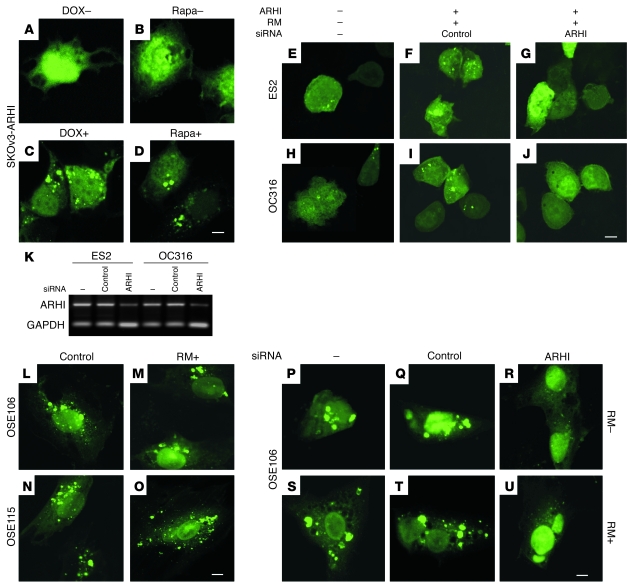
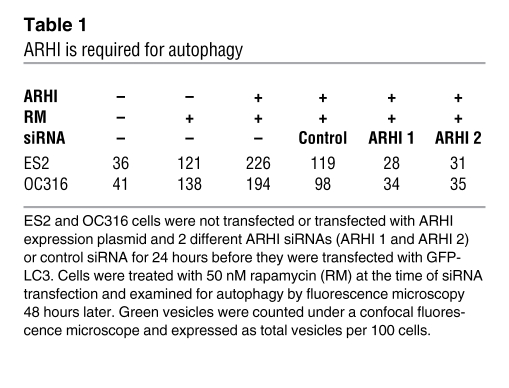
LC3-I is a critical participant in autophagy (20), in which its cleavage product LC3-II, generated by the cysteine protease ATG4, is localized in the autophagosome membrane. Formation of punctate spots with GFP-LC3 fusion protein is a well-characterized marker to visualize autophagosomes and represents the accumulation of a membrane-bound form of LC3 on autophagic vesicles (21, 22). Re-expression of ARHI in stable SKOv3-ARHI cells or in transiently transfected ES2 and OC316 ovarian cancer cells dramatically increased punctate LC3 spots. Inhibition of mTOR with rapamycin also increased autophagic vesicles (Figure 2, B and D). In 2 NOSE cell lines that constitutively expressed ARHI, autophagy occurred spontaneously and was not further increased by rapamycin (Figure 2, L–O). Knockdown of ARHI expression with 2 different siRNAs in ovarian cancer cells and in NOSE cells dramatically reduced autophagic vesicles (Table 1), with or without rapamycin treatment (Figure 2, E–J and P–U, and Supplemental Figure 3A), indicating that ARHI is essential for promoting autophagy. In addition to ovarian cancer cells, U87 glioma cells, which are sensitive to rapamycin-induced autophagy (7), expressed ARHI at significantly higher levels than the rapamycin-resistant U373 glioma cells (Supplemental Figure 3B). Moreover, knockdown of ARHI in U87 cells resulted in a reduced LC3-II conversion. Taken together, our results are consistent with the notion that ARHI plays a critical role in spontaneous and rapamycin-induced autophagy.
Figure 2. ARHI is required for autophagy.
(A–J) ARHI and rapamycin (RM) induce autophagy in ovarian cancer cells. (A–D) SKOv3-ARHI cells were transfected with GFP-LC3 and treated with or without DOX to induce ARHI expression or with or without rapamycin to inhibit mTOR activity. Scale bar: 1 μm. (E–J) ES2 and OC316 cells were not transfected or were transfected with ARHI expression vector and ARHI siRNA or control siRNA for 24 hours before they were transfected with GFP-LC3. Cells were treated with 50 nM rapamycin at the time of siRNA transfection and examined for autophagy by fluorescence microscopy 48 hours later. Scale bar: 1 μm. (K) ARHI expression is necessary for rapamycin-induced autophagy in ovarian cancer cells. ES2 and OC316 ovarian cancer cells were not transfected or were transfected with ARHI or control siRNA for 48 hours. Expression of ARHI and the control GAPDH were examined by RT-PCR. (L–U) NOSE cells undergo spontaneous autophagy. (L–O) Two NOSE cell lines were transfected with GFP-LC3 and treated with or without rapamycin. Scale bar: 1 μm. (P–U) GFP-LC3 plasmid was transfected into OSE106 cells alone or was cotransfected with ARHI siRNA or control siRNA. Transfected cells were treated with or without rapamycin. Scale bar: 1 μm.
Table 1 .
ARHI is required for autophagy
ARHI is associated with LC3 in autophagosomes.
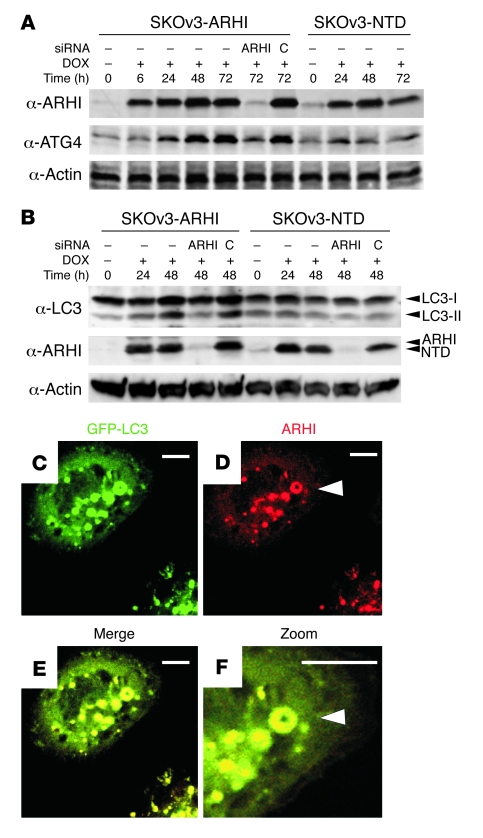
To assess biochemically the role of ARHI in autophagosome formation, SKOv3-ARHI and SKOv3-NTD cells were transfected with GFP-LC3 and then treated with DOX to induce ARHI expression. As shown in Supplemental Figure 3C, expression of ARHI correlated with an increased cleavage of GFP–LC3-I to GFP–LC3-II and a shift of both ARHI and LC3 from the cell-free supernatant to the pelleted fraction that contained membranes and organelles, suggesting that ARHI may promote autophagosome formation. Importantly, ARHI expression was associated with significant upregulation of ATG4 (Figure 3A), a critical protease that processes LC3-I to autophagosome membrane–anchored LC3-II (2). This correlation suggests that ARHI may facilitate autophagosome formation by promoting LC3 maturation through induction of ATG4. Consistent with this notion, transfection of ARHI siRNA reduced the levels of ATG4 and LC3-II in SKOv3-ARHI cells that had been treated with DOX (Figure 3, A and B).
Figure 3. ARHI colocalizes with LC3 in the autophagosome.
(A) ARHI enhances ATG4 expression. SKOv3-ARHI or -NTD cells were treated with DOX and harvested at the indicated times. ARHI or control siRNA was transfected to knockdown ARHI expression. Western blots of ATG4 and ARHI were examined. (B) ARHI is essential for conversion of LC3-I to LC3-II. SKOv3-ARHI and -NTD cells were treated with DOX and transfected with ARHI or control siRNA. Cell lysates were blotted for LC3. (C–F) Colocalization of ARHI and LC3 in autophagosomes. DOX-treated SKOv3-ARHI cells were transfected with pGFP-LC3, stained for ARHI, and examined by fluorescence microscopy. Punctate spots mark LC3 or ARHI localization. Arrowheads indicate a ring-like shape and a colocalized ARHI-LC3 signal. Scale bars: 1 μm.
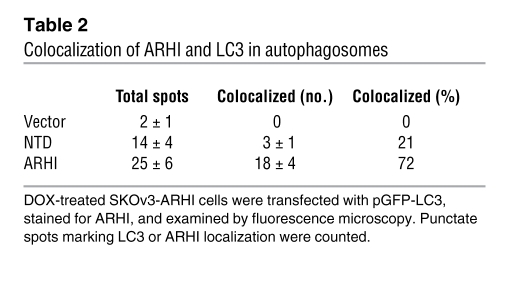
To examine the direct interaction of ARHI and LC3 during autophagosome formation, we performed in-cell photo-crosslinking and found that ARHI was closely associated with LC3 (Supplemental Figure 3D). The NTD mutant also associated with LC3, but the interaction was substantially weaker. Immunofluorescence staining of ARHI in GFP-LC3–transfected SKOv3-ARHI cells or in ES2 and OC316 ovarian cancer cells cotransfected with red fluorescent protein–ARHI and GFP-LC3 plasmids showed that ARHI colocalized with LC3 in “ring-shaped” spots (Figure 3, C–F, and Supplemental Figure 4, A and B), supporting the notion that they colocalize in autophagosomes. With the NTD mutant, substantially fewer colocalization sites were observed (Table 2), and the areas of association were smaller (Supplemental Figure 4A). Autophagosome granules were not observed in control cells that lacked ARHI (Supplemental Figure 4A) or that had not been transfected with GFP-LC3 (Supplemental Figure 4A).
Table 2 .
Colocalization of ARHI and LC3 in autophagosomes
ARHI inhibits PI3K pathway and upregulates TSC1/2 expression.
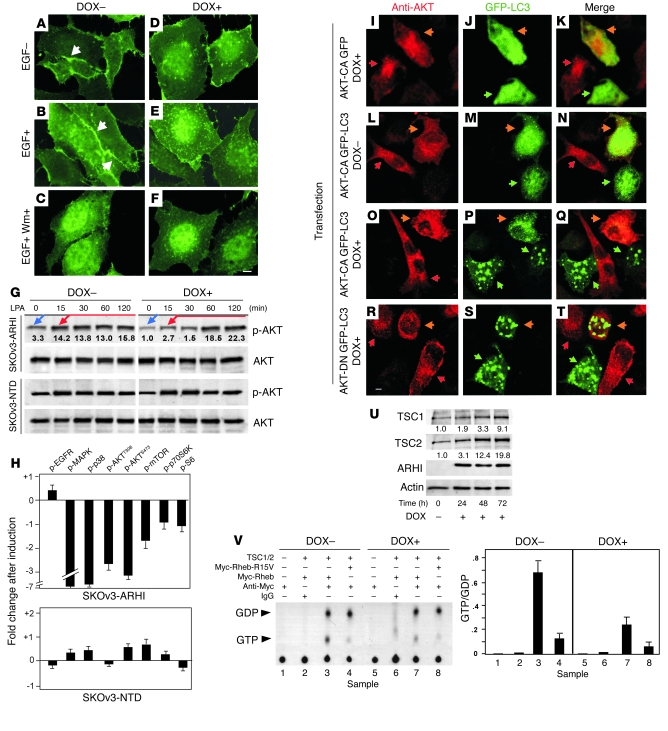
The PI3K pathway plays an important role in regulating autophagic activity (10). We therefore examined whether ARHI induces autophagy by altering activities in the PI3K pathway. We monitored PI3K activity by the membrane localization of transfected GFP-PHAKT (a fusion protein between GFP and the plextrin homology domain from AKT that binds the product of PI3K at the cell membrane and can serve as readout for PI3K activity). As shown in Figure 4, A–F, induction of ARHI in SKOv3-ARHI cells dramatically reduced EGF-induced membrane accumulation of GFP-PHAKT, similar to the results with the wortmannin-treated cells. Consistent with its inhibition of PI3K activity, ARHI expression in SKOv3-ARHI cells also significantly inhibited both basal and lysophosphatidic acid–stimulated phosphorylation of AKT, mTOR, and p70S6K, whereas expression of mutant NTD had no effect (Figure 4G and Supplemental Figure 5). These results were confirmed by reverse-phase protein microarray analysis (23), which showed reduced phosphorylation of MAPK, p38, AKTT308, AKTS473, mTOR, p70S6K, and S6 in cells that expressed ARHI but not in cells that expressed the NTD mutant (Figure 4H).
Figure 4. Expression of ARHI inhibits PI3K pathway and upregulates TSC1/2 expression.
(A–F) SKOv3-ARHI cells were transfected with GFP-PHAKT reporter and cultured with or without DOX before they were treated with EGF alone (10 ng/ml for 8 min) or with EGF and wortmannin (EGF+ Wm+; 100 nM). Arrows indicate membrane accumulation of GFP-PHAKT. Scale bar: 1 μm. (G) Phosphorylation levels of AKT were measured before (blue arrows) and after (red arrows) stimulation with 10 nM of lysophosphatidic acid (LPA). Fold changes compared with the basal levels in DOX-treated cells (assigned as 1.0) are indicated. (H) Decreased MAPK and PI3K pathway activity in ARHI-expressing cells. SKOv3-ARHI and -NTD cells were treated with DOX, and the activities of signaling molecules were determined. (I–T) AKT-CA prevents ARHI-induced autophagy. DOX-induced (I–K and O–T) or non-induced (L–N) SKOv3-ARHI cells were cotransfected with GFP-LC3 and AKT-CA or with GFP-LC3 and AKT-DN plasmids. pGFP served as a control. Cells were stained with anti-AKT and examined with fluorescence microscopy. Green and red arrowheads indicate GFP- and AKT-expressing cells, respectively. Orange arrowheads indicate cells expressing both GFP and AKT. Scale bar: 1 μm. (U) Expression of ARHI enhances TSC1/2 expression. Blot shows TSC1/2 expression following the induction of ARHI in SKOv3-ARHI cells. (V) ARHI expression inhibits Rheb activity. Top: Thin-layer chromatography of [32P]-labeled guanine nucleotides from cell lysates of SKOv3-ARHI cells cotransfected with or without Rheb, dominant-positive Rheb-R15V, and/or TSC1/2 in the presence or absence of DOX. Bottom: Calculated GTP/GDP ratios of the TLC density scanning as an indication of GTPase activity.
To further explore functional interaction of ARHI with the PI3K pathway, dominant-negative AKT (AKT-DN) and constitutively active AKT (AKT-CA) plasmids were transfected into SKOv3-ARHI cells. Expression of ARHI triggered autophagy in nontransfected cells but failed to induce autophagy in cells transfected with AKT-CA (Figure 4, O–Q), suggesting that ARHI-induced autophagy is at least partially dependent on inhibiting the PI3K pathway. In contrast, no autophagic features were observed in control cells that were not transfected with GFP-LC3 or that lacked ARHI expression (Figure 4, I–N). AKT-DN did not alter ARHI-induced autophagy (Figure 4, R–T), consistent with the conclusion that ARHI-induced autophagy was regulated by the PI3K pathway.
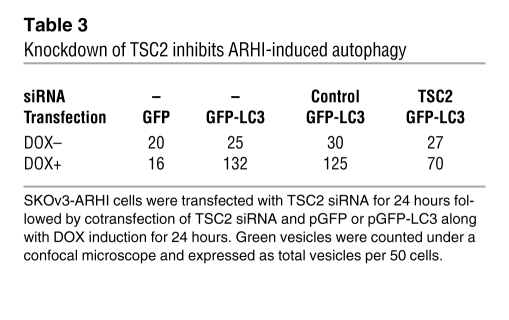
Induction of ARHI was associated with an increased expression of TSC1/2 (Figure 4U), and knockdown of TSC2 significantly decreased ARHI-induced autophagy (Table 3 and Supplemental Figure 6). TSC1 and TSC2 are GTPase activating proteins that inhibit the activity of Rheb G protein, reducing the activity of mTOR. We observed that increased expression of TSC1/2 was associated with a significant reduction in the ratio of GTP/GDP binding to Rheb, reflecting a decrease in Rheb activity (Figure 4V). Combined with the decrease in phosphorylation of p70S6K and S6, ARHI expression appears to correlate with decreased mTOR activity, one condition for the induction of autophagy.
Table 3 .
Knockdown of TSC2 inhibits ARHI-induced autophagy
ARHI induces tumor dormancy in xenografts.
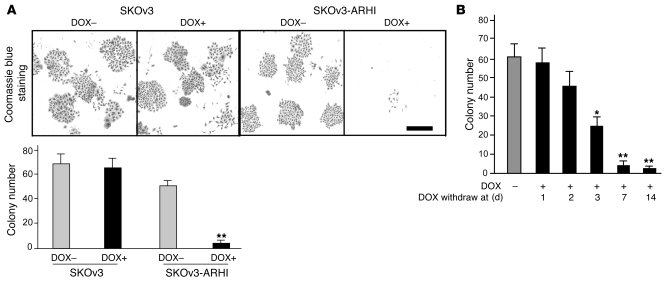
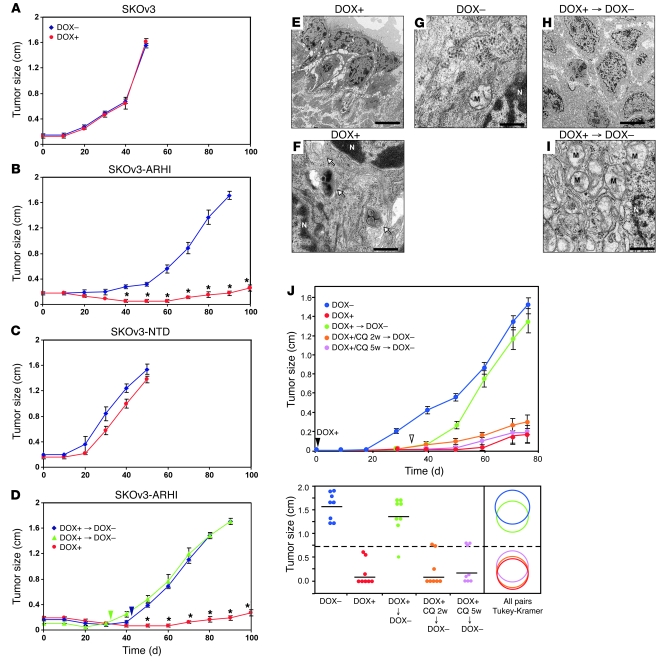
In culture, SKOv3 cells expressing ARHI died within 2 weeks (Figure 5A) and loss of clonogenic growth became irreversible in less than a week (Figure 5B). This loss of clonogenic growth, however, can be partially rescued by blocking ARHI-induced autophagy with ATG5 siRNA (Supplemental Figure 7), suggesting that these cells died from autophagic death. When SKOv3-ARHI cells were grown as xenografts, induction of ARHI by feeding DOX to the tumor-bearing animals significantly inhibited xenograft growth (Figure 6B). Control SKOv3-ARHI tumors without ARHI induction grew to more than 1.5 cm in diameter by 90 days. As expected, DOX did not affect tumor growth in parental SKOv3 cells. Similarly, induction of SKOv3-NTD by DOX failed to inhibit xenograft growth (Figure 6C). When ARHI induction was withdrawn after 32 or 42 days, xenografts grew promptly and at a more rapid rate (Figure 6D), suggesting that cancer cells had remained viable during the 32 to 42 days of ARHI induction, consistent with a dormant state. Similar results were observed in cultured cells. As shown in Supplemental Figure 8, SKOv3-ARHI cells, when treated with DOX for 3 days followed by DOX removal, could resume exponential cell growth, albeit with a slight delay when compared with cells cultured in the absence of DOX. TEM images of xenografts from mice treated with DOX showed typical autophagosome vesicles (Figure 6, E–G) resembling the autophagic vesicles observed in ARHI-induced cells in culture (Figure 1, O–Q). Upon DOX withdrawal, cells lost the attributes of autophagy, exhibiting disappearance of autophagosomes with a concomitant increase in the number of mitochondria (Figure 6I). On an average, we observed 0.4 autophagosomes per cell in the untreated xenografts. The number of autophagosomes increased to 12 per cell in the DOX-treated xenografts and returned to very low numbers upon DOX withdrawal. To address the importance of ARHI-induced autophagy in the dormant xenografts, DOX-treated mice were given intraperitoneal injections of chloroquine (CQ) to inhibit autophagy (24). DOX-treated mice were injected with CQ (5 days/week at 50 mg/kg) or diluent for 5 weeks before both DOX and CQ were withdrawn. A third group of DOX-treated mice were treated with CQ for only the final 2 weeks of DOX treatment. As shown in Figure 6J, inhibition of ARHI-induced autophagy by CQ dramatically inhibited xenograft tumor growth following DOX withdrawal, indicating that establishment of the dormancy state is dependent on ARHI-mediated autophagy.
Figure 5. ARHI-induced autophagy results in cell death in cultured cells.
(A) Induction of ARHI expression results in cell death of cultured cells. SKOv3 or SKOv3-ARHI cells were cultured with or without DOX for 14 days and stained with Coomassie blue, and colonies were counted with light microscopy. **P < 0.01 compared with SKOv3 cells. Scale bar: 2 mm. (B) Re-expression of ARHI induces cell death within a week. DOX was added to induce ARHI expression and then withdrawn at indicated times. Cell colonies were counted with light microscopy. *P < 0.05, **P < 0.01 compared with no DOX.
Figure 6. ARHI-induced autophagy results in tumor dormancy in xenografts.
(A–D) BALB/c nu/nu mice were injected with SKOv3 (A), SKOv3-ARHI (B), or SKOv3-NTD (C) cells and provided with or without DOX in their drinking water. (D) In 2 subgroups, DOX was withdrawn after 32 (green triangles) or 42 (blue diamonds) days of treatment. Arrowheads indicate day of DOX withdrawal. Results shown are from 3 independent experiments. *P < 0.01 compared with absence or withdrawal of DOX. (E–I) TEM images of tumor xenografts showing tumor cells with autophagosomes (arrows) in groups with DOX (F) but not in groups without DOX (G) groups. (I) Withdrawal of DOX resulted in disappearance of autophagosomes and replacement with large number of mitochondria (M), an indication of high metabolism and rapid growth. N, nucleus. Scale bar: 10 μm (E and H), 1 μm (F, G, and I). (J) Inhibition of autophagy blocks tumor dormancy. Nu/nu mice were injected with SKOv3-ARHI cells, and drinking water was supplemented or not with DOX for 5 weeks. One group of DOX-treated mice was injected with CQ for 5 weeks, and a second group was injected with CQ for the final 2 weeks before DOX withdrawal. Top: Growth curve of xenografts with indicated treatments. Bottom: Tumor sizes from day 76 were used for statistical analysis. All pairs comparisons between individual groups were done using the Tukey-Kramer test (P < 0.05). The dashed line represents the mean of all groups; solid lines represent the mean of individual groups. The diameter of the circles reflects the within-group variance, and overlapping of circles indicates a lack of statistical significance.
Growth factors, cytokines, and cell matrix proteins can partially rescue cancer cells from ARHI-induced cell death in vitro.
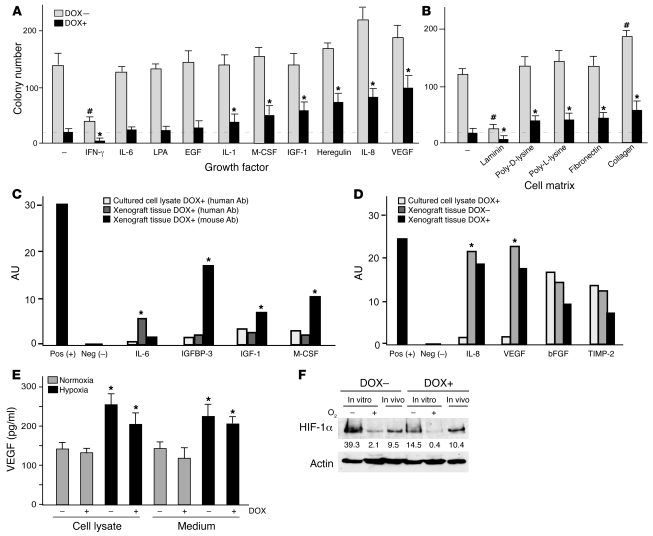
Given the dramatic differences in survival of autophagic cancer cells in culture and in xenografts, we sought factors present in vivo that might contribute to improved cell survival. Clonogenic assays with SKOv3-ARHI cells showed that several growth factors and cytokines (VEGF, IL-8, heregulin, IGF-1, M-CSF, and IL-1) as well as cell matrix proteins (collagen, fibronectin, and polylysine) present in xenografts could partially rescue cells from ARHI-induced autophagic cell death in culture (Figure 7, A and B). Antibody arrays detected much higher levels of growth factors and cytokines in xenografts than in cultured cells (Figure 7C and Supplemental Figure 9). Murine IGFBP-3, IGF-1, M-CSF, and MIP-1γ were found at high levels in xenografts. It is noteworthy that murine IGF-1 is known to have significant cross-species activity with human receptors (25), and expression of such growth factors or cytokines by host stromal cells may provide a microenvironment in vivo that promotes the survival of human cancer cells undergoing ARHI-induced autophagy. Several inflammatory cytokines, including MIP-1β and Rantes of either human or murine origin, were detected in xenograft extracts (Supplemental Figure 9), consistent with the notion that inflammation provides critical survival factors for tumor cells undergoing autophagy and metabolic stress (6, 8).
Figure 7. Growth and angiogenic factors and cell matrix proteins can rescue cultured cells from ARHI-induced autophagic cell death.
(A and B) Growth and angiogenic factors and cell matrix proteins rescue ARHI-induced autophagic death. Clonogenic assays were carried out with SKOv3-ARHI cells cultured in medium with added cytokines and growth factors (A) on plastic with or without different cell matrix proteins (B). #P < 0.05, compared with control without DOX. *P < 0.05, compared with control with DOX. (C) Most of the detected growth factors were of host origin. Antibody array analyses of cytokines, growth factors, and inflammatory factors from cultured cells or xenograft tissues were performed with antibodies specific for human or mouse antigens. Each antibody was spotted in duplicate and 2 sets of positive and negative controls were spotted at the top left corner of each membrane (see Supplemental Figure 7). *P < 0.05, compared with cultured cell lysates. (D) Detection of angiogenic factors in cultured cells and xenografts. Antibodies specific for human or mouse angiogenic factors or inflammatory proteins were used. Densitometry scanning of antibody spots is represented as arbitrary density units. *P < 0.05, compared with in vitro samples. (E) Hypoxia promotes VEGF expression. VEGF levels were determined in culture medium and in cell lysates under hypoxic conditions. *P < 0.05, compared with normoxic conditions. (F) ARHI downregulates HIF-1α in SKOv3-ARHI cells cultured in hypoxic conditions. Western blots of HIF-1α were carried out with lysates from cells cultured under normoxic or hypoxic conditions and from xenograft tissues. Numbers under protein bands are densitometry units.
Angiogenic factors are expressed in the xenograft microenvironment.
As the development of microvasculature may be critical in maintaining dormancy or producing tumor progression (26), we examined the levels of angiogenic factors. Antibody arrays that recognize human and murine angiogenic factors were used to measure the levels of angiogenic factors in culture supernatants, cultured ovarian cancer cells, and xenografts in the presence or absence of ARHI expression. SKOv3-ARHI cells cultured in low serum expressed IL-8, bFGF, and TIMP-2, but not VEGF (Figure 7D and Supplemental Figure 10). While IL-8 was found in the culture medium and bFGF in the cell lysate, TIMP-2 was detected in both fractions. Induction of ARHI resulted in a modest decrease in all 3 factors. In xenografts, levels of human IL-8 and VEGF were significantly higher than those in cultured cells (Figure 7D and Supplemental Figure 10), whereas bFGF and TIMP-2 were expressed at comparable levels in cell culture and xenografts. Again, ARHI expression produced a modest reduction in these angiogenic factors. High levels of IL-8 and VEGF expression in xenografts underscores the importance of tumor microenvironment in maintaining tumor cell survival, as incubation with these factors partially rescued SKOv3-ARHI cells from ARHI-induced autophagic cell death (Figure 7A). Since cancer cells within xenografts are likely to be hypoxic, which may affect tumor growth, we examined whether hypoxia affects expression of growth factors and cytokines. Incubation of SKOv3-ARHI cells under hypoxic conditions significantly increased VEGF expression (Figure 7E) and was associated with markedly increased expression of HIF-1α (Figure 7F). Expression of ARHI reduced hypoxia-induced expression of VEGF (Figure 7E) and HIF-1α (Figure 7F), but elevated levels of VEGF and IL-8 were still present to affect the survival of SKOv3-ARHI cells.
Growth factors, cytokines, and cell matrix proteins reverse changes in signaling induced by ARHI.
To elucidate signaling pathways that might contribute to the survival of dormant cancer cells in vivo, we examined the effect of different growth factors, cell matrix proteins, and angiogenic factors that enhanced survival of autophagic cells on the expression of growth regulatory proteins and their phosphorylation. Using reverse-phase protein microarray analysis, ARHI induction inhibited phosphorylation of AKTS473, mTOR, and S6K and increased the expression of both LKB1 and TSC2 and the phosphorylation of AMPK, consistent with the hypothesis that ARHI induces autophagy through downregulation of PI3K/mTOR and upregulation of the AMPK/TSC1/TSC2 signaling cascades (Supplemental Figure 11, A and B). In addition, ARHI expression increased p27 but decreased pMEK, pp38, pJNK, and pEGFR. Addition of growth factors (M-CSF, IGF-1) or angiogenic factors (VEGF, IL-8) that rescued cancer cells from autophagic death reversed the ARHI-induced signaling changes associated with autophagy, decreasing TSC2 expression and increasing AKT and mTOR phosphorylation (Supplemental Figure 11). Conversely, addition of IFN-γ, which enhanced autophagic cell death, had a minimal effect on these signaling pathways (Supplemental Figure 11A). Matrix proteins that rescued cells had no effect on AKT signaling but did increase VEGFR expression, whereas laminin, which augmented autophagic death, did not upregulate VEGFR (Supplemental Figure 11B).
Discussion
Re-expression of ARHI at physiologic levels leads to programmed death of ovarian cancer cells in culture without inducing apoptosis. Cell death is preceded by the development of autophagy, as judged by increased catabolism of long-lived proteins and by the formation of acidic bilamellar vesicles that are decorated with LC3-II. ARHI can promote autophagy at 2 levels. First, ARHI participates directly in the formation of autophagic vesicles by upregulating ATG4, an enzyme that cleaves LC3-I to produce LC3-II, and by colocalizing with LC3-II in the membranes of autophagic vesicles. Whereas NOSE cells that express ARHI undergo spontaneous autophagy, significant autophagy was only observed in each of 4 ovarian cancer cell lines after re-expression of ARHI. Consistent with a critical role in the formation of autophagic vesicles, knockdown of ARHI blocks not only ARHI- and rapamycin-induced autophagy in ovarian cancer cells, but also spontaneous autophagy in NOSE cells.
In addition to a direct association with autophagic vesicles, expression of ARHI also alters intracellular signaling pathways that favor autophagy. Expression of ARHI downregulates pAKT, pmTOR, and pp70S6K levels, increases AMPK/TSC1/TSC2 expression, and decreases Rheb activity. The significance of signaling through the PI3K/AKT/mTOR pathway is underlined by the ability of AKT-CA expression or TSC2 knockdown to block ARHI-induced autophagy. Both spontaneous autophagy in normal cells and rapamycin-induced autophagy in malignant cells can be dramatically reduced when ARHI expression is inhibited by ARHI siRNA. We hypothesize that expression of ARHI is necessary but not sufficient for formation of autophagic vesicles. In normal cells, ARHI is present at levels high enough to inhibit PI3K/AKT/mTOR signaling, and in the absence of additional signaling, this inhibition appears to be sufficient to drive normal cells to autophagy. During malignant transformation, ARHI is downregulated but not completely lost. Cancer cells are selected, and these cells survive and are capable of progressive growth, having upregulated PI3K and consequently reset the regulatory balance that prevents cell cycle arrest and autophagy. Reintroducing physiologic levels of ARHI not only provides a critical component of autophagic vesicles, but also inhibits PI3K/AKT/mTOR signaling.
While re-expression of ARHI induced autophagic cell death in culture within days, ovarian cancer cells growing as xenografts remained dormant for weeks after induction of ARHI and grew promptly when ARHI was downregulated. Establishment of tumor dormancy appears to depend on ARHI-induced autophagy, as inhibition of autophagy by CQ prevented regrowth of xenografts. Our studies provide insight into factors present in vivo that can rescue autophagic cell death in culture. Growth factors (IGF-1), angiogenic factors (VEGF, IL-8), M-CSF, and matrix proteins can all prevent, in part, ARHI-induced autophagy. VEGF levels were significantly higher in xenografts than in cell culture, likely related to hypoxia at the tumor site in vivo. Hypoxia, generally present in the tumor microenvironment, can increase HIF-1α levels and its transcription activity, leading to upregulation of angiogenic proteins such as VEGF, PDGF, and NOS (27). Indeed, growth of SKOv3-ARHI cells under hypoxic conditions stimulated expression of HIF-1α and VEGF. Although induction of ARHI reduced VEGF expression, substantial levels of VEGF were still present to favor survival of autophagic cells. Reduction in VEGF levels following ARHI induction could, however, have delayed angiogenesis in dormant xenografts, whereas increased VEGF expression following downregulation of ARHI could have contributed to prompt recruitment of tumor vessels and accelerated growth.
Rescue of cultured ovarian cancer cells from autophagic death by growth factors and cytokines is associated with reversal of several ARHI-mediated alterations in cell signaling, including the PI3K/AKT/mTOR and AMPK/TSC1/TSC2 pathways. Thus, when ARHI-induced autophagy and inhibition of cell proliferation is partially offset by growth signals stimulated by survival factors and matrix proteins in the microenvironment, tumor dormancy may result. In this model, the balance between the pro-autophagic and antiproliferative activity of ARHI and the anti-autophagic and pro-proliferative activities of survival factors determines whether cancer cells die an autophagic death, remain dormant, or exit dormancy.
Tumor dormancy is a clinically important but poorly understood stage of cancer progression (28–31). If ARHI is required for autophagosome formation, then cells that lack the ability to express ARHI should be incapable of autophagy. More than 60% of primary ovarian cancers have decreased ARHI expression associated with shortened disease-free survival (15). If autophagy is required for survival of dormant cells, these ovarian cancers should be incapable of dormancy and, if they recur, should do so within a short interval. Dormant cancer cells that express ARHI and that can utilize autophagy to survive would still recur, but at a later interval (15). Indeed, our results showing that inhibition of ARHI-induced autophagy by CQ prevented tumor dormancy are consistent with this working hypothesis and may have clinical implications for the significance of autophagy in tumor dormancy in cancer patients. The clinical relevance of the present observations might be tested by examining ovarian cancers, detected at second-look operations, for the expression of ARHI and the presence of autophagic vesicles.
Persistence of dormant drug-resistant cancer cells following primary chemotherapy is a major barrier to improving survival of women with ovarian cancer. The ability to induce ARHI in tumor xenografts provides what we believe is a novel model for studying factors that affect autophagy and tumor dormancy as well as for developing new strategies to detect and eliminate dormant cells. Genes and pathways can now be identified that are critical to the survival of autophagic cells in vivo. Either siRNA-based strategies or small molecular weight inhibitors of these survival pathways might be utilized to eliminate dormant cancer cells, providing new approaches for therapy. The ability to induce autophagy in xenografts should also facilitate efforts to identify circulating molecular markers and to develop imaging probes that would permit detection of autophagic cells in cancers.
Methods
Antibodies and reagents.
Antibodies against p70S6K, mTOR, AKT, Raf, MAPK, p38, pS6, pp70S6KT389, pMAPK, pRaf, pp38, pmTOR, pAKTS473 or pAKTT308, and pS6 were purchased from Cell Signaling Technology and anti-TSC2 was from Novus Biologicals. Antibody against HIF-1α was from Invitrogen. Anti-actin and anti-Myc were from Santa Cruz Biotechnology Inc. and EMD Biosciences, respectively. Antibodies against ARHI were generated in our laboratory. Anti-LC3 was provided by N. Mizushima and T. Yoshimori (National Institute for Basic Biology, Okazaki, Japan), and anti-ATG4 was provided by T. Ueno (Juntendo University, Bunkyo-ku, Japan). All chemicals and cytokines/growth factors were purchased from Sigma-Aldrich, and siRNAs were from Dharmacon Research.
Cells.
Human ovarian cancer cells, SKOv3, Hey, ES2, and OC316 and NOSE cells (OSE106, OSE123, and OSE115) were grown in conditions as previously described (13, 14, 17). The Tet-on inducible SKOv3-ARHI and SKOv3-NTD cells were grown in McCoy’s medium supplemented with 10% FBS, 200 μg/ml G418, and 0.12 μg/ml puromycin. ARHI expression was induced by adding 1 μg/ml DOX to the culture medium. A Tet-regulated subline of Hey cells was established by infection with a lentiviral vector.
Measurement of ARHI mRNA expression.
ARHI mRNA levels were determined by real-time RT-PCR. Copy numbers in each sample were calculated based on a standard curve.
Cell proliferation assay.
The growth inhibitory effect of ARHI was determined using a sulforhodamine B (SRB) assay. Briefly, SKOv3 cells (3 × 10³) were cultured with or without DOX for 72 hours. Cells were washed, fixed with 30% TCA, and incubated for 30 minutes at room temperature with 0.4% SRB in 1% acetic acid. The plates were read with a microplate reader at 570 nm.
Detection of AVO with acridine orange staining.
SKOv3-ARHI or SKOv3-NTD cells were cultured with or without DOX for 48 hours. Parental SKOv3 or Hey cells were transfected with pcDNA-ARHI, washed with PBS, stained with medium containing 1 μg/ml acridine orange for 15 minutes, and examined immediately by fluorescence microscopy.
TEM.
For TEM examination of autophagosomes, SKOv3 cells were washed in PBS and fixed with 2.5% glutaraldehyde in 0.1 M Na-cacodylate buffer and further fixed with 1% osmium tetroxide in 0.1 M cacodylate buffer. Specimens were stained with aqueous uranyl acetate and lead citrate before they were observed with a Jeol-100 CX II (JEOL) TEM at 80 kV.
Terminal deoxynucleotidyl transferase 2′-deoxyuridine 5′-triphosphate nick end labeling assay.
Apoptotic cells were detected with an ApopTag apoptosis detection kit (Invitrogen) following the manufacturer’s protocol. Propidium iodide staining was performed by incubating sections with propidium iodide (20 μg/ml) for 10 minutes at room temperature. Cisplatin (5 μg/ml) was used as a positive control to induce apoptosis.
Measurement of degradation of long-lived proteins.
SKOv3-ARHI cells were cultured with or without DOX for 48 hours and then cultured in cysteine/methionine-free media containing 5 μCi l–[35S]-cysteine/methionine for 6 hours. After washing, cells were incubated with medium containing 10% FBS and 2 mM unlabeled cysteine/methionine. After 12 hours of incubation to permit degradation of short-lived proteins, the chase medium was replaced with fresh Hank’s medium. Supernatant medium was collected and the protein precipitated with 10% TCA. Radioactivity in the acid-soluble fraction was measured by liquid scintillation counter. The cells were fixed by adding 10% TCA directly to the culture dishes, washed with TCA, and solubilized in 1 ml of 0.2 M NaOH. Radioactivity in the samples was measured. The percent protein degradation was calculated by dividing the amount of acid-soluble radioactivity in the culture medium by the sum of acid-soluble and acid-precipitable radioactivities.
In vitro Rheb GTPase assay.
Rheb GTPase activity was measured by TLC as previously described (32). Briefly, SKOv3-ARHI cells were cotransfected with various plasmids. Plasmids Myc-Rheb, Myc-Rheb-R15V, and HA-TSC2 were kindly provided by K. Guan (University of Michigan, Ann Arbor, Michigan, USA), and Myc-TSC1 plasmid was purchased from Addgene. Cells were incubated with 25 μCi of [32P]-phosphate/ml for 4 hours. Myc-Rheb was immunoprecipitated with anti-Myc, the Rheb-bound nucleotides were then applied onto polyethyleneimine cellulose plates, and [32P]-GTP and [32P]-GDP were resolved by TLC and quantified by autoradiography.
In vivo cross-linking and coimmunoprecipitation.
To examine association between ARHI and LC3 in vivo, a cell membrane–permeable cross-linker, BASED (Bis-[β-(4-azidosalicylamido) ethyl] disulfide) (Pierce Biotechnology) was used. Cells were rinsed twice in cold PBS and treated with 5 mM BASED for 20 minutes before being exposed to UV light (366 nm). Cells were lysed in RIPA buffer (50 mM Tris, pH 7.4, 150 mM NaCl, 1% NP-40, 0.5% sodium deoxycholate, 0.1% SDS), supplemented with protease inhibitor cocktail (Roche Applied Science) and 1 mM PMSF. Coimmunoprecipitation and western blotting were performed as described in the figure legends.
Reverse-phase protein microarray.
Cell lysates from cells with and without DOX were adjusted for protein concentrations, denatured with SDS, and serial diluted to define the linear range of each antigen-antibody reaction. Lysates were spotted onto nitrocellulose-coated slides (Whatman) with a G3 microarrayer (Genomic Solutions) and probed with antibodies. Signals were captured by tyramide dye deposition (CSA System; DAKO). Data collected were quantified using quantitating software MicroVigene specifically developed for this approach. Protein phosphorylation levels were expressed as a ratio to equivalent total proteins. The values derived from the slope and the intercepts were expressed relative to standard control cell lysates on the array. All values were compared with the mean within each antibody probing and visualized by heatmaps created from the software MatLab (Mathworks Inc.).
Western blotting.
Cell lysates were prepared as previously described (17, 18). Equal amounts of protein were separated by 12% or 15% SDS-PAGE, transferred to PVDF membranes, and subjected to western blotting using an ECL chemiluminescence reagent (GE Healthcare).
siRNA transfection.
SKOv3-ARHI and glioma cells were transfected with control or ARHI siRNAs using the Transfectin 4 reagent (Dharmacon Research). Briefly, a mixture of siRNA (100 nM final concentration) and transfection reagents were incubated for 20 minutes at room temperature. This mixture was then added to cells and allowed to incubate for 48 hours before cells were harvested for protein and RNA expression measurements. For experiments with serial transfections, cells were transfected with siRNA using the Transfectin 4 reagent on day one and with additional siRNA and GFP or GFP-LC3 plasmid using Lipofectamine 2000 (Invitrogen) on day 2. Cells were either harvested 24 hours later for protein expression measurements or fixed for fluorescence microscopy analyses.
Clonogenic assays.
SKOv3-ARHI or SKOv3-NTD cells (1 × 10³) were cultured in control medium or medium containing cytokines, growth factors, or cell matrix proteins for 14 days with or without DOX. Colonies in each well were stained with Coomassie blue and counted.
Transient transfection and immunofluorescent staining.
Tumor cells (3 × 10⁴) were seeded in chamber slides and transfected with 1 μg of HA-tagged AKT-CA or AKT-DN plasmid (Myr-HA-AKT1-DD or Myr-HA-AKT1[AAA], respectively). Cells were fixed with 4% formaldehyde and permeabilized with 0.5% Triton X-100. Cells were then washed and blocked with 3% goat serum and 0.1% BSA in PBS followed by incubation with anti-HA antibody. After washing, cells were incubated with secondary antibody conjugated with Alexa Fluor 488 or 594 (Invitrogen), mounted, and examined using a confocal microscope (Olympus FluoView 500).
Mouse xenograft and measurement of tumor size.
Eight-week-old BALB/c nu/nu mice were purchased from Charles River Laboratories. SKOv3-ARHI, SKOv3-NTD, or parental SKOv3 cells (1 × 10⁷) were injected subcutaneously into the flank of each mouse. DOX (2 mg/ml) in 5% glucose or glucose alone was added to the drinking water on the day of injection. For the CQ experiment, DOX-treated mice were injected intraperitoneally with CQ (5 days/week at 50 mg/kg) for the entire 5 weeks or the final 2 weeks of DOX treatment. Tumor size was measured every third day using a digital caliper. The mean of 2 independent measurements was averaged. All procedures were carried out according to the animal protocol approved by the Institutional Animal Care and Use Committee of the M.D. Anderson Cancer Center at the University of Texas.
Antibody arrays.
Human and mouse cytokine/growth factor antibody arrays were purchased from RayBiotech, and angiogenesis antibody arrays were from Panomics. SKOv3-ARHI cells were seeded at 80% confluence with 1% FBS and induced by adding DOX in culture medium. Medium and cell lysates were collected after 48 hours. Lysates of cells in vivo were prepared from frozen tissues of isolated xenografts.
VEGF ELISA assay.
VEGF ELISA kits were purchased from R & D Systems. SKOv3-ARHI cells were seeded at 80% confluence with 1% FBS. After 24 hours, DOX was added to induce ARHI expression. Medium and cell lysates were collected after an additional 24 hours in the presence or absence of hypoxia (in a hypoxia chamber filled with 1% O2, 5% CO2, and 94% N2).
Statistics.
All experiments were repeated independently at least 2 times. The data were expressed as means ± SEM. Statistical analysis was performed by using Student’s t test (2-tailed). The criterion for statistical significance was taken as P < 0.05 (2-sided).
Supplementary Material
Acknowledgments
This work was supported by NIH grant P01CA64602 (to R.C. Bast Jr.), National Foundation for Cancer Research grant LF2004-00009224HM (to R.C. Bast Jr.), and the Blanton-Davis Ovarian Cancer Research Fund (to R.Z. Luo).
Footnotes
Nonstandard abbreviations used: AKT-CA, constitutively active AKT; AKT-DN, dominant-negative AKT; ARHI, aplasia Ras homolog member I; AVO, acidic vesicular organelle; CQ, chloroquine; DOX, doxycycline; LC3, microtubule-associated protein light chain 3; NOSE, normal ovarian surface epithelium; NTD, N-terminal–deleted ARHI; TEM, transmission electron microscopy.
Conflict of interest: The authors have declared that no conflict of interest exists.
Citation for this article: J. Clin. Invest. 118:3917–3929 (2008). doi:10.1172/JCI35512
Zhen Lu and Robert Z. Luo contributed equally to this work.
See the related Commentary beginning on page 3837.
References
- 1.Levine B. Eating oneself and uninvited guests: autophagy-related pathways in cellular defense. Cell. 2005;120:159–162. doi: 10.1016/j.cell.2005.01.005. [DOI] [PubMed] [Google Scholar]
- 2.Marino G., Lopez-Otin C. Autophagy: molecular mechanisms, physiological functions and relevance in human pathology. Cell. Mol. Life Sci. 2004;61:1439–1454. doi: 10.1007/s00018-004-4012-4. [DOI] [PMC free article] [PubMed] [Google Scholar]
- 3.Shintani T., Klionsky D.J. Autophagy in health and disease: a double-edged sword. Science. 2004;306:990–995. doi: 10.1126/science.1099993. [DOI] [PMC free article] [PubMed] [Google Scholar]
- 4.Edinger A.L., Thompson C.B. Defective autophagy leads to cancer. Cancer Cell. . 2003;4:422–424. doi: 10.1016/S1535-6108(03)00306-4. [DOI] [PubMed] [Google Scholar]
- 5.Marx J. Autophagy: is it cancer’s friend or foe? Science. . 2006;312:1160–1161. doi: 10.1126/science.312.5777.1160. [DOI] [PubMed] [Google Scholar]
- 6.Jin S., White E. Role of autophagy in cancer: management of metabolic stress. Autophagy. 2007;3:28–31. doi: 10.4161/auto.3269. [DOI] [PMC free article] [PubMed] [Google Scholar]
- 7.Kondo Y., Kanzawa T., Sawaya R., Kondo S. The role of autophagy in cancer development and response to therapy. Nat. Rev. Cancer. 2005;5:726–734. doi: 10.1038/nrc1692. [DOI] [PubMed] [Google Scholar]
- 8.Degenhardt K., et al. Autophagy promotes tumor cell survival and restricts necrosis, inflammation, and tumorigenesis. Cancer Cell. 2006;10:51–64. doi: 10.1016/j.ccr.2006.06.001. [DOI] [PMC free article] [PubMed] [Google Scholar]
- 9.Carew J.S., et al. Targeting autophagy augments the anticancer activity of the histone deacetylase inhibitor SAHA to overcome Bcr-Abl-mediated drug resistance. Blood. 2007;110:313–322. doi: 10.1182/blood-2006-10-050260. [DOI] [PMC free article] [PubMed] [Google Scholar]
- 10.Arico S., et al. The tumor suppressor PTEN positively regulates macroautophagy by inhibiting the phosphatidylinositol 3-kinase/protein kinase B pathway. J. Biol. Chem. 2001;276:35243–35246. doi: 10.1074/jbc.C100319200. [DOI] [PubMed] [Google Scholar]
- 11.Furuta S., Hidaka E., Ogata A., Yokota S., Kamata T. Ras is involved in the negative control of autophagy through the class I PI3-kinase. Oncogene. 2004;23:3898–3904. doi: 10.1038/sj.onc.1207539. [DOI] [PubMed] [Google Scholar]
- 12.Qu X., et al. Promotion of tumorigenesis by heterozygous disruption of the beclin 1 autophagy gene. J. Clin. Invest. 2003;112:1809–1820. doi: 10.1172/JCI20039. [DOI] [PMC free article] [PubMed] [Google Scholar]
- 13.Yu Y., et al. NOEY2 (ARHI), an imprinted putative tumor suppressor gene in ovarian and breast carcinomas. Proc. Natl. Acad. Sci. U.S.A. . 1999;96:214–219. doi: 10.1073/pnas.96.1.214. [DOI] [PMC free article] [PubMed] [Google Scholar]
- 14.Luo R.Z., et al. Genomic structure and promoter characterization of an imprinted tumor suppressor gene ARHI. Biochim. Biophys. Acta. 2001;1519:216–222. doi: 10.1016/s0167-4781(01)00226-3. [DOI] [PubMed] [Google Scholar]
- 15.Rosen D.G., et al. Expression of the tumor suppressor gene ARHI in epithelial ovarian cancer is associated with increased expression of p21 WAF1/CIP1 and prolonged progression-free survival. Clin. Cancer Res. 2004;10:6559–6566. doi: 10.1158/1078-0432.CCR-04-0698. [DOI] [PubMed] [Google Scholar]
- 16.Wang L., et al. Loss of the expression of the tumor suppressor gene ARHI is associated with progression of breast cancer. Clin. Cancer Res. 2003;9:3660–3666. [PubMed] [Google Scholar]
- 17.Lu Z., et al. Transcriptional and posttranscriptional down-regulation of the imprinted tumor suppressor gene ARHI (DRAS3) in ovarian cancer. Clin. Cancer Res. 2006;12:2404–2413. doi: 10.1158/1078-0432.CCR-05-1036. [DOI] [PubMed] [Google Scholar]
- 18.Luo R.Z., et al. ARHI is a Ras-related small G-protein with a novel N-terminal extension that inhibits growth of ovarian and breast cancers. Oncogene. 2003;22:2897–2909. doi: 10.1038/sj.onc.1206380. [DOI] [PubMed] [Google Scholar]
- 19.Bao J.J., et al. Reexpression of the tumor suppressor gene ARHI induces apoptosis in ovarian and breast cancer cells through a caspase-independent calpain-dependent pathway. Cancer Res. 2002;62:7264–7272. [PubMed] [Google Scholar]
- 20.Asanuma K., et al. MAP-LC3 a promising autophagosomal marker, processed during the differentiation and recovery of prodocytes from PAN nephrosis. FASEB J. 2003;17:1165–1167. doi: 10.1096/fj.02-0580fje. [DOI] [PubMed] [Google Scholar]
- 21.Kabeya Y., et al. LC3, a mammalian homologue of yeast Apg8p, is localized in autophagosome membranes after processing. EMBO J. 2000;19:5720–5728. doi: 10.1093/emboj/19.21.5720. [DOI] [PMC free article] [PubMed] [Google Scholar]
- 22.Takahashi Y., et al. Bif-1 interacts with Beclin 1 through UVRAG and regulates autophagy and tumorigenesis. Nat Cell Biol. 2007;9:1142–1151. doi: 10.1038/ncb1634. [DOI] [PMC free article] [PubMed] [Google Scholar]
- 23.Sheehan K., et al. Use of reverse phase protein microarrays and reference standard development for molecular network analysis of metastatic ovarian carcinoma. Mol. Cell. Proteomics. 2005;4:346–355. doi: 10.1074/mcp.T500003-MCP200. [DOI] [PubMed] [Google Scholar]
- 24.Amaravadi R.K., et al. Autophagy inhibition enhances therapy-induced apoptosis in a Myc-induced model of lymphoma. J. Clin. Invest. 2007;117:326–336. doi: 10.1172/JCI28833. [DOI] [PMC free article] [PubMed] [Google Scholar]
- 25.Schuller A.G., Groffen C., van Neck J.W., Zwarthoff E.C., Drop S.L. cDNA cloning and mRNA expression of the six mouse insulin-like growth factor binding proteins. Mol. Cell. Endocrinol. 1994;104:57–66. doi: 10.1016/0303-7207(94)90051-5. [DOI] [PubMed] [Google Scholar]
- 26.Naumov G.N., Akslen L.A., Folkman J. Role of angiogenesis in human tumor dormancy: animal models of the angiogenic switch. Cell Cycle. 2006;5:1779–1787. doi: 10.4161/cc.5.16.3018. [DOI] [PubMed] [Google Scholar]
- 27.Semenza G.L. Targeting HIF-1 for cancer therapy. Nat. Rev. Cancer. 2003;3:721–732. doi: 10.1038/nrc1187. [DOI] [PubMed] [Google Scholar]
- 28.Aguirre-Ghiso J.A. The problem of cancer dormancy: understanding the basic mechanisms and identifying therapeutic opportunities. Cell Cycle. 2006;5:1740–1743. doi: 10.4161/cc.5.16.3165. [DOI] [PMC free article] [PubMed] [Google Scholar]
- 29.Demicheli R. Tumor dormancy: findings and hypotheses from clinical research on breast cancer. Semin. Cancer Biol. 2001;11:297–306. doi: 10.1006/scbi.2001.0385. [DOI] [PubMed] [Google Scholar]
- 30.Uhr J.W., Scheuermann R.H., Street N.E., Vitetta E.S. Cancer dormancy: opportunities for new therapeutic approaches. Nat. Med. 1997;3:505–509. doi: 10.1038/nm0597-505. [DOI] [PubMed] [Google Scholar]
- 31.Pantel K., von Knebel Doeberitz M. Detection and clinical relevance of micrometastatic cancer cells. Curr. Opin. Oncol. 2000;12:95–101. doi: 10.1097/00001622-200001000-00016. [DOI] [PubMed] [Google Scholar]
- 32.Li Y., Inoki K., Guan K.L. Biochemical and functional characterizations of small GTPase Rheb and TSC2 GAP activity. Mol. Cell. Biol. 2004;24:7965–7975. doi: 10.1128/MCB.24.18.7965-7975.2004. [DOI] [PMC free article] [PubMed] [Google Scholar]
Associated Data
This section collects any data citations, data availability statements, or supplementary materials included in this article.


