Abstract
Tumors contain oxygenated and hypoxic regions, so the tumor cell population is heterogeneous. Hypoxic tumor cells primarily use glucose for glycolytic energy production and release lactic acid, creating a lactate gradient that mirrors the oxygen gradient in the tumor. By contrast, oxygenated tumor cells have been thought to primarily use glucose for oxidative energy production. Although lactate is generally considered a waste product, we now show that it is a prominent substrate that fuels the oxidative metabolism of oxygenated tumor cells. There is therefore a symbiosis in which glycolytic and oxidative tumor cells mutually regulate their access to energy metabolites. We identified monocarboxylate transporter 1 (MCT1) as the prominent path for lactate uptake by a human cervix squamous carcinoma cell line that preferentially utilized lactate for oxidative metabolism. Inhibiting MCT1 with α-cyano-4-hydroxycinnamate (CHC) or siRNA in these cells induced a switch from lactate-fueled respiration to glycolysis. A similar switch from lactate-fueled respiration to glycolysis by oxygenated tumor cells in both a mouse model of lung carcinoma and xenotransplanted human colorectal adenocarcinoma cells was observed after administration of CHC. This retarded tumor growth, as the hypoxic/glycolytic tumor cells died from glucose starvation, and rendered the remaining cells sensitive to irradiation. As MCT1 was found to be expressed by an array of primary human tumors, we suggest that MCT1 inhibition has clinical antitumor potential.
Introduction
Glycolysis is a cascade of reactions that reduce glucose to pyruvic acid. In eukaryotic cells, the glycolytic flux is modulated by several allosteric effectors, including ATP, which create negative feedback when oxygen is abundant (the Pasteur effect) and allow mitochondria to further oxidize pyruvate to CO2, H2O, and energy catabolites (1). Fine-tuning of this metabolic control is essential for maintenance of adequate cell energy production throughout a range of physiological tissue oxygenation levels. In tumors and in wounds, however, oxygen availability is limited (2, 3). Hypoxia selects cells to undergo a fundamental metabolic adaptation, the “glycolytic switch,” by which glycolysis is uncoupled from respiration and becomes the primary source of cell ATP production (4). The glycolytic switch formally proceeds through downregulation of the Pasteur effect. Although this response is transient in essence, pioneering studies revealed that some tumor cells remain glycolytic even when oxygen availability is restored (5). Persistence of aerobic glycolysis, the Warburg effect, is a characteristic of cancer cells and a hallmark of advanced cancers (6). It involves stable genetic and epigenetic changes that are still incompletely understood.
Glycolysis provides only 2 ATP molecules for each glucose, whereas respiration provides 38 ATP molecules. Interestingly however, bioenergetic measurements have shown that global ATP concentration and adenylate energy charge change only marginally in tumors compared with normal tissues (7–9). Strong evidence also indicates that the glycolytic phenotype of cancer cells is a crucial component of malignancy that confers a significant growth advantage (10). Our study focused on the nature of this advantage and on its relevance as a therapeutic target. We found that lactate, the end-product of glycolysis, is the keystone of an exquisite symbiosis in which glycolytic and oxidative tumor cells mutually regulate their access to energy metabolites. We also identified monocarboxylate transporter 1 (MCT1) as the gatekeeper of this metabolic symbiosis: using 3 different tumor models, we validated MCT1 inhibition as what we believe to be a new, efficient anticancer treatment alone and in combination with radiotherapy. The efficacy and safety profile of MCT1 inhibition in experimental tumors and the expression of MCT1 in a variety of primary human tumors strongly support the clinical amenability of this therapeutic strategy.
Results
Metabolic characterization of glycolytic and oxidative tumor cell lines.
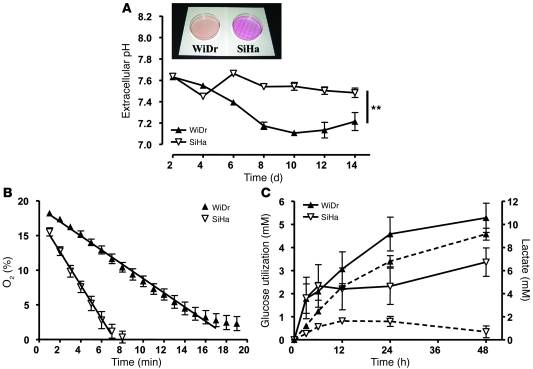
In culture media, phenol red exhibits a gradual color transition from red to yellow over the pH range 8.0 to 6.6. Interestingly, we observed that, when cultured in fresh medium at confluence, some tumor cell lines failed to induce the color shift. Absence of change was typically observed with SiHa human cervix squamous carcinoma cells, whereas WiDr human colorectal adenocarcinoma cells induced the color transition (Figure 1A, inset). Extracellular pH measurements confirmed that WiDr cell cultures gradually became more acidic, whereas SiHa cell cultures did not acidify (Figure 1A). We therefore suspected that the 2 cell lines had a different metabolic behavior in vitro.
Figure 1. Metabolic characterization of oxidative SiHa and glycolytic WiDr tumor cell lines.
(A) pH of cell culture supernatants after reaching cell confluence on day 0 was measured with a pH meter. Inset shows typical dishes containing confluent WiDr and SiHa cells in phenol red–containing medium. **P = 0.0013 (2-way ANOVA; n = 3). (B) An equal amount (2 × 10⁷ cells/ml) of viable SiHa and WiDr cells were placed in a sealed tube containing an EPR oxygen sensor. EPR measurements revealed a significant difference (P < 0.0001) in the rate of oxygen consumption between SiHa and WiDr tumor cells (Student’s t test; n = 5–9). (C) At time 0, confluent cells received fresh medium containing glucose and FBS. Glucose utilization (solid lines, left y axis) and lactate concentration in the cell supernatant (dotted lines, right y axis) were determined enzymatically. Note the different scales of the left and right y axes. n = 4. Error bars represent the SEM and are sometimes smaller than symbols.
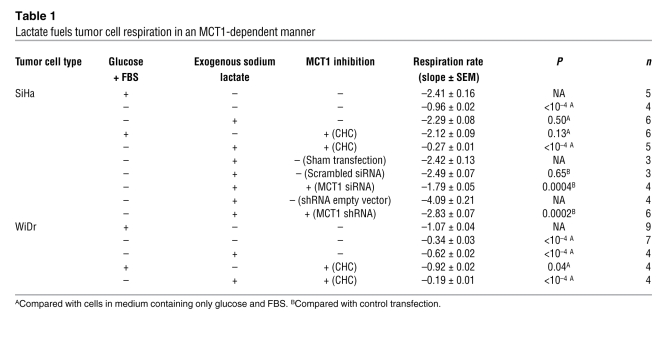
In sealed tubes, cells consume available oxygen at a rate dictated by their oxidative capacity (11), which can be measured using electron paramagnetic resonance (EPR). Using this technique, we observed that WiDr cells had a lower rate of oxygen consumption than did SiHa cells (Figure 1B and Table 1), suggesting that medium acidification by WiDr cells was not due to accumulation of CO2 from respiration. Rather, glucose and lactate measurements revealed that, with adequate oxygen supply, WiDr cells exhibited predominantly a glycolytic metabolism (Warburg phenotype), as they released 2 lactate molecules for each glucose consumed (Figure 1C). Curve fitting (R2 = 0.97) indicated that export of lactate used a saturable pathway. In contrast, SiHa cells exhibited an oxidative metabolism characterized by lower glucose utilization and limited lactate release. The bell-shaped aspect of the lactate concentration curve in SiHa cell medium suggested that these cells could take up and perhaps metabolize lactate.
Table 1 .
Lactate fuels tumor cell respiration in an MCT1-dependent manner
Lactate fuels tumor cell respiration preferentially to glucose.
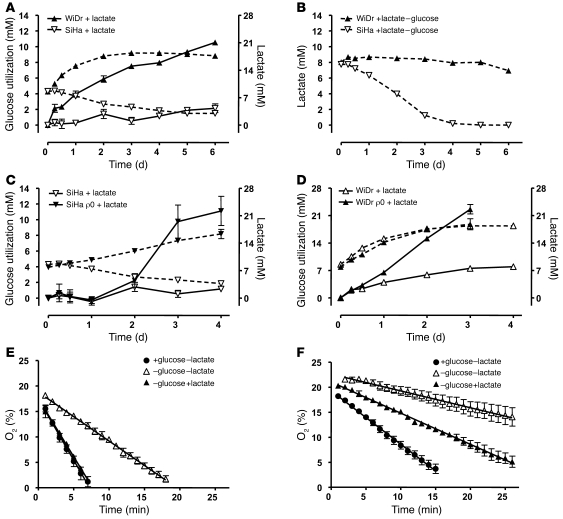
Existence of a lactate consumption pathway was tested in vitro as cells received exogenous lactate. Sodium lactate was used at a concentration of 10 mM to match lactate release achieved by WiDr cells in vitro; this concentration also corresponds to the range of lactate detected in tumors (9). In the presence of glucose and lactate, oxidative SiHa cells switched from glucose to lactate uptake and thus imported consistently less glucose than in the absence of lactate (Figure 2A). The average rate of glucose utilization was significantly lower in the presence of lactate (0.29 ± 0.06 mM/d) than in its absence (1.68 ± 0.31 mM/d; P = 0.0016, Student’s t test; n = 4–5). Profoundly contrasting with SiHa cells, lactate production by WiDr cells was insensitive to exogenous lactate. The glycolytic stoichiometry was lost, which further documented the saturable nature of this pathway. When glucose was removed, lactate only marginally entered WiDr cells (which eventually died) but was massively cleared by SiHa cells (Figure 2B). Furthermore, induction of mitochondrial dysfunction in mitochondrial DNA–depleted (ρ0) SiHa cells caused a switch from lactate oxidation to glycolysis (Figure 2C), which indicated that the normal fate of lactate is to fuel the TCA cycle in these cells. Compared with wild-type cells, ρ0 WiDr cells showed increased glucose uptake despite unchanged lactate release (Figure 2D).
Figure 2. Lactate is a substrate for oxidative tumor cell metabolism.
(A and B) Enzymatic assays were used to determine glucose utilization (solid lines) and lactate concentration in the supernatant of confluent cells (dotted lines). Note the different scales of the left and right y axes in A. At time 0, cells received fresh medium containing glucose, FBS, and sodium lactate (A) or medium containing sodium lactate but no glucose and FBS (B). n = 4–5. (C and D) ρ0 SiHa and WiDr cells were produced by a chronic treatment with low-dose ethidium bromide. Then, cells were cultured in fresh medium containing glucose, FBS, and sodium lactate from time 0. Glucose utilization (solid lines, left y axes) and lactate concentration in the supernatant of confluent cells (dotted lines, right y axes) were assayed enzymatically to compare the metabolic activity of wild-type versus ρ0 SiHa cells (C) and wild-type versus ρ0 WiDr cells (D). Note the different scales of the left and right y axes. n = 3–5. (E and F) EPR measurements of tumor cells oxygen consumption by SiHa cells (E) and WiDr cells (F) in the indicated experimental culture media. Statistical analyses are presented in Table 1. Error bars represent the SEM and are sometimes smaller than symbols.
We then showed that exogenous lactate could efficiently replace glucose to fuel SiHa cell respiration (Figure 2E and Table 1), whereas respiration was dramatically reduced in the absence of both glucose and lactate. The respiration rate of WiDr cells, which was already low in the presence of glucose (see Figure 1B), decreased sharply upon glucose removal (Figure 2F). Interestingly, exogenous lactate rescued part of WiDr cell respiration, providing evidence that lactate can also fuel the marginal oxidative metabolism of dominantly Warburg phenotype tumor cells. We verified the existence of lactate-fueled respiration in vivo using NMR. Thirty minutes after [13C]lactate delivery to tumor-bearing mice, we consistently detected its TCA metabolite [13C]glutamate in SiHa and WiDr tumors (data not shown).
MCT1 gates lactate-fueled ATP production in tumor cells.
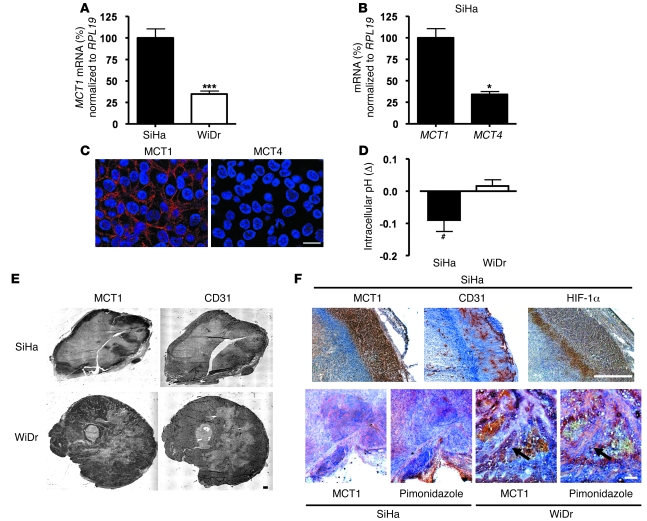
In nonmalignant tissues, the lactate anion can shuttle between intracellular and extracellular compartments through MCTs that function as passive lactate-proton symporters (12). Among known isoforms, MCT4 has been detected at the plasma membrane of glycolytic muscle fibers, where it facilitates lactate export (13), and MCT1 at the plasma membrane of oxidative fibers, where it mediates lactate uptake during intensive training or supramaximal exercise (14–16). Here, we found that oxidative SiHa tumor cells, like oxidative muscle fibers, constitutively expressed MCT1 mRNA at a higher relative level compared with glycolytic WiDr cells (Figure 3A). In SiHa cells, MCT1 was more actively transcribed than MCT4 (Figure 3B), whereas MCT4 was preferentially expressed in WiDr cells (data not shown). The plasma membrane expression of MCT1 in SiHa cells contrasted with the scattered cytosolic, almost undetectable expression of MCT4 (Figure 3C), suggesting that lactate uptake by these cells primarily depends on MCT1. To confirm MCT involvement in lactate uptake, we measured changes in intracellular pH in response to acute lactate exposure. A small but significant decrease in intracellular pH was observed in SiHa cells exposed to exogenous lactate (Figure 3D), indicating activation of a lactate-proton symporter. In contrast, intracellular pH remained unchanged in WiDr cells after lactate treatment.
Figure 3. Oxidative tumor cells prominently express MCT1.
(A) qRT-PCR analysis showing higher MCT1 mRNA expression in oxidative SiHa tumor cells compared with glycolytic WiDr tumor cells. ***P = 0.0002 (Student’s t test; n = 8–13). (B) qRT-PCR analysis also showed that oxidative SiHa cells expressed higher levels of MCT1 compared with MCT4 mRNA. *P = 0.0116 (Student’s t test; n = 3–13). (C) MCT1, but not MCT4, is expressed at the plasma membrane of oxidative SiHa tumor cells. Representative confocal pictures show fluorescent staining of MCT1 (red), MCT4 (red), and nuclei (blue) in cultured cells. (D) SiHa and WiDr cells were loaded with the intracellular pH sensor C.SNARF1-AM. Intracellular pH was determined from fluorescence emission before and after addition of sodium lactate to the cell culture medium maintained at pH 7.3. Columns represent the difference (Δ) between the intracellular pH measured in the presence of exogenous lactate and the intracellular pH measured in the absence of exogenous lactate. #P = 0.0393 (Student’s t test; n = 4). (E and F) Immunohistological analyses of tumor biopsies revealed that MCT1 is expressed in both SiHa and WiDr tumors in vivo and that MCT1 expression and hypoxia are mutually exclusive. (E) Representative pictures of whole SiHa and WiDr tumor sections. (F) Representative pictures are shown with H&E counterstaining. Arrows indicate typical mutually exclusive MCT1 and pimonidazole stainings in WiDr tumors. Scale bars: 20 μm (C), 0.5 mm (E and F). Error bars represent SEM.
Immunostaining of SiHa and WiDr tumor biopsies revealed localization of MCT1 at the vascularized tumor periphery and around blood vessels (Figure 3E). This similar pattern of expression indicated that, although the metabolic phenotype of SiHa and WiDr cells diverge in vitro, local pO2 and MCT1 expression may vary in vivo according to the oxidative capacity of tumor cells. We further documented that SiHa tumors contained 2 viable tumor cell subpopulations defined by differential pO2 and MCT1 expression. A first subset of cells, located in the well-vascularized (positive CD31 staining) and oxygenated (negative HIF-1α and pimonidazole stainings) tumor margin, expressed MCT1 (Figure 3F). The other subpopulation was hypoxic (positive for HIF-1α and pimonidazole), poorly vascularized, and did not express MCT1. MCT1 expression and hypoxia were also mutually exclusive in WiDr tumors (Figure 3F).
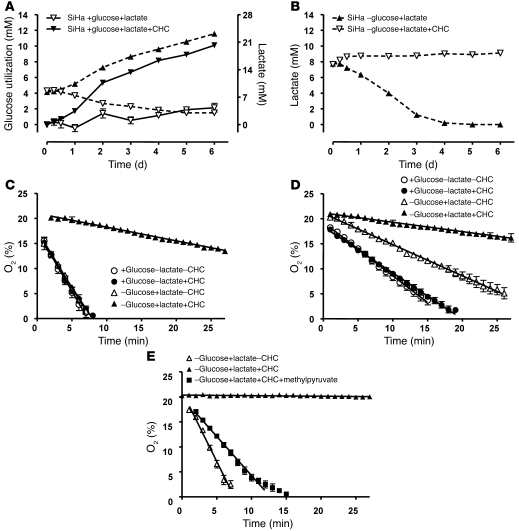
Existence of distinct tumor cell phenotypes indicated that exogenous lactate and MCT1 could play important functions in tumors. It was verified using α-cyano-4-hydroxycinnamate (CHC), a drug known to reversibly inhibit MCT1 with approximately 10-fold selectivity compared with other MCTs (17). MCT1 inhibition induced a switch from lactate to glucose utilization by SiHa cells (Figure 4A). In fact, upon MCT1 inhibition, oxygenated cells became entirely glycolytic, consuming glucose abundantly and releasing lactate stoichiometrically, thereby recapitulating the Warburg phenotype. Importantly, when lactate was the sole energy source, MCT1 inhibition blocked both lactate uptake (Figure 4B) and SiHa cell respiration (Figure 4C and Table 1) and induced tumor cell death. CHC also prevented partial rescue of respiration by lactate in glucose-deprived WiDr cells (Figure 4D), which is in agreement with previous studies documenting lactate uptake by glycolytic tumor cells when cultured in the absence of glucose (18, 19). Of note, CHC did not affect either SiHa or WiDr cell respiration in the presence of glucose, indicating that the mitochondrial function is independent of MCT1 in these cells (20). Methylpyruvate, a membrane-permeable form of pyruvate (21), almost totally rescued the respiration of SiHa cells in the presence of lactate and CHC (Figure 4E). SiHa respiration rates (slope ± SEM) were –2.81 ± 0.16 in the presence of lactate alone (n = 8), –0.01 ± 0.01 for lactate plus CHC (n = 4), and –1.56 ± 0.06 in the presence of lactate, CHC, and methylpyruvate (n = 8). Moreover, we found that a significant reduction in MCT1 expression (>90%, obtained after transfection with a specific siRNA or a specific shRNA) was associated with a decreased rate of lactate-fueled SiHa cell respiration (Table 1). Although full protein extinction was not achieved in our experimental conditions (and probably accounts for residual respiration), this observation confirms the prominent role of MCT1 compared with other MCT isoforms in mediating lactate uptake to fuel oxidative tumor cell respiration.
Figure 4. MCT1 inhibition blocks lactate-fueled tumor cell respiration.
(A and B) Enzymatic assays were used to determine glucose utilization (solid lines) and lactate concentration (dotted lines) in the supernatant of confluent cells. Note the different scales of the y axes in A. At time 0, cells received fresh medium containing glucose, FBS, and sodium lactate (A) or medium containing sodium lactate but no glucose and FBS (B). The MCT1 inhibitor CHC was added where indicated. n = 4–5. (C–E) EPR measurements of tumor cell oxygen consumption by SiHa (C and E) and WiDr cells (D) in the indicated experimental culture media. Statistical analyses of C and D are presented in Table 1. Error bars represent the SEM and are sometimes smaller than symbols.
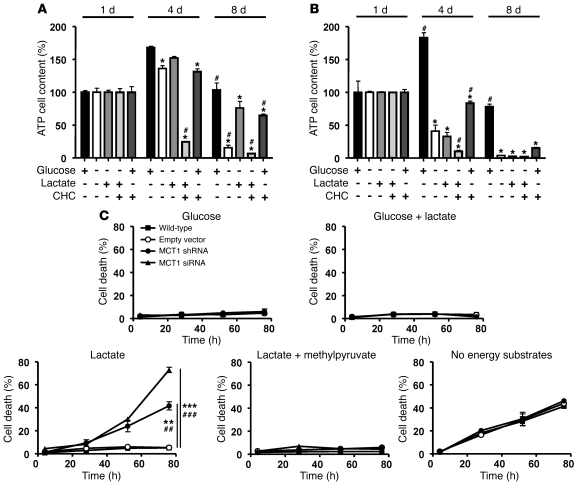
From the bioenergetic standpoint, lactate oxidation would be futile if not yielding ATP production. We therefore measured intracellular ATP and found that replacement of glucose by lactate almost entirely preserved ATP stores in SiHa cells (Figure 5A). In the presence of glucose, CHC did not poison mitochondria (see Figure 4C) and, accordingly, only marginally influenced glucose-fueled ATP production by SiHa cells. However, when lactate was the sole energy source, MCT1 inhibition caused rapid ATP breakdown and cell death. These responses were even faster than in the absence of both glucose and lactate. In WiDr cells deprived of glucose, the decrease in ATP was not rescued by lactate (Figure 5B). Interestingly, however, MCT1 inhibition partially reduced glucose-fueled ATP synthesis, which, together with our other results, indicates that WiDr cells may recycle part of their own lactate production to produce energy oxidatively. To formally demonstrate its role in controlling lactate respiration, we silenced MCT1 with a specific shRNA or a specific siRNA in SiHa cells. RT-PCR confirmed a 94.5% ± 1.5% and a 92.3% ± 2.6% transcript reduction, respectively. While MCT1 silencing did not affect cell survival in glucose-containing media (with or without lactate), it induced cell death when lactate was the only source of energy (Figure 5C). In the latter situation, cells were rescued by the addition of methylpyruvate, which confirms that MCT1 inhibition did not have an impact on the mitochondrial function of these cells (see also Figure 4, C and E). Importantly, MCT1 silencing was as efficient as complete removal of all energy substrates to induce SiHa tumor cell death, demonstrating the absolute requirement of MCT1 over other transporters to fuel tumor cell respiration with lactate. Survival of sham-transfected and wild-type SiHa cells were not different from each other in all media tested. In contrast, MCT1 silencing did not modulate WiDr cell death that occurred independently of exogenous lactate upon glucose removal (Supplemental Figure 1; supplemental material available online with this article; doi: 10.1172/JCI36843DS1).
Figure 5. MCT1 inhibition prevents lactate-fueled ATP production and the survival of oxidative tumor cells.
(A and B) ATP content was determined over time in SiHa (A) and WiDr (B) cells using a bioluminescence assay. Cells were cultured in the indicated media. *P < 0.05 compared with medium containing only glucose. #P < 0.05 compared with medium containing only lactate (Student’s t test; n = 4). (C) SiHa cells were transfected with a specific MCT1 shRNA or siRNA or a control vector, or were left untreated. After a 24-hour recovery period, cells were cultured in the indicated media from time 0. Cell death was determined over time using a NucleoCounter. Slope comparison: **P = 0.0014 and ***P = 0.0003 compared with wild-type cells; ##P = 0.0013 and ###P = 0.0003 compared with control vector transfection (Student’s t test; n = 3–7). Error bars represent the SEM and are sometimes smaller than symbols.
MCT1 inhibition exerts antitumor effects.
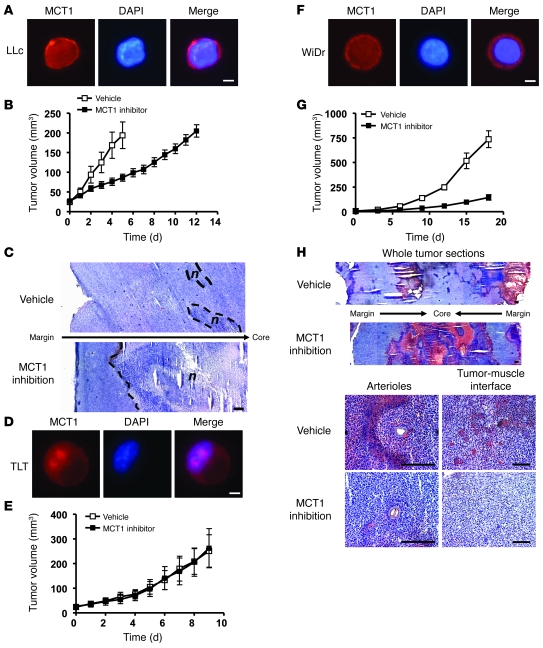
To test the in vivo relevance and the therapeutic amenability of the lactate pathway that we identified, we sought to determine the antitumor potential of MCT1 inhibition. We used daily CHC delivery as a treatment protocol: no overt systemic toxicity was observed at this drug regimen (Supplemental Figure 2). We first selected 2 experimental mouse models based on MCT1 expression. In the first model, Lewis lung carcinoma (LLc) cells expressed MCT1 at the plasma membrane (Figure 6A). Intramuscular injection of these cells generated aggressive malignancies in the hindlimbs of syngeneic mice (Figure 6B). In this model, chronic MCT1 blockade induced sustained tumor growth retardation. Analysis of size-matched LLc tumors at the end of treatments revealed extensive central necrosis after MCT1 inhibition (Figure 6C). In the second model, hepatocarcinoma (transplantable liver tumor [TLT]) cells did not express MCT1 at the plasma membrane (Figure 6D). The corresponding tumors were also totally insensitive to daily CHC (Figure 6E), confirming that the antitumor efficacy of MCT1 inhibition is restricted to tumor cells expressing MCT1 at the plasma membrane. These data also allow us to exclude a major contribution of host cells to the response to the MCT1 inhibitor (22) and off-target effects. It is well known that SiHa cells do not reproducibly generate tumors in vivo. To extend our paradigm to human tumors, we therefore chose to use WiDr tumors, in which oxygenated tumor cells consistently expressed MCT1 in vivo (see Figure 3, E and F). MCT1 was also found at the plasma membrane of WiDr cells in vitro (Figure 6F). As in the LLc model, chronic MCT1 inhibition sustainably delayed WiDr tumor growth (Figure 6G), mostly because of the extension of a necrotic area at the center of the tumor (as determined on size-matched treated and untreated tumors; Figure 6H). Compared with vehicle, MCT1 inhibition also dramatically reduced hypoxia at the tumor periphery. Increased tumor oxygenation was particularly evident around arterioles (where the hypoxic front had completely disappeared) and at the tumor-muscle interface. CHC-treated tumors also showed a lower density of hypoxic islets in the viable tumor cell compartment. This relief of tumor hypoxia very likely results from decreased tumor cell oxygen consumption upon MCT1 inhibition (see Figure 4D). These data also reveal that microenvironmental influences can stimulate MCT1-mediated lactate consumption, which is otherwise nonexistent in vitro. A model of tumor metabolic symbiosis underscoring the outcomes of anti-MCT1 strategy is presented in Figure 7.
Figure 6. MCT1 inhibition delays tumor growth, induces tumor core necrosis, and decreases tumor hypoxia.
(A) MCT1 is expressed at the plasma membrane of mouse LLc cells. Representative pictures show fluorescent staining of MCT1 (red) and nuclei (blue) in cultured cells. (B) From day 0, LLc tumor growth was determined in groups of mice treated with daily CHC (25 μmol in 200 μl i.p.) or vehicle. n = 11–17. (C) Representative H&E staining of biopsies of size-matched tumors after treatments. Dashed lines delineate necrosis (n). (D) MCT1 is not expressed at the plasma membrane of mouse TLT cells. Representative pictures show fluorescent staining of MCT1 (red) and nuclei (blue) in cultured cells. (E) Similar analysis was performed as in B, but using TLT cells. n = 6. (F) Similar analysis was performed as in A, but using WiDr human colorectal adenocarcinoma cells. (G) Similar analysis was performed as in B, but using WiDr cells in athymic Balb/C mice. n = 9–15. (H) Representative histological pictures of pimonidazole staining of WiDr tumor biopsies at the end of the tumor growth delay assay are shown with H&E counterstaining. Top: Analysis of whole tumor sections revealed extensive necrosis at the core of tumors from an animal treated with the MCT1 inhibitor. Bottom: MCT1 inhibition decreased tumor hypoxia around arterioles and at the tumor-muscle interface at the tumor periphery. Scale bars: 20 μm (A, D, and F); 200 μm (C and H). Error bars represent SEM.
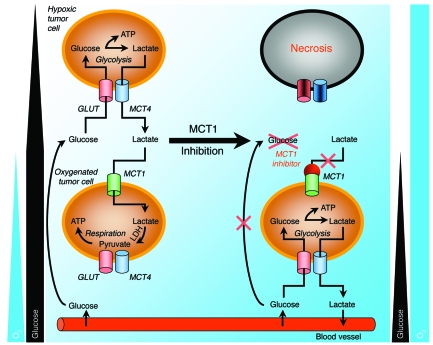
Figure 7. Model for therapeutic targeting of lactate-based metabolic symbiosis in tumors.
Hypoxic tumor cells depend on glucose and glycolysis to produce energy. Lactate, the end-product of glycolysis, diffuses along its concentration gradient toward blood vessels. By contrast, oxygenated tumor cells import lactate (a process mediated by MCT1 located at the cell plasma membrane) and oxidize it to produce energy. In the respiration process, lactate is a substrate preferred to glucose. As a consequence, glucose freely diffuses through the oxygenated tumor cell sheath to fuel glycolysis of distant, hypoxic tumor cells. This metabolic symbiosis can be disrupted by MCT1 inhibition. Upon MCT1 inhibition, oxidative tumor cells switch from lactate oxidation to glycolysis, thereby preventing adequate glucose delivery to glycolytic cells, which die from glucose starvation. This glycolytic switch is associated with a decrease in oxygen consumption of surviving tumor cells, which is responsible for increased tumor pO2. MCT1 inhibition is thus a potent antitumor strategy that indirectly eradicates hypoxic/glycolytic tumor cells. GLUT, glucose transporter.
MCT1 inhibition radiosensitizes tumors.
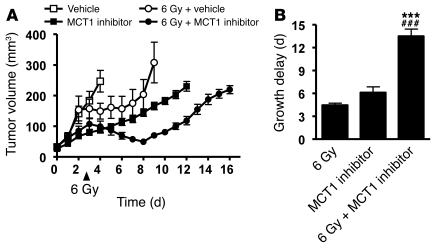
To confirm and exploit increased tumor pO2 resulting from the metabolic switch to glycolysis in oxidative cells, we combined MCT1 inhibition and radiotherapy to treat LLc tumors in mice. As single therapeutic modalities, MCT1 inhibition or a 6-Gy irradiation induced similar effects on tumor growth, with a small advantage for MCT1 inhibition (Figure 8, A and B). Importantly, the overall benefit of combined treatment on tumor growth retardation (growth delay of 13.5 ± 0.9 days) was significantly increased compared with calculated additive effects (+10.5 ± 0.8 days; P = 0.0424, Student’s t test). These data underscore the therapeutic impact of targeting MCT1-driven symbiosis between hypoxic and oxygenated tumor cell subpopulations.
Figure 8. MCT1 inhibition radiosensitizes tumors.
LLc tumor–bearing mice were treated with CHC (daily doses of 25 μmol in 200 μl i.p.) or vehicle (200 μl) from day 0, local radiotherapy (1 dose of 6 Gy) on day 3, or combined treatments. (A) Tumor volume was determined daily. (B) Treatment efficacy was compared after determination of tumor growth delays. ***P < 0.001 compared with 6 Gy; ###P < 0.001 compared with MCT1 inhibitor alone (1-way ANOVA; n = 6–12). Error bars represent the SEM and are sometimes smaller than symbols.
MCT1 is expressed in an array of human tumors.
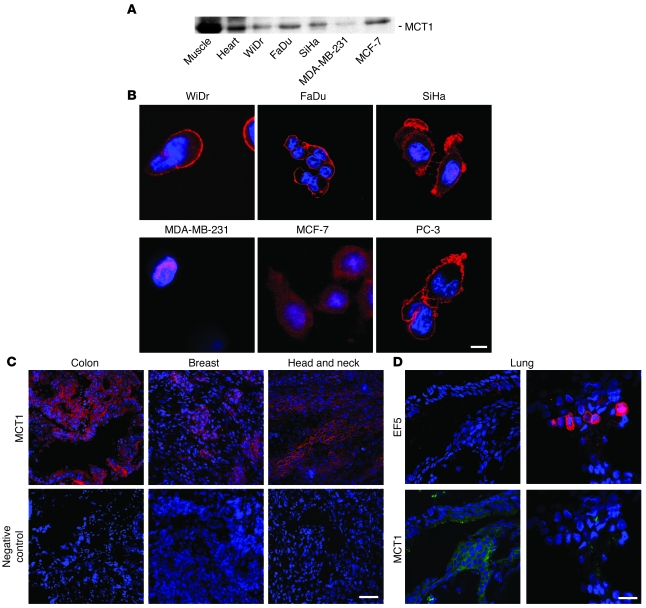
We concluded our study by evaluating MCT1 distribution in a range of human tumors of different origins. In addition to WiDr colorectal adenocarcinoma and SiHa cervix squamous cell carcinoma, MCT1 was detected in human squamous cell carcinoma (FaDu) and human breast adenocarcinoma (MCF-7) cell lines (Figure 9A). Muscle and heart were used as positive controls (12), and the human breast cancer cell line MDA-MB-231, in which MCT1 is silenced by gene methylation (23), was used as a negative control. MCT1 plasma membrane expression was present in 4 of 6 tumor cell lines tested, including WiDr, FaDu, SiHa, and human prostate cancer PC-3 (Figure 9B). It was absent in MDA-MB-231 cells. In MCF-7 cells, clustered cytoplasmic localization suggested mitochondrial expression of the transporter (20). MCT1 was also present in biopsies of primary human colon, breast, head and neck, and lung cancers (Figure 9, C and D). In human colon cancer, we detected strong MCT1 expression in 78% (7 of 9) of independent biopsies (data not shown). Of note, as in our experimental models (see Figure 3F), MCT1 expression and hypoxia (2-[2-nitro-1H-imidazol-1-yl]-N-[2,2,3,3,3-pentafluoropropyl] acetamide [EF5] staining) were mutually exclusive in primary human lung tumors (Figure 9D). In the clinical context, MCT1 expression is thus also in line with its function of facilitator of lactate respiration.
Figure 9. MCT1 is expressed in a variety of different human tumor cell lines and primary human tumor biopsies.
(A and B) MCT1 was detected by western blot (A) and confocal microscopy (B) in human tumor cell lines and control tissues. Note the plasma membrane expression of the lactate transporter in WiDr, FaDu, SiHa, and PC-3 cancer cells. (C) MCT1 (red) and nuclei (blue) were detected using immunofluorescence in biopsies of primary human colon, breast, and head and neck human cancers. (D) MCT1 and hypoxia were detected in cryoslices of a primary human lung cancer. The patient had received EF5 before tumor biopsy. Representative confocal microscopy pictures revealed that the staining of MCT1 (green) and of the hypoxia marker EF5 (red) did not overlap. Scale bars: 20 μm (B); 100 μm (C and D).
Discussion
Lactic acid (negative logarithm of the acid ionization constant [pKa] 3.86) is almost fully dissociated in biological fluids. Although important roles have been ascribed to protons in tumor progression (24), the biological contribution of lactate has been largely ignored. Interestingly, however, lactate accumulation in human tumors was shown to be associated with metastasis, tumor recurrence, and poor survival (25–27). Our study identifies lactate as a prominent fuel for the oxidative metabolism of oxygenated tumor cells and MCT1 as a crucial component of a metabolic symbiosis based on lactate exchange in tumors. Accordingly, using 3 different tumor models, we document that MCT1 inhibition exerts profound antitumor effects alone or in combination with radiotherapy, provided that tumor cells express MCT1, as we found in an array of primary human tumors.
Oxidative preference of tumor cells for lactate over glucose was evidenced in the current study, supporting the concept of a tumor metabolic symbiont. Lactate, released as the end-product of glycolysis in the hypoxic tumor cell compartment, prominently fuels the oxidative metabolism of the oxygenated tumor cell subpopulation, thereby sparing glucose for glycolytic cells. That lactate can substitute glucose for oxidation has also been observed in ischemic brain recovery (28). The mechanism set forward involves a competition between lactate and glucose metabolism for the intracellular NAD+ pool. Existence of this feedback could provide several advantages to oxidative tumor cells. First, oxidation of lactate to pyruvate by lactate dehydrogenase (LDH) involves the sustained production of reducing equivalents that could buffer tumor oxidative stress (29) and activate prosurvival pathways (30). Second, lactate oxidation does not require the initial energy input that drives ATP production from glucose. Third, respiration of lactate yields 18 ATP per lactate molecule and spares energy normally intended for housekeeping glycolytic enzymes. Lactate oxidation is thus more concise and more effective than glucose in the tumor cell energy metabolism under aerobic conditions.
Shuttling of lactate between hypoxic and oxygenated sites in tumors is reminiscent of muscle physiology (12, 13). Indeed, during intense or supramaximal exercise, fast-twitch glycolytic fibers (white muscle) produce and release lactic acid (16). Extracellular lactate is then removed by oxidation in slow-twitch fibers (red muscle), which recycle it as a respiratory fuel (14–16). These activities are mediated by MCTs, among which MCT1–MCT4 are known to passively convey lactate across cell membranes (12, 13). MCT4 is a low-affinity lactate transporter (Km = 22 mM), which is adapted to the release of lactate from glycolytic cells such as white muscle fibers (31). It is hypoxia inducible (32). Conversely, MCT1 has a higher affinity for lactate (Km = 3.5–10 mM) and is predominantly found at the plasma membrane of oxidative muscle fibers, where it promotes lactate influx and oxidation (13, 16, 32). While MCT4 is part of the arsenal of proton extruders in glycolytic tumor cells (33), we here formally demonstrate that MCT1 is the foremost facilitator of lactate uptake by oxidative tumor cells. MCT1 silencing was sufficient to inhibit lactate-fueled respiration and survival of tumor cells as efficiently as complete metabolite energy starvation. The oxygen dependence of MCT1 expression accounts for its distribution in oxygenated tumor areas and brings its expression in line with its function as a mediator of lactate oxidation. Similar to angiogenesis, which is physiological in essence, the lactate exchange system of the exercising muscle is thus usurped by cancer cells.
Using a pharmacological inhibitor and silencing RNAs, we have documented antitumor effects of MCT1 inhibition without overt toxicity in 3 different models of animal and human tumors (see also Supplemental Data). Although it targets oxygenated cells close to drug-supplying blood vessels, MCT1 inhibition indirectly induces necrosis of distant hypoxic tumor cells known to be resistant to conventional antitumor treatments and responsible for tumor relapse (34) (see Figure 7). Hypoxic cell death by virtue of glucose starvation originates from a switch from lactate oxidation to glycolysis (and avid glucose uptake) in oxygenated tumor cells, which can logically be attributed to the inhibition of cell respiration by glucose (“Crabtree effect”) (35). The same metabolic switch accounts for reduced oxygen consumption by surviving tumor cells and, thereby, tumor radiosensitization after MCT1 inhibition.
That the lactate-MCT1 pathway is the keystone for metabolic symbiosis in tumors sheds a new light on previous reports. First, the energy substrate nature of lactate provides what we believe is an unprecedented explanation for its autocrine growth factor activity, which has been authenticated in vitro (36) and for its bidirectional transport in different cell types according to the experimental conditions (18, 19, 37). Second, our study extends to tumor cells a mechanism that has previously been described as a process exploited by stromal cells to buffer products of the anaerobic metabolism of cancer cells (22). Of note, potential interference with the capacity of stromal cells to take up lactate did not appear to be part of the antitumor effects that we observed: the expression of MCT1 by tumor cells was the key factor in anticipating a therapeutic response (i.e., tumors generated from MCT1-negative TLT cells were insensitive to the treatment). Conversely, as shown in the WiDr model, the relative expression or activity of MCT1 in vitro had no prognostic value for therapeutic gain in vivo, most probably because the onset of metabolic symbiosis is under the control of microenvironmental influences. Finally, a number of reports have attributed to MCT1 a role in lactate efflux in tumor cells with active aerobic glycolysis (33, 38–41). These studies showed further evidence of lethal intracellular acidification upon MCT1 inhibition in vitro. Our observations that in vivo MCT1 expression and hypoxia are mutually exclusive indicates that this form of death could only marginally account for the antitumor effects of MCT1 inhibition. Our results strongly suggest that there are no significant off-target effects of CHC on lactate export (that would equally kill Warburg phenotype cells at the tumor periphery) or on metabolite trafficking in the mitochondrion.
MCT1 is expressed in a variety of human cancer cell lines and in primary human tumors, including breast, head and neck, and lung cancers (Figure 9, C and D) as well as neuroblastoma (40), brain (42), and colon (ref. 22, ref. 43, and Figure 9C) cancers. Broad MCT1 distribution among human cancers opens promising therapeutic perspectives for the development and clinical evaluation of pharmacological MCT1 inhibitors. Our study demonstrates the need for a careful selection of patients with a plasma membrane expression of MCT1 as well as the benefit of combining MCT1 inhibition with conventional anticancer therapies, particularly radiotherapy.
Methods
Cells.
WiDr human colorectal adenocarcinoma, SiHa human cervix squamous cell carcinoma, LLc mouse carcinoma, TLT mouse hepatocarcinoma (44), FaDu human squamous cell carcinoma, MDA-MB-231 human breast cancer, MCF-7 human breast adenocarcinoma, and PC-3 human prostate cancer cells were routinely cultured in DMEM containing 4,500 mg/l glucose with 10% FBS. For some metabolic assays, cells were cultured in DMEM without glucose or FBS (Krackeler Scientific). ρ0 cells were produced as previously described (45). Sodium lactate (10 mM), methylpyruvate (10 mM), and CHC (5 mM in cell cultures) were from Sigma-Aldrich. All media were buffered at pH 7.3, supplemented with 1% penicillin-streptomycin, and were pyruvate free and glutamine free. To minimize artifactual variations due to unequal growth rates and cell sizes, all assays were performed on confluent cells in fresh medium.
In vivo experiments.
Tumor cells (106 in 100 μl saline) were injected intramuscularly in the rear leg of mice: SiHa or WiDr cells in female athymic Balb/C mice (NIH), LLc cells in syngeneic C57BL/6J mice (Elevage Janvier), and TLT cells in syngeneic Rj:NMRI mice (Elevage Janvier). Tumor growth delays were carried out as previously described (46). Vehicle or CHC (25 μmol in 200 μl; ref. 47) was injected i.p. each day. For NMR, 50 μl of a 100 mM solution of [3-13C]lactate (Sigma-Aldrich) in saline were infused i.v. to tumor-bearing mice. For the determination of hypoxia, tumor-bearing mice received an i.p. injection of 70 mg/kg pimonidazole (Chemicon) before sacrifice. Where indicated, tumors in anesthetized mice (ketamine/xylazine) were irradiated using the RT-250 device (Philips) following an established protocol (48). Mouse care and experimental procedures were approved by Duke Institutional Animal Care and Use Committee and by Université catholique de Louvain authorities according to national animal care regulations.
pH and metabolite measurements.
Extracellular pH was measured with a pH meter. Intracellular pH was measured at extracellular pH 7.3 using the pH sensor 5-(and-6)-carboxy-seminaphthorhodafluor-acetoxymethylester (C.SNARF1-AM; Invitrogen), as previously described (33). Lactate and glucose concentrations were measured on deproteinized supernatant samples using a CMA600 microdialysis analyzer.
Oxygen consumption assay.
Determination of cell oxygen consumption was carried out using EPR as previously reported (49). Briefly, 2 × 10⁷ viable cells/ml were sealed in glass capillary tubes in the presence of 0.2 mM of the O2 sensor 4-oxo-2,2,6,6-tetramethylpiperidine-d-15N-1-oxyl (CDN isotopes) and with CHC where indicated. Cells were maintained at 37°C during recording on a Bruker EMX EPR spectrometer operating at 9 GHz.
NMR.
Tumors were collected 30 minutes after [3-13C]lactate delivery to mice, weighted, washed with cold PBS, and extracted with cold 0.9 M perchloric acid. Tumor extracts were neutralized and lyophilized. 13C NMR analysis was carried out with a 500-MHz Varian Inova spectrometer operating at 125.7 MHz, with 45° pulse and 0.8-second repetition time in a 5-mm tunable broadband probe. Dioxane was used as an internal standard.
Quantitative RT-PCR and western blotting.
We used previously reported protocols for SYBR Green quantitative PCR (50) and western blotting (51). hMCT1 primers were sense, 5′-GTGGCTCAGCTCCGTATTGT-3′, antisense, 5′-GAGCCGACCTAAAAGTGGTG-3′. hMCT4 primers were sense, 5′-CAGTTCGAGGTGCTCATGG-3′, antisense, 5′-ATGTAGACGTGGGTCGCATC-3′. Housekeeping control human ribosomal protein L19 (hRPL19) primers were sense, 5′-CAAGCGGATTCTCATGGAACA-3′, antisense, 5′-TGGTCAGCCAGGAGCTTCTT-3′. For western blots, primary anti-MCT1 and anti-MCT4 antibodies were from Chemicon, and the antibody against β-actin was from Sigma-Aldrich.
Immunohistochemistry.
Tumor cryoslices from mouse biopsies were permeabilized with 0.1% Triton X-100, stained using the VECTASTAIN ABC kit (Vector Laboratories) according to the manufacturer’s protocol, developed using NovaRED solution (Vector Laboratories), and counterstained with Harris’s hematoxylin. Primary human tumor cryoslices from a tissue bank constituted under approval of the Duke University Institutional Review Board were permeabilized with 0.1% Triton X-100 and stained with the primary antibody indicated in Figure 9, C and D. Primary antibodies were rat monoclonal against CD31 (BD Biosciences — Pharmingen) and rabbit polyclonals against MCT1 or MCT4 (both from Chemicon), HIF-1α (Santa Cruz Biotechnology Inc.), pimonidazole (gift from James Raleigh, University of North Carolina at Chapel Hill, Chapel Hill, North Carolina, USA), and EF5 (gift from Cameron Koch, University of Pennsylvania, Philadelphia, Pennsylvania, USA). Secondary antibodies were Alexa Fluor 594 or Alexa Fluor 488, where appropriate. Slices were counterstained with Hoechst and Prolong Gold antifade reagent with DAPI (Invitrogen). Omission of the primary antibody was used as staining control.
For immunofluorescence, 104 cells/ml were seeded to adhere for 24 hours in Lab-Tek multichamber slides (VWR) and then cultured for 24 hours in the indicated experimental medium. Cells were rinsed 3 times for 3 minutes each time in HBSS, fixed for 20 minutes in 4% paraformaldehyde in PBS, washed 3 times for 3 minutes each time in PBS, and permeabilized with 0.3% triton in PBS for 10 minutes. After washing (3 times for 3 minutes each time in PBS), cells were blocked for 30 minutes with 5% PBS/BSA. Antigen labeling was then performed using the primary antibodies indicated in Figure 3C; Figure 6, A, D, and F; and Figure 9B in 1% PBS/BSA. The secondary anti-rabbit antibody coupled to TRITC was from Jackson ImmunoResearch Laboratories Inc. Cell nuclei were stained with VECTASHIELD mounting medium containing DAPI (Vector Laboratories). Omission of primary antibodies was used as staining control.
ATP assay.
On day 0, tumor cells (105 in 200 μl of medium as indicated in Figure 5, A and B) were seeded in 96-well plates. ATP cell content was determined over time using the ATP Bioluminescent Somatic Cell Assay kit (Sigma-Aldrich) according to the manufacturer’s recommendations. The conversion of luciferin to oxoluciferin in the presence of ATP generated a fluorescent signal proportional to intracellular ATP that was measured with an IVIS50 Imaging System (Xenogen Corp.).
MCT1 silencing.
Where indicated, cells were transfected with siRNAs as previously reported (50) or with a shRNA according to the manufacturer’s protocol (Invitrogen). Human MCT1-specific siRNA targeted AAGAGGCTGACTTTTCCAAAT sequence, a scrambled siRNA (AACTCGCTGAG-ATTTCGTTAT) served to control specificity, and sham-transfected cells were used as a negative control. The sequence of the MCT1 shRNA was as follows: top, 5′-CACCGCAGTATCCTGGTGAATAAATCGAAATTTATTCACCAGGATACTGC-3′; bottom, 5′-AAAAGCAGTATCCTGGTGAATAAATTTCGATTTATTCACCAGGATACTGC-3′. Transfection of the vector pcDNA 1.2/V5-GW/lacZ served as a negative control. Cells were allowed to recover for 24 hours in DMEM containing 4,500 mg/l glucose and 10% FBS. Exposure to experimental media was set as time 0 for cell survival assays. Prior to O2 consumption measurements, cells were cultured for 6 hours in the appropriate experimental medium.
Cell death assay.
Cell death was quantified using the NucleoCounter device from ChemoMetec according to the manufacturer’s recommendations.
Statistics.
Results are expressed as mean ± SEM. Student’s t test, 1-way ANOVA (Tukey’s post-hoc test), and 2-way ANOVA were used where indicated. For oxygen consumption and cell death assays, the slopes of individual linear regression lines were compared. P < 0.05 was considered statistically significant in all experiments.
Supplementary Material
Acknowledgments
This work was supported by grants from the NIH (CA40355 to M.W. Dewhirst, CA91565 to M.J. Kelley, and CA56690 to M.L. Wahl), by the Fonds de la Recherche Scientifique — Fonds National de la Recherche Scientifique (F.R.S.-FNRS), by an Action de Recherche Concertée grant (ARC 04/09-317) from the Communauté Française de Belgique (to O. Feron), by the NEOANGIO research program from the Région Wallonne de Belgique (to O. Feron), and by the J. Maisin and St. Luc Foundations (to O. Feron). M.W. Dewhirst is the Gustavo S. Montana Professor of Radiation Oncology at Duke University. O. Feron is a Senior Research Associate of the F.R.S.-FNRS. P. Sonveaux and B.F. Jordan are F.R.S.-FNRS Research Associates. For this study, P. Sonveaux was also supported by the Belgian American Educational Foundation (BAEF) and by the Fonds Spéciaux de la Recherche (Université catholique de Louvain).
Footnotes
Nonstandard abbreviations used: CHC, α-cyano-4-hydroxycinnamate; EF5, 2-(2-nitro-1H-imidazol-1-yl)-N-(2,2,3,3,3-pentafluoropropyl) acetamide; EPR, electron paramagnetic resonance; LLc, Lewis lung carcinoma; MCT, monocarboxylate transporter; ρ0, mitochondrial DNA–depleted (cells); TLT, transplantable liver tumor.
Conflict of interest: The authors have declared that no conflict of interest exists.
Citation for this article: J. Clin. Invest. 118:3930–3942 (2008). doi:10.1172/JCI36843
Olivier Feron and Mark W. Dewhirst are co–senior authors.
See the related Commentary beginning on page 3835.
References
- 1.Wu R., Racker E. Regulatory mechanisms in carbohydrate metabolism. IV. Pasteur effect and Crabtree effect in ascites tumor cells. J. Biol. Chem. 1959;234:1036–1041. [PubMed] [Google Scholar]
- 2.Dewhirst M.W. Concepts of oxygen transport at the microcirculatory level. Semin. Radiat. Oncol. 1998;8:143–150. doi: 10.1016/S1053-4296(98)80040-4. [DOI] [PubMed] [Google Scholar]
- 3.Dewhirst M.W. Mechanisms underlying hypoxia development in tumors. Adv. Exp. Med. Biol. 2003;510:51–56. doi: 10.1007/978-1-4615-0205-0_9. [DOI] [PubMed] [Google Scholar]
- 4.Dang C.V., Semenza G.L. Oncogenic alterations of metabolism. Trends Biochem. Sci. 1999;24:68–72. doi: 10.1016/S0968-0004(98)01344-9. [DOI] [PubMed] [Google Scholar]
- 5. Warburg, O. 1930.The metabolism of tumors. Constable. London, United Kingdom. 327 pp. [Google Scholar]
- 6.Semenza G.L., et al. ‘The metabolism of tumours’:70 years later. Novartis Found. Symp. 2001;240:251–260. doi: 10.1002/0470868716.ch17. [DOI] [PubMed] [Google Scholar]
- 7.Vaupel, P.W. 1994. Blood flow, oxygenation, tissue pH distribution, and bioenergetic status of tumors. Lecture 23. Ernst Schering Research Foundation. Berlin, Germany. 79 pp. [Google Scholar]
- 8.Vaupel P. Is there a critical tissue oxygen tension for bioenergetic status and cellular pH regulation in solid tumors? Experientia. 1996;52:464–468. doi: 10.1007/BF01919317. [DOI] [PubMed] [Google Scholar]
- 9.Walenta S., et al. Tissue gradients of energy metabolites mirror oxygen tension gradients in a rat mammary carcinoma model. Int. J. Radiat. Oncol. Biol. Phys. 2001;51:840–848. doi: 10.1016/s0360-3016(01)01700-x. [DOI] [PubMed] [Google Scholar]
- 10.Kim J.W., Dang C.V. Cancer’s molecular sweet tooth and the Warburg effect. Cancer Res. 2006;66:8927–8930. doi: 10.1158/0008-5472.CAN-06-1501. [DOI] [PubMed] [Google Scholar]
- 11.James P.E., Jackson S.K., Grinberg O.Y., Swartz H.M. The effects of endotoxin on oxygen consumption of various cell types in vitro: an EPR oximetry study. Free Radic. Biol. Med. 1995;18:641–647. doi: 10.1016/0891-5849(94)00179-N. [DOI] [PubMed] [Google Scholar]
- 12.Halestrap A.P., Meredith D. The SLC16 gene family-from monocarboxylate transporters (MCTs) to aromatic amino acid transporters and beyond. Pflugers Arch. 2004;447:619–628. doi: 10.1007/s00424-003-1067-2. [DOI] [PubMed] [Google Scholar]
- 13.Halestrap A.P., Price N.T. The proton-linked monocarboxylate transporter (MCT) family: structure, function and regulation. Biochem. J. 1999;343:281–299. doi: 10.1042/0264-6021:3430281. [DOI] [PMC free article] [PubMed] [Google Scholar]
- 14.Baker S.K., McCullagh K.J., Bonen A. Training intensity-dependent and tissue-specific increases in lactate uptake and MCT-1 in heart and muscle. J. Appl. Physiol. 1998;84:987–994. doi: 10.1063/1.368165. [DOI] [PubMed] [Google Scholar]
- 15.Bonen A., et al. Short-term training increases human muscle MCT1 and femoral venous lactate in relation to muscle lactate. Am. J. Physiol. 1998;274:E102–E107. doi: 10.1152/ajpendo.1998.274.1.E102. [DOI] [PubMed] [Google Scholar]
- 16.Dubouchaud H., Butterfield G.E., Wolfel E.E., Bergman B.C., Brooks G.A. Endurance training, expression, and physiology of LDH, MCT1, and MCT4 in human skeletal muscle. Am. J. Physiol. Endocrinol. Metab. 2000;278:E571–E579. doi: 10.1152/ajpendo.2000.278.4.E571. [DOI] [PubMed] [Google Scholar]
- 17.Manning Fox J.E., Meredith D., Halestrap A.P. Characterisation of human monocarboxylate transporter 4 substantiates its role in lactic acid efflux from skeletal muscle. J. Physiol. 2000;529:285–293. doi: 10.1111/j.1469-7793.2000.00285.x. [DOI] [PMC free article] [PubMed] [Google Scholar]
- 18.Spencer T.L., Lehninger A.L. L-lactate transport in Ehrlich ascites-tumour cells. Biochem. J. 1976;154:405–414. doi: 10.1042/bj1540405. [DOI] [PMC free article] [PubMed] [Google Scholar]
- 19.Cheeti S., Warrier B.K., Lee C.H. The role of monocarboxylate transporters in uptake of lactic acid in HeLa cells. Int. J. Pharm. 2006;325:48–54. doi: 10.1016/j.ijpharm.2006.06.018. [DOI] [PubMed] [Google Scholar]
- 20.Hashimoto T., Hussien R., Brooks G.A. Colocalization of MCT1, CD147, and LDH in mitochondrial inner membrane of L6 muscle cells: evidence of a mitochondrial lactate oxidation complex. Am. J. Physiol. Endocrinol. Metab. 2006;290:E1237–E1244. doi: 10.1152/ajpendo.00594.2005. [DOI] [PubMed] [Google Scholar]
- 21.Jijakli H., et al. Insulinotropic action of methyl pyruvate: enzymic and metabolic aspects. Arch. Biochem. Biophys. 1996;335:245–257. doi: 10.1006/abbi.1996.0505. [DOI] [PubMed] [Google Scholar]
- 22.Koukourakis M.I., Giatromanolaki A., Harris A.L., Sivridis E. Comparison of metabolic pathways between cancer cells and stromal cells in colorectal carcinomas: a metabolic survival role for tumor-associated stroma. Cancer Res. 2006;66:632–637. doi: 10.1158/0008-5472.CAN-05-3260. [DOI] [PubMed] [Google Scholar]
- 23.Asada K., et al. Reduced expression of GNA11 and silencing of MCT1 in human breast cancers. Oncology. 2003;64:380–388. doi: 10.1159/000070297. [DOI] [PubMed] [Google Scholar]
- 24.Stubbs M., McSheehy P.M., Griffiths J.R., Bashford C.L. Causes and consequences of tumour acidity and implications for treatment. Mol. Med. Today. 2000;6:15–19. doi: 10.1016/S1357-4310(99)01615-9. [DOI] [PubMed] [Google Scholar]
- 25.Brizel D.M., et al. Elevated tumor lactate concentrations predict for an increased risk of metastases in head-and-neck cancer. Int. J. Radiat. Oncol. Biol. Phys. 2001;51:349–353. doi: 10.1016/s0360-3016(01)01630-3. [DOI] [PubMed] [Google Scholar]
- 26.Walenta S., et al. Correlation of high lactate levels in head and neck tumors with incidence of metastasis. Am. J. Pathol. 1997;150:409–415. [PMC free article] [PubMed] [Google Scholar]
- 27.Walenta S., et al. High lactate levels predict likelihood of metastases, tumor recurrence, and restricted patient survival in human cervical cancers. Cancer Res. 2000;60:916–921. [PubMed] [Google Scholar]
- 28.Tanaka M., et al. Role of lactate in the brain energy metabolism: revealed by Bioradiography. Neurosci. Res. 2004;48:13–20. doi: 10.1016/j.neures.2003.09.001. [DOI] [PubMed] [Google Scholar]
- 29.Lee Y.J., Kang I.J., Bunger R., Kang Y.H. Mechanisms of pyruvate inhibition of oxidant-induced apoptosis in human endothelial cells. Microvasc. Res. 2003;66:91–101. doi: 10.1016/S0026-2862(03)00052-9. [DOI] [PubMed] [Google Scholar]
- 30.Pelicano H., et al. Mitochondrial respiration defects in cancer cells cause activation of Akt survival pathway through a redox-mediated mechanism. J. Cell Biol. 2006;175:913–923. doi: 10.1083/jcb.200512100. [DOI] [PMC free article] [PubMed] [Google Scholar]
- 31.Dimmer K.S., Friedrich B., Lang F., Deitmer J.W., Broer S. The low-affinity monocarboxylate transporter MCT4 is adapted to the export of lactate in highly glycolytic cells. Biochem. J. 2000;350:219–227. doi: 10.1042/0264-6021:3500219. [DOI] [PMC free article] [PubMed] [Google Scholar]
- 32.Ullah M.S., Davies A.J., Halestrap A.P. The plasma membrane lactate transporter MCT4, but not MCT1, is up-regulated by hypoxia through a HIF-1alpha-dependent mechanism. J. Biol. Chem. 2006;281:9030–9037. doi: 10.1074/jbc.M511397200. [DOI] [PubMed] [Google Scholar]
- 33.Wahl M.L., et al. Regulation of intracellular pH in human melanoma: potential therapeutic implications. Mol. Cancer Ther. 2002;1:617–628. [PubMed] [Google Scholar]
- 34.Brown J.M., Wilson W.R. Exploiting tumour hypoxia in cancer treatment. Nat. Rev. Cancer. 2004;4:437–447. doi: 10.1038/nrc1367. [DOI] [PubMed] [Google Scholar]
- 35.Crabtree H.G. Observations on the carbohydrate metabolism of tumours. Biochem. J. 1929;23:536–545. doi: 10.1042/bj0230536. [DOI] [PMC free article] [PubMed] [Google Scholar]
- 36.Pike S.E., Markey S.P., Ijames C., Jones K.D., Tosato G. The role of lactic acid in autocrine B-cell growth stimulation. Proc. Natl. Acad. Sci. U. S. A. 1991;88:11081–11085. doi: 10.1073/pnas.88.24.11081. [DOI] [PMC free article] [PubMed] [Google Scholar]
- 37.Wang Q., Lu Y., Morris M.E. Monocarboxylate transporter (MCT) mediates the transport of gamma-hydroxybutyrate in human kidney HK-2 cells. Pharm. Res. 2007;24:1067–1078. doi: 10.1007/s11095-006-9228-6. [DOI] [PubMed] [Google Scholar]
- 38.Belt J.A., Thomas J.A., Buchsbaum R.N., Racker E. Inhibition of lactate transport and glycolysis in Ehrlich ascites tumor cells by bioflavonoids. Biochemistry. 1979;18:3506–3511. doi: 10.1021/bi00583a011. [DOI] [PubMed] [Google Scholar]
- 39.Coss R.A., Storck C.W., Daskalakis C., Berd D., Wahl M.L. Intracellular acidification abrogates the heat shock response and compromises survival of human melanoma cells. Mol. Cancer Ther. 2003;2:383–388. [PubMed] [Google Scholar]
- 40.Fang J., et al. The H+-linked monocarboxylate transporter (MCT1/SLC16A1): a potential therapeutic target for high-risk neuroblastoma. Mol. Pharmacol. 2006;70:2108–2115. doi: 10.1124/mol.106.026245. [DOI] [PubMed] [Google Scholar]
- 41.Mathupala S.P., Parajuli P., Sloan A.E. Silencing of monocarboxylate transporters via small interfering ribonucleic acid inhibits glycolysis and induces cell death in malignant glioma: an in vitro study. Neurosurgery. 2004;55:1410–1419. doi: 10.1227/01.neu.0000143034.62913.59. [DOI] [PubMed] [Google Scholar]
- 42.Froberg M.K., et al. Expression of monocarboxylate transporter MCT1 in normal and neoplastic human CNS tissues. Neuroreport. 2001;12:761–765. doi: 10.1097/00001756-200103260-00030. [DOI] [PubMed] [Google Scholar]
- 43.Pinheiro C., et al. Increased expression of monocarboxylate transporters 1, 2, and 4 in colorectal carcinomas. Virchows Arch. 2008;452:139–146. doi: 10.1007/s00428-007-0558-5. [DOI] [PubMed] [Google Scholar]
- 44.Taper H.S., Woolley G.W., Teller M.N., Lardis M.P. A new transplantable mouse liver tumor of spontaneous origin. Cancer Res. 1966;26:143–148. [PubMed] [Google Scholar]
- 45.King M.P., Attardi G. Human cells lacking mtDNA: repopulation with exogenous mitochondria by complementation. Science. 1989;246:500–503. doi: 10.1126/science.2814477. [DOI] [PubMed] [Google Scholar]
- 46.Sonveaux P., et al. Irradiation-induced angiogenesis through the up-regulation of the nitric oxide pathway: implications for tumor radiotherapy. Cancer Res. 2003;63:1012–1019. [PubMed] [Google Scholar]
- 47.Del Prete E., Lutz T.A., Scharrer E. Inhibition of glucose oxidation by alpha-cyano-4-hydroxycinnamic acid stimulates feeding in rats. Physiol. Behav. 2004;80:489–498. doi: 10.1016/j.physbeh.2003.10.007. [DOI] [PubMed] [Google Scholar]
- 48.Martinive P., et al. Preconditioning of the tumor vasculature and tumor cells by intermittent hypoxia: implications for anticancer therapies. Cancer Res. 2006;66:11736–11744. doi: 10.1158/0008-5472.CAN-06-2056. [DOI] [PubMed] [Google Scholar]
- 49.Sonveaux P., et al. Modulation of the tumor vasculature functionality by ionizing radiation accounts for tumor radiosensitization and promotes gene delivery. FASEB J. 2002;16:1979–1981. doi: 10.1096/fj.02-0487fje. [DOI] [PubMed] [Google Scholar]
- 50.Bouzin C., Brouet A., De Vriese J., DeWever J., Feron O. Effects of vascular endothelial growth factor on the lymphocyte-endothelium interactions: identification of caveolin-1 and nitric oxide as control points of endothelial cell anergy. J. Immunol. 2007;178:1505–1511. doi: 10.4049/jimmunol.178.3.1505. [DOI] [PubMed] [Google Scholar]
- 51.Feron O., et al. Endothelial nitric oxide synthase targeting to caveolae. Specific interactions with caveolin isoforms in cardiac myocytes and endothelial cells. J. Biol. Chem. 1996;271:22810–22814. doi: 10.1074/jbc.271.37.22810. [DOI] [PubMed] [Google Scholar]
Associated Data
This section collects any data citations, data availability statements, or supplementary materials included in this article.


