

Abstract
Due to their unique ability to cleave immunotoxic gluten peptides endoproteolytically, prolyl endopeptidases (PEPs) are attractive oral therapeutic candidates for protecting celiac sprue patients from the toxic effects of dietary gluten. Enhancing the activity and stability of PEPs under gastric conditions (low pH, high pepsin concentration) is a challenge for protein engineers. Using a combination of sequence- and structure-based approaches together with machine learning algorithms, we have identified improved variants of the Sphingomonas capsulata PEP, a target of clinical relevance. Through two rounds of iterative mutagenesis and analysis, variants with as much as 20% enhanced specific activity at pH 4.5 and 200-fold greater resistance to pepsin were identified. Our results vividly reinforce the concept that conservative changes in proteins, especially in hydrophobic residues within tightly packed regions, can profoundly influence protein structure and function in ways that are difficult to predict entirely from first principles and must therefore be optimized through iterative design and analytical cycles. Incubation with whole wheat bread under simulated gastric conditions also suggests that some variants have pharmacologically significant improvements in gluten detoxification activity.
Keywords: celiac sprue, prolyl endopeptidase
Introduction
Celiac sprue, also referred to as celiac disease, is a life-long disease in which genetically susceptible individuals elicit an immune response to the dietary proteins in wheat, barley and rye (generically termed ‘gluten’). This immune response is characterized by intestinal inflammation and damage, which in turn leads to a variety of clinical problems such as iron deficiency, low energy, steatorrhea, weight loss, bone disorders, infertility and, in rare cases, lymphoma. On an average, celiac sprue affects 0.5–1% of most populations, although the disease is significantly under-diagnosed in many countries including the United States (Kagnoff, 2007). The only therapy is the complete elimination of gluten from the patient's diet, which is difficult and expensive. There is an urgent need for non-dietary therapeutic options for celiac sprue patients.
The predominant amino acid residues in gluten are proline (15%) and glutamine (35%) (Stern et al., 2001), which renders gluten resistant to proteolysis by gastrointestinal endoproteases such as pepsin, trypsin, elastase and chymotrypsin (Hausch et al., 2002; Shan et al., 2002; Piper et al., 2004; Marti et al., 2005). A number of in vitro and in vivo studies have shown that supplementation with proline- or glutamine-specific endoproteases greatly enhances the ability of these endogenous proteases to detoxify dietary gluten (Hausch et al., 2002; Shan et al., 2002; Piper et al., 2004; Marti et al., 2005; Pyle et al., 2005; Siegel et al., 2006). Notably, prolyl endopeptidases (PEPs) are especially effective due to their unique ability to hydrolyze peptide bonds on the carboxyl side of internal proline residues in partially hydrolyzed gluten oligopeptides. One such PEP from Sphingomonas capsulata (SC) is a particularly interesting oral therapeutic candidate due to its stability under acidic conditions (Kabashima et al., 1998; Shan et al., 2004). Similar to many other PEPs from prokaryotes and eukaroytes, SC PEP is an ∼80 kDa serine protease with a smaller N-terminal catalytic domain and a larger β-propeller domain (Shan et al.., 2005). A combination therapy comprised of a fixed-dose ratio of SC PEP and a glutamine-specific cysteine endoprotease (EP-B2) from barley is effective in detoxifying clinically relevant quantities of gluten under gastric conditions (Gass et al., 2007), and has recently initiated controlled clinical trials as an experimental drug for celiac sprue. Notwithstanding its clinical potential, the sub-optimal activity of SC PEP under acidic conditions (pH 4.5), along with its susceptibility to pepsin-catalyzed degradation, presents an opportunity for using protein engineering to enhance the pharmacological properties of this enzyme. In this study we combined sequence- and structure-based approaches together with machine learning algorithms to identify and analyze improved variants of SC PEP.
Materials and methods
Pepsin was obtained from American Laboratories. A ten-fold concentrated buffer of 150 mM sodium acetate (pH 4.5) or a ten-fold concentrated buffer of 100 mM sodium carbonate and 150 mM sodium chloride (pH 6.0) were used for enzyme activity assays. Genes encoding individual SC PEP variants were synthesized using direct synthesis and the use of a synthetic biology tool, Gene Designer (Villalobos et al., 2006). The chromogenic substrate for SC PEP, Suc-Ala-Pro-pNA was purchased from Bachem.
Cloning of SC PEP genes
The SC PEP gene (ATCC 14666) was analyzed for codons rarely used in the desired expression host, namely Escherichia coli (E. coli). The codons in the wild-type SC PEP sequence were modified to those favored by E. coli in order to maximize protein expression (Gustafsson et al., 2004). The corresponding gene is referred to as the ‘optimized codon’ SC PEP gene (OPT). The synthetic genes were cloned into the pET28c expression vector (Novagen).
Expression and purification of PEP proteins
Expression plasmids for OPT or individual mutant SC PEP genes were introduced via transformation into BL21(DE3) cells. Transformants were grown at 30°C to an optical density (600 nm) of 0.6–0.8 and induced in the presence of 100 µM IPTG at 18°C overnight. Low temperature induction was found to improve the yield of active enzyme.
All purification steps were performed at 4°C unless noted otherwise. Cell pellets (60 ml cultures for initial studies, 500 ml cultures for detailed kinetic studies) were obtained after centrifugation at 10 000g for 10 min and resuspended in 2 ml lysis buffer/g cell paste. The lysis buffer consisted of 5 mM imidazole (JT Baker), 1.5 mM benzamidine (Sigma), 2 mg/l pepstatin A (Sigma), and 2 mg/ml leupeptin (Sigma) in 50 mM Tris–HCl + 0.2 M NaCl buffer (pH 8.5). Resuspended cells were sonicated and centrifuged again at 30 000–50 000g for 30 min. The supernatant was treated for at least 2 h with 1 ml of Ni-NTA resin slurry (Qiagen) in a ratio of 1 ml slurry per gram cell paste. The Ni-NTA resin was suspended in a buffer containing 50 mM Tris–HCl (pH 8.5), 0.2 M NaCl and 5 mM imidazole. The slurry was then loaded onto a Kontes column. After thorough wash steps using the same buffer, the PEP was eluted with 200 mM imidazole, 50 mM Tri–HCl, and 0.2 M NaCl, pH 8.5. The eluted protein was exchanged into a 50 mM sodium phosphate + 0.3 M NaCl buffer (pH 8) using an Amicon Ultra-15 ml, 30 000 MW cutoff membrane filter concentrator (Millipore).
Activity assays
Prior to measuring protein activity, the protein concentration was determined by the Bradford Protein Assay using the Pierce Bradford Reagent (Thermo Fisher Scientific) and monitoring the absorbance at 595 nm. A standard calibration curve was generated using bovine serum albumin in concentrations of 2–12 µg/ml. Post-proline cleavage activity was measured using the chromogenic substrate Succinyl-Ala-Pro-p-nitroanilide (Bachem) dissolved in double distilled water.
An initial screen of all purified proteins was conducted as follows. Hydrolysis of Suc-Ala-Pro-pNA by wild-type and mutant SC PEPs was monitored in a 1 ml reaction mixture consisting of 100 µl of ten-fold concentrated acetate or carbonate buffer (discussed earlier), a final concentration of 0.01 µM enzyme, and Suc-Ala-Pro-pNA (3.75 mM stock) at a final concentration of 250 µM. The release of p-nitroaniline was spectrophotometrically detected at a wavelength of 410 nm. The initial velocity of the reaction was determined by an increase in absorbance at 410 nm. All mutant activities measured were compared with the activity of the wild-type enzyme (encoded by the optimized codon gene). Acid stability was assessed in the acetate buffer, whereas pepsin resistance was assessed by adding to a final pepsin concentration of 0.6 mg/ml (which simulates gastric conditions) in the same acetate buffer but at an increased enzyme concentration (0.1 µM).
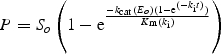
Following the initial screening of two generations of mutants, nine of the most interesting mutants were selected for more detailed kinetic and stability analysis. To estimate kinetic parameters, the substrate concentration was varied between 0.075–0.45 mM Suc-Ala-Pro-pNA, and the enzyme concentration was fixed at 0.02 µM. Initial velocities were plotted against substrate concentration and, using a Michaelis–Menten relationship, kcat/Km values at both pH 6 and pH 4.5 were calculated. The inactivation rate constant (ki) of pepsin was calculated by comparing enzyme activity at pH 4.5 in the presence versus absence of 0.6 mg/ml pepsin, as follows:
integrated to be E(t) = Eoe(−ki t).
Combining the previous equations:
Substituting P for S (P = So− S) and integrating
 |
To assess the pH dependence of enzyme activity, a series of pH buffer solutions between 2.5 and 7 were prepared using varying concentrations of 0.2 M citric acid and 0.4 M dibasic sodium phosphate solutions. Reaction mixtures (1 ml) consisted of 500 µl of two-fold concentrated buffer solution, enzyme concentration of 0.02 µM, and 100 µM Suc-Ala-Pro-pNA in water.
Design of first and second generation mutants
An initial set of mutants of SC PEP was constructed using a combination of sequence and structure-based approaches and available data from the literature. The sequences of 100 PEP homologues were aligned using clustalW (Thompson et al., 1994) (supplementary data are available at PEDS online, Fig. 1). Two classes of scores were calculated for each potential substitution. The first class of scores comprise of diversity and entropy ‘position scores’, which measure the acceptability of change at a specific position. Diversity measures how many different amino acids are present at a position in the alignment and how different they are. V, R and P at a position will score higher than V, I and L. Higher scores mean that an amino acid change at that position is more likely to be well tolerated. Entropy measures how evenly distributed changes are at a position. If 35 proteins have A, one has G and one has T the score will be lower than if 12 have A, 12 have G and 13 have T. An average position score combines the diversity and entropy position scores. The second class of scores is termed ‘substitution scores’ (SeqDist, KaKs, probCons and SUB), which estimates how acceptable a specific change may be. SeqDist measures the distance to the closest homolog that contains this candidate substitution. A higher score means that the change is seen in a closer homolog and is therefore more likely to be acceptable in the target protein. KaKs measures the relative rates at which amino acid sequence and DNA sequence change at a position. Lower scores indicate that the DNA sequence has changed more rapidly than the amino acid sequence, implying that there is likely some evolutionary constraint against structural alterations at this position. ProbCons determines whether a residue not found in the target sequence is conserved within another group of sequences in the alignment. A higher score indicates that a substitution is conserved in some branches of the phylogenetic tree. SUB assesses the intrinsic acceptability of a substitution according to the Dayhoff substitution matrix. A higher score shows a more generally acceptable substitution. For example a Y to F will score higher than a K to C. An average substitution score combines the aforementioned substitution scores. All scores are then normalized between 0 and 1. A final score is calculated as the product of the position and substitution scores.
Fig. 1.

Mutations in first generation SC PEP variants with improved properties. The X-ray structure of SC PEP is as deduced elsewhere (Shan et al., 2005). Active site residues Ser-575 and Asp-658 are represented as orange spheres. All residues altered in first generation variants are represented as gray spheres. (Left) Residues shown in blue spheres were altered in one or more variants with enhanced activity at pH 4.5 relative to wild-type SC PEP. (Right) Residues shown in blue spheres were altered in one or more variants with increased pepsin resistance. The 3D structure of SC PEP was visualized using PYMOL.
Thirty substitutions were selected from these alignment-based scores, and were used to construct 47 variants with the following constraints: (i) 23 variants had three amino acid residues changed from optimized codon, 12 variants had four, and 12 variants had five; (ii) each substitution occurred equal number of times (in this case 6); (iii) each substitution was present in 6 variants and therefore occurred at random with other changes in these variants. The variants were designed to maximize the number of different pairs of substitutions in the given 47 variants (Minshull et al., 2005). It should be noted that the method used to choose amino acid substitutions was independent of the subsequent machine learning analysis (Minshull et al., 2005).
For the second generation of mutants, machine learning-based models provided weights of substitutions towards measured activity, namely increased activity in the presence of pepsin and/or pH 4.5 compared with that of wild-type SC PEP (encoded by the optimized codon gene, OPT). The higher the weight, the more influence the substitution had in increasing the activity. Mutations that did not exhibit improvement of phenotype compared with that of the wild-type in any variant were omitted from the mutations combined to design the second generation of variants. As described previously (Liao et al., 2007), each variant was represented as a bit vector of N dimensions, where N is the number of remaining substitutions after the aforementioned omission. Protein variant tests were described as (xi,yi), where xi symbolizes the variant and yi symbolizes the variant activity. Three different machine learning algorithms were chosen to analyze the data: partial least squares, ridge regression, and support vector machine regression. Each algorithm contributed to a linear model of sequence and activity by construction of a weight vector. Then machine learning algorithms calculated mean and standard deviation values for weights describing the effect of each substitution on protein activity that best correlated measured and algorithm-predicted activities (Liao et al., 2007). Forty eight second generation variants were designed with following constraints: (i) the new variants exhibit no more than three changes from any tested from the first generation; (ii) the new variants are at least two substitutions different from each other; (iii) the new variant has a combination of substitutions that result in the highest predicted activity, calculated using the mean weight minus its standard deviation for each substitution, while conforming to constraints 1 and 2 (Minshull et al., 2005; Liao et al, 2007). A list of mutations in the first and second generation variants is provided in Supplementary Fig. 2 (supplementary data are available at PEDS online). For practical reasons, only 44 of the 48 second generation variants designed were analyzed in this work.
Analysis of structural implications of variants with altered phenotypes
Based on the experimental data of the variants, statistical analysis was performed to determine which of the mutations that occurred in these variants correlated with activity. Once a mutation was deemed statistically significant, the corresponding residue was evaluated in the crystal structure of wild-type SC PEP to gain insight into its possible effects on activity. Statistical significance was calculated by comparing the number of times the mutation occurred in the whole population (44 variants) to the number of times it appeared in those variants with enhanced phenotype. This type of analysis does not take into account possible interaction between mutations. However, since the substitutions chosen for the first generation of variants (and thus carried over into the second generation of mutants) were based upon homologues, the likelihood of a substitution that is incongruent with protein structure and function is small (Aita et al., 2002; Govindarajan et al., 2003).
Gluten detoxification in whole bread
To compare the gluten detoxification abilities of selected mutants relative to wild-type SC PEP, whole-wheat bread digests were analyzed by a competitive ELISA procedure described earlier (Morón et al., 2008a). Briefly, whole-wheat bread (600 mg) soaked in specified amounts of EP-B2 and/or PEP (25 mg each/g gluten) was added to a solution of 0.01 N HCl containing 0.6 mg/ml pepsin at 37°C. The simulated gastric digests were incubated for 10 or 60 min at 37°C, quenched by boiling for 5 min, and stored at −20°C until further analysis.
The residual toxicity in each sample was measured as the concentration of the QPQLPY epitope by competitive ELISA using horseradish peroxidase (HRP)-conjugated G12 monoclonal antibody (Morón et al., 2008b). This epitope, which occurs three times in a highly toxic 33-mer gluten peptide (Shan et al., 2002), is an appropriate surrogate for gluten immunotoxicity. A standard curve was derived using the synthetic 33-mer peptide. The concentration of QPQLPY in each digest was calculated with reference to this standard curve. Values shown represent the mean of 3 different dilutions, each performed in duplicate. The limit of detection and limit of quantification of the competitive ELISA for the detection of 33-mer peptide developed here is 0.085 and 5.41 ng/ml, respectively.
Results and discussion
Design and analysis of first generation variants
Together with the X-ray structure of SC PEP and available literature data on SC PEP mutants, a multiple sequence alignment analysis of 100 homologues of SC PEP (supplementary data are available at PEDS online, Fig. 1) yielded a list of 30 potentially advantageous mutations. Forty-seven variants were constructed (supplementary data are available at PEDS online, Fig. 2) and assayed for activity at pH 6.0, pH 4.5, and pH 4.5 in the presence of 0.6 mg/ml pepsin. Assays were performed as described in the Materials and methods section. The activity of each variant was compared with that of the wild-type SC PEP encoded by the optimized codon gene (Table I). Under the conditions assayed, pepsin rapidly inactivated the PEP. (Inactivation is significantly slower under simulated gastric conditions due to the presence of relatively high amounts of protein in a typical test meal, which acts as a competitive substrate.) In many variants, no enzyme activity was observed in the presence of pepsin. The wild-type protein retained detectable activity for <2 min of the 12 min reaction time. The locations of the mutations present in variants with improved activity at pH 4.5 or enhanced pepsin stability are shown in Fig. 1 right and left, respectively.
Fig. 2.

Mutations in second generation SC PEP variants with the greatest enhancement in pepsin resistance. The PYMOL image illustrates the location of the mutations M511L, I406V, K103T, I514V and V474I, colored in pink, brown, green, blue, and black, respectively. The active site residues are represented as orange sticks.
Table I.
First generation variant activity and stability
| Variant no. | % of pH 6.0 activity relative to OPT | % of pH 4.5 activity relative to OPT | Time enzyme remains active in presence of pepsin and pH 4.5 buffer |
|---|---|---|---|
| 6609 | 0 | 0 | − |
| 6610 | 0 | 0 | − |
| 6611 | 49 | 98 | − |
| 6613 | 66 | 67 | − |
| 6614 | 97 | 79 | − |
| 6615 | 48 | 59 | − |
| 6617 | 30 | 70 | − |
| 6618 | 161 | 184 | − |
| 6619 | 156 | 158 | − |
| 6620 | 90 | 89 | − |
| 6621 | 61 | 64 | − |
| 6622 | 103 | 89 | − |
| 6623 | 125 | 119 | − |
| 6626 | 105 | 119 | − |
| 6627 | 93 | 81 | − |
| 6628 | 131 | 143 | − |
| 6629 | 85 | 106 | − |
| 6630 | 47 | 62 | − |
| 6631 | 155 | 150 | + |
| 6633 | 51 | 39 | + |
| 6634 | 77 | 60 | − |
| 6635 | 62 | 60 | − |
| 6636 | 99 | 93 | − |
| 6637 | 32 | 77 | − |
| 6638 | 76 | 153 | − |
| 6639 | 88 | 56 | − |
| 6641 | 69 | 89 | − |
| 6643 | 61 | 80 | ? |
| 6644 | 108 | 102 | − |
| 6645 | 8 | 10 | − |
| 6646 | 101 | 95 | + |
| 6647 | 122 | 114 | − |
| 6648 | 40 | 60 | − |
| 6649 | 101 | 87 | − |
| 6650 | 34 | 60 | − |
| 6651 | 67 | 68 | − |
| 6652 | 94 | 122 | − |
| 6653 | 87 | 98 | + |
| 6654 | 80 | 53 | + |
| 6655 | 48 | 95 | − |
| 6656 | 122 | 128 | + |
Assays were performed under the three conditions of pH 6.0, pH 4.5 and pepsin + pH 4.5. ×10 enzyme was used in the pepsin assay compared with the pH 6.0 and pH 4.5 assays. pH 6.0 and pH 4.5 data are given as relative percentages of wild-type SC PEP activity at the same condition (variant activity/wild-type activity × 100). For the pepsin assay, results are reported as the duration for which the enzyme retains activity. (−) represents an enzyme remaining active for<2 min, (+) represents an enzyme retaining activity for 2–5 min, (++) represents an enzyme retaining activity for 5–9 min, and (+++) represents an enzyme retaining activity for >9 min. For reference, wild-type SC PEP remained active for <1 min (41 of the 47 first generation variant activity values are listed in this table due to prior analysis by a different method for the remaining six). (?) implies not determined.
Design and analysis of second generation variants
Eight of 30 substitutions present in the first generation variants were eliminated from the substitution pool due to their absence in any variant with increased phenotypic characteristics: R100K, F227Y, V346I, R354K, R481K, V500I, Y669F, and I687V. The remaining substitutions were regrouped in different combinations to generate a panel of second generation variants. Each of the 22 remaining substitutions were assigned a different weight based upon the activity data, where a higher weight implied greater influence of that mutation on the observed increase in activity. Substitutions with the highest weights included I581V, F459Y, I371V, S351P, V323I, and M511L. The new variants were selected according to the criteria described in the Materials and methods section.
The activity of each second generation variant was also tested at pH 6, pH 4.5, and pH 4.5 in the presence of pepsin. The data is reported in Table II. The mutations that showed the most significant correlation to improved activity and/or stability under simulated gastric conditions (pH 4.5, pepsin) were M511L, I406V, K103T, I514V, and V474I (Fig. 2).
Table II.
Second generation variant activity and stability
| Variant no. | % of pH 4.5 activity relative to OPT | % of pH 6.0 activity relative to OPT | Time enzyme remains active in presence of pepsin and pH 4.5 buffer |
|---|---|---|---|
| 10184 | 104 | 113 | − |
| 10185 | 82 | 111 | ++ |
| 10186 | 133 | 141 | − |
| 10187 | 115 | 113 | + |
| 10188 | 130 | 115 | − |
| 10189 | 113 | 135 | ++ |
| 10191 | 75 | 118 | + |
| 10192 | 80 | 101 | − |
| 10193 | 104 | 91 | − |
| 10194 | 139 | 162 | + |
| 10196 | 97 | 128 | ++ |
| 10197 | 120 | 122 | − |
| 10198 | 113 | 150 | − |
| 10200 | 109 | 117 | − |
| 10202 | 155 | 138 | − |
| 10203 | 118 | 159 | ++ |
| 10204 | 93 | 122 | ++ |
| 10205 | 70 | 113 | +++ |
| 10206 | 78 | 113 | ++ |
| 10207 | 148 | 96 | − |
| 10208 | 214 | 150 | − |
| 10209 | 77 | 74 | + |
| 10210 | 73 | 99 | + |
| 10211 | 150 | 179 | + |
| 10212 | 152 | 131 | − |
| 10213 | 196 | 181 | − |
| 10214 | 117 | 112 | + |
| 10215 | 154 | 121 | − |
| 10216 | 198 | 127 | − |
| 10217 | 127 | 102 | − |
| 10218 | 73 | 79 | − |
| 10219 | 74 | 96 | +++ |
| 10220 | 124 | 115 | + |
| 10221 | 126 | 131 | + |
| 10222 | 49 | 69 | + |
| 10223 | 88 | 82 | − |
| 10224 | 214 | 191 | + |
| 10225 | 107 | 110 | − |
| 10226 | 169 | 109 | + |
| 10227 | 154 | 102 | − |
| 10228 | 129 | 117 | − |
| 10229 | 106 | 97 | + |
| 10230 | 177 | 186 | + |
| 10231 | 200 | 190 | + |
The data are reported as described in the caption of Table I.
We sought to understand the basis for the marked enhancement in pepsin resistance observed in some of the second generation mutants. Putative pepsin cleavage sites on SC PEP were inferred based on available knowledge of the substrate specificity of pepsin and an examination of the PEP crystal structure for potential cleavage sites on the surface of the protein. Pepsin has the highest preference for Phe and Leu in the P1 position, followed by Met, but also tolerates Tyr, Trp, Cys, and Glu in the P1 position. The P1’ position does not have as strong an influence on pepsin specificity as the P1 position, although aromatic residues (Tyr, Phe, and Trp) and, to a lesser extent, Ile and Val are preferred. Conversely, the presence of His, Lys, Arg, and Pro in the P1 position strongly disfavors pepsin activity. Pepsin also discriminates against Pro residues in the P2 position and, to a lesser extent, in the P2’ and P3’ positions. In addition, Arg, Lys, or His residues are disfavored in the P3 position (Powers et al., 1977; Hamuro et al., 2008).
Surprisingly, none of the mutations that correlate with enhanced stability (M511L, I406V, K103T, I514V, and V474I) fit the canonical pepsin specificity patterns summarized earlier. For example, M511 lies in the interior of the protein. We therefore speculate that the M511L mutation (Fig. 3A) enhances resistance against pepsin as a result of more favorable hydrophobic packing, which protects the surface-borne residue F459 (brown) from recognition by pepsin. Similarly, the I406V mutation is located in a tightly packed region on a strand connecting two β sheets in the propeller domain. The loss of a methylene group may weaken its hydrophobic interaction with F477 and V461 (Fig. 3B). This in turn may perturb the orientation of surface residue F425, thereby shielding that residue from pepsin. I514 is also buried within the catalytic domain. The I514V mutation may therefore alter local hydrophobic interactions (with F520 and V479) due to the loss of a methylene group. In turn, one or more pepsin cleavage sites, possibly F459, F510 or W513 may be shielded from pepsin (Fig. 3C). Last but not least, K103 resides on the outer surface of the catalytic domain of the protein, close to the connection of the catalytic and propeller domains. Mutating lysine to a threonine is predicted to result in the loss of a salt bridge with neighboring E99 (Fig. 3D), which perhaps reduces the specificity of pepsin for Y108 through altered local conformation.
Fig. 3.

Computer models for the structural consequences of mutations that enhance pepsin resistance. (A) M511L, (B) I406V, (C) K103T, (D) I514V. Residues within 5 Å of the center of mutated residue are represented in gray. In each panel, the wild-type residue is colored in blue, whereas the residue to which it is altered is superimposed in red. Residues that are predicted to be most directly affected as a result of the mutation are shown in green. Residues shown in brown are sites where pepsin resistance is predicted to be manifested. For details, see text.
We also sought to interpret the possible roles of mutations that correlate with increased activity of SC PEP under acidic conditions, including V474I, V344I, I381L and I284L (Fig. 4). V474 is located in the catalytic domain near the junction between the two domains (Fig. 5A). We speculate that the V474I mutation alters the pKa of the neighboring titratable residue D500. In turn, this may make the active site more accessible under acidic conditions, thereby increasing the rate of substrate cleavage. Notably, this residue is within 5 Å of three putative pepsin cleavage sites on the surface of SC PEP (Y466, W535 and F465), and could therefore also contribute to pepsin resistance.
Fig. 4.

Mutations in second generation SC PEP variants with improved activity under acidic conditions. The PYMOL image illustrates of the location of the mutations V474I, V344I, I381L and I284L, colored in pink, brown, green and blue, respectively. The active site residues are represented as orange sticks.
Fig. 5.

Computer models for the structural consequences of mutations that improve the activity of SC PEP relative to the wild-type enzyme under acidic conditions. (A) V474I, (B) V344I, (C) I381L, (D) I284L. Residues within 5 Å of the center of mutated residue are represented in gray. In each panel, the wild-type residue is colored in blue, whereas the residue to which it is altered is superimposed in red. (A) Asp-500 is shown in green, whereas Tyr-466, Trp-535 and Phe-465 are shown in brown. (B) Thr-357 and Trp-342 are in green, whereas Lys-320 and Ser-334 are in brown. (C) Glu-530 and Thr-503 are in brown, whereas Glu-367 and Asn-365 are in green. (D) Val-245 and Ala-273 are in green. For details, see text.
V344 is a buried residue in the propeller domain, located in an area away from the inter-domain region and towards a flexible hydrophilic loop comprised of residues 230-240 (Fig. 5B) (Shan et al., 2005). The addition of a methylene group in Ile could cause this residue to pack more tightly against a hydrophobic patch comprised of T357 and W342, and orient away from a hydrophilic patch comprised of S334 and K320. How such a structural perturbation of the propeller domain may affect enzyme activity under acidic conditions is beyond the scope of the current analysis; however, it has been proposed that propeller domain dynamics contribute importantly to substrate accessibility within this family of PEPs (Fuxreiter et al., 2005). I381 is also located on a β strand in the propeller domain, but is within 5 A of two catalytic domain residues T503 and E530 as well as two propeller domain residues E357 and N365 (Fig. 5C). The I381L mutation could subtly alter the pKa of E530 and/or E357 thereby enhancing active site accessibility under acidic conditions. Similarly, I284 is also located in the propeller domain (Fig. 5D). Its mutation to Leu most likely alters its interactions with two neighboring hydrophobic residues V245 and A273. Absent further data, we are unable to speculate how such a change is transduced to the active site.
In summary, all four mutations that may enhance the activity of SC PEP under acidic conditions are located in the propeller domain, highlighting the importance of this domain to the catalytic activity of this peptidase.
Kinetic analysis of selected second generation mutants
Nine improved variants from the second generation of mutants were selected for more detailed kinetic analysis, along with wild-type SC PEP. At both pH 4.5 and pH 6.0, kcat/Km values were determined for each enzyme. In addition, the inactivation kinetics of each protein by pepsin was monitored, and the data was used to calculate a first-order inactivation rate constant (ki). The results are shown in Table III.
Table III.
Kinetic parameters of wild-type and selected SC PEP variants
| Variant no. | kcat/Km [=] (mM) s−1, pH 6.0 | R2 | kcat/Km [=] (mM) s−1, pH 4.5 | R2 | ki (min−1), 0.6 mg/ml pepsin | ki (min−1), 0.3 mg/ml pepsin |
|---|---|---|---|---|---|---|
| OPT | 24.5 | 0.99 | 6.4 | 0.97 | >10 | >10 |
| 10186 | 22.2 | 0.99 | 5.9 | 0.99 | 0.55 | 0.43 |
| 10187 | 22.7 | 0.97 | 7.9 | 0.95 | 0.92 | 0.61 |
| 10189 | 24.0 | 0.92 | 5.5 | 0.99 | 0.05 | 0.04 |
| 10194 | 20.9 | 0.92 | 5.2 | 0.95 | 0.39 | 0.21 |
| 10196 | 19.8 | 0.98 | 4.7 | 0.93 | 0.08 | 0.04 |
| 10205 | 23.2 | 0.97 | 4.3 | 0.87 | 0.05 | 0.02 |
| 10219 | 17.6 | 0.96 | 5.5 | 0.93 | 0.08 | 0.08 |
| 10224 | 27.6 | 0.99 | 7.0 | 0.93 | 0.24 | 0.12 |
| 10230 | 19.1 | 1.00 | 6.2 | 0.98 | 0.63 | 0.39 |
kcat/Km values were determined for each enzyme at pH 4.5 and pH 6.0. The first-order inactivation constant was measured at two different pepsin concentrations by comparing protein activity at pH 4.5 in the presence of a given pepsin concentration to the protein activity in the absence of pepsin. R2 values are listed for the fit of the V versus [S] curve used to calculate the kcat/Km values.
Variants 10187 and 10224 were targeted for detailed kinetic analysis because of their enhanced activity under acidic conditions. The common mutations present in both variants are I581V, F459Y, and I371V. The additional mutation V323I in variant 10187 resulted in better activity under acidic conditions than the combined effect of mutations I284L, P353S, and V474I in 10224. Interestingly, although both variants exhibited enhanced activity at pH 4.5, they showed the smallest improvement in pepsin stability within the subset of second generation variants studied in detail. This suggests that alterations in domain-domain dynamics that enhance enzyme activity under acidic conditions may also increase pepsin susceptibility under the same conditions. A similar theme also emerges from comparative examination of the structure-function relationships in other variants. For example, a comparison of variant 10186 (mutations I581V and V323I) and 10187 (variant 10186 + F459Y + I371V) shows that the latter variant has increased enzymatic activity under acidic conditions but also decreased pepsin resistance. In contrast, the addition of mutations K103T and K305S in variant 10194 (= variant 10187 + K103T + K305S) results in reduced activity of this protein at pH 4.5 relative to variant 10187, but slightly enhanced pepsin resistance. Last but not least, variants 10186 and 10196 (= variant 10186 + F459Y + M511L + I406V) are yet another vivid example of this reciprocal relationship between activity under acidic conditions and resistance towards pepsin-catalyzed inactivation. It is thought that inter-domain dynamics are a rate-limiting step in the PEP catalytic cycle (Polgar, 2002; Shan et al., 2005), and that the low-pH form of SC PEP is more unfolded (Polgar, 2002). Perhaps the substitutions that enhance pepsin resistance lead to a more tightly folded but also a less dynamic protein structure.
Gluten detoxification by selected PEP variants
To assess the pharmacological consequences of enhancing PEP activity and stability under acidic conditions, the gluten detoxification activity of two improved variants, 10224 and 10230, was tested in assays simulating gastric digestion of whole wheat bread. As a frame of reference, a 1:1 mass ratio of cysteine endoprotease EP-B2 and wild-type SC PEP was used (Gass et al., 2007). The results are shown in Fig. 6. Over a period of 60 min under simulated gastric conditions, ca. 20-fold gluten detoxification is achieved using EP-B2 alone. Consistent with earlier findings (Siegel et al., 2006; Gass et al., 2007), the effect of EP-B2 alone saturates rapidly, and is unable to fully detoxify gluten. For this reason, a second enzyme with complementary substrate specificity such as SC PEP is co-administered. Under the assay conditions reported here, whereas an additional 2-fold detoxification is achieved when wild-type SC PEP is added to EP-B2, further improvements are observed when either variant 10224 or 10230 is used in lieu of the wild-type enzyme. Similar trends are also observed at shorter time-points (10 min).
Fig. 6.

Concentration of QPQLPY in whole-wheat bread digested under simulated gastric conditions. The samples were digested for 10 or 60 min, using 0.6 mg/ml pepsin, 25 mg/g gluten recombinant proEP-B2, and 25 mg/g gluten PEP [recombinant SC PEP (WT), or variants 10224 and 10230]. The concentration of QPQLPY in digests was determined by competitive ELISA using the G12 monoclonal antibody. Three independent dilutions were tested for each digest, each with two repetitions. The residual epitope concentration apparently increases with time in the presence of pepsin alone (and, to a lesser extent, with pepsin + EP-B2) due to the inability to recognize the epitope in long gluten (poly)peptides that are virtually insoluble; such peptides are thoroughly digested upon addition of the two-enzyme cocktail (Gass et al., 2007).
Conclusions
Through a combination of sequence- and structure-based approaches, recursive mutagenesis, and machine learning algorithms, we have been able to significantly improve the activity of SC PEP under simulated gastric conditions. The significance of our findings is underscored by the clinical relevance of this enzyme for celiac sprue therapy. A more stable enzyme under simulated gastric conditions will likely lead to better detoxification of gluten and a more efficacious oral therapy option. More fundamentally, our results strongly reinforce the concept that conservative changes to hydrophobic groups in proteins can profoundly influence protein structure and function (Cordes et al., 1996) in ways that are difficult to predict entirely from first principles and must therefore be optimized through iterative design and analytical cycles. In addition, this technique of using homology and/or structure information as well as machine learning algorithms offers an efficient technique to generate proteins of improved phenotype by reducing the number of variants that need to be tested to <100 (Liao et al., 2007). This reduction in number of variants allows a more representative screen to be used to probe the desired variant function when compared with more error-prone high throughput screening method (Minshull et al., 2005).
Funding
The research performed at Stanford University was supported by a grant from the National Institutes of Health (DK 063158 to C.K.), by a National Science Foundation Predoctoral Fellowship (to J.E.), and by a postdoctoral fellowship from ‘Fundación Caja Madrid’ (to B.M.).
Conflict of interest: C.K. is a shareholder and Director of Alvine Pharmaceuticals, a company that is sponsoring clinical trials of SC PEP under license from Stanford University. These trials are not being performed at Stanford or affiliated institutions.
Supplementary Material
Footnotes
Edited by Andreas Matouschek
References
- Aita T., Hamamatsu N., Nomiya Y., Uchiyama H., Shibanaka Y., Husimi Y. Biopolymers. 2002;64:95–105. doi: 10.1002/bip.10126. [DOI] [PubMed] [Google Scholar]
- Cordes M.H., Davidson A.R., Sauer R.T. Curr. Opin. Struct. Biol. 1996;6:3–10. doi: 10.1016/s0959-440x(96)80088-1. [DOI] [PubMed] [Google Scholar]
- Fuxreiter M., Magyar C., Juhasz T., Szeltner Z., Polgar L., Simon I. Proteins. 2005;60:504–512. doi: 10.1002/prot.20508. [DOI] [PubMed] [Google Scholar]
- Gass J., Bethune M.T., Siegel M., Spencer A., Khosla C. Gastroenterology. 2007;133:472–480. doi: 10.1053/j.gastro.2007.05.028. [DOI] [PubMed] [Google Scholar]
- Govindarajan S., Ness J.E., Kim S., Mundorff E.C., Minshull J., Gustafsson C. J. Mol. Biol. 2003;328:1061–1069. doi: 10.1016/s0022-2836(03)00357-7. [DOI] [PubMed] [Google Scholar]
- Gustafsson C., Govindarajan S., Minshull J. Trends Biotechnol. 2004;22:346–353. doi: 10.1016/j.tibtech.2004.04.006. [DOI] [PubMed] [Google Scholar]
- Hamuro Y., Coales S.J., Molnar K.S., Tuske S.J., Morrow J.A. Rapid. Commun. Mass Spectrom. 2008;22:1041–1046. doi: 10.1002/rcm.3467. [DOI] [PubMed] [Google Scholar]
- Hausch F., Shan L., Santiago N.A., Gray G.M., Khosla C. Am. J. Physiol. Gastrointest. Liver Physiol. 2002;283:G996–G1003. doi: 10.1152/ajpgi.00136.2002. [DOI] [PubMed] [Google Scholar]
- Kabashima T., Fujii M., Meng Y., Ito K., Yoshimoto T. Arch. Biochem. Biophys. 1998;358:141–148. doi: 10.1006/abbi.1998.0836. [DOI] [PubMed] [Google Scholar]
- Kagnoff M.F. J. Clin. Invest. 2007;117:41–49. doi: 10.1172/JCI30253. [DOI] [PMC free article] [PubMed] [Google Scholar]
- Liao J., Warmuth M.K., Govindarajan S., Ness J.E., Wang R.P., Gustafsson C., Minshull J. BMC Biotechnol. 2007;7:16. doi: 10.1186/1472-6750-7-16. [DOI] [PMC free article] [PubMed] [Google Scholar]
- Marti T., Molberg O., Li Q., Gray G.M., Khosla C., Sollid L.M. J. Pharmacol. Exp. Ther. 2005;312:19–26. doi: 10.1124/jpet.104.073312. [DOI] [PubMed] [Google Scholar]
- Minshull J., Ness J.E., Gustafsson C., Govindarajan S. Curr. Opin. Chem. Biol. 2005;9:202–209. doi: 10.1016/j.cbpa.2005.02.003. [DOI] [PubMed] [Google Scholar]
- Morón B., Bethune M.T., Comino I., Manyani H., Ferragud M., López M.C., Cebolla Á., Khosla C., Sousa C. PLoS ONE. 2008;a 3:e2294. doi: 10.1371/journal.pone.0002294. [DOI] [PMC free article] [PubMed] [Google Scholar]
- Morón B., Cebolla Á., Manyani H., Álvarez-Maqueda M., Megías M., Thomas M.C., López M.C., Sousa C. Am. J. Clin. Nutr. 2008;b 87:405–414. doi: 10.1093/ajcn/87.2.405. [DOI] [PubMed] [Google Scholar]
- Piper J.L., Gray G.M., Khosla C. J. Pharmacol. Exp. Ther. 2004;311:213–219. doi: 10.1124/jpet.104.068429. [DOI] [PubMed] [Google Scholar]
- Polgar L. Cell Mol. Life Sci. 2002;59:349–362. doi: 10.1007/s00018-002-8427-5. [DOI] [PMC free article] [PubMed] [Google Scholar]
- Powers J.C., Harley A.D., Myers D.V. Adv. Exp. Med. Biol. 1977;95:141–157. doi: 10.1007/978-1-4757-0719-9_9. [DOI] [PubMed] [Google Scholar]
- Pyle G.G., Paaso B., Anderson B.E., Allen D.D., Marti T., Li Q., Siegel M., Khosla C., Gray G.M. Clin. Gastroenterol. Hepatol. 2005;3:687–694. doi: 10.1016/s1542-3565(05)00366-6. [DOI] [PubMed] [Google Scholar]
- Shan L., Molberg O., Parrot I., Hausch F., Filiz F., Gray G.M., Sollid L.M., Khosla C. Science. 2002;297:2275–2279. doi: 10.1126/science.1074129. [DOI] [PubMed] [Google Scholar]
- Shan L., Marti T., Sollid L.M., Gray G.M., Khosla C. Biochem J. 2004;383:311–318. doi: 10.1042/BJ20040907. [DOI] [PMC free article] [PubMed] [Google Scholar]
- Shan L., Mathews, Khosla C. Proc. Natl Acad. Sci. USA. 2005;102:3599–3604. doi: 10.1073/pnas.0408286102. [DOI] [PMC free article] [PubMed] [Google Scholar]
- Siegel M., Bethune M.T., Gass J., Ehren J., Xia J., Johannsen A., Stuge T.B., Gray G.M., Lee P.P., Khosla C. Chem. Biol. 2006;13:649–658. doi: 10.1016/j.chembiol.2006.04.009. [DOI] [PubMed] [Google Scholar]
- Stern M., Ciclitira P.J., van Eckert R., Feighery C., Janssen F.W., Mendez E., Mothes T., Troncone R., Wieser H. Eur. J. Gastroenterol. Hepatol. 2001;13:741–747. doi: 10.1097/00042737-200106000-00023. [DOI] [PubMed] [Google Scholar]
- Thompson J.D., Higgins D.G., Gibson T.J. Nucleic Acids Res. 1994;22:4673–4680. doi: 10.1093/nar/22.22.4673. [DOI] [PMC free article] [PubMed] [Google Scholar]
- Villalobos A., Ness J.E., Gustafsson C., Minshull J., Govindarajan S. BMC Bioinformatics. 2006;7:285. doi: 10.1186/1471-2105-7-285. [DOI] [PMC free article] [PubMed] [Google Scholar]
Associated Data
This section collects any data citations, data availability statements, or supplementary materials included in this article.