Abstract
Quantitative real-time PCR remains a cornerstone technique in gene expression analysis and sequence characterization. Despite the importance of the approach to experimental biology the confident assignment of reaction efficiency to the early cycles of real-time PCR reactions remains problematic. Considerable noise may be generated where few cycles in the amplification are available to estimate peak efficiency. An alternate approach that uses data from beyond the log-linear amplification phase is explored with the aim of reducing noise and adding confidence to efficiency estimates. PCR reaction efficiency is regressed to estimate the per-cycle profile of an asymptotically departed peak efficiency, even when this is not closely approximated in the measurable cycles. The process can be repeated over replicates to develop a robust estimate of peak reaction efficiency. This leads to an estimate of the maximum reaction efficiency that may be considered primer-design specific. Using a series of biological scenarios we demonstrate that this approach can provide an accurate estimate of initial template concentration.
Keywords: PCR, quantification, efficiency, NLM, transcription
Introduction
The quantitative real-time Polymerase Chain Reaction [1] is perhaps the most well established technique used for high resolution DNA, and indirectly, RNA, quantification. While alternative and massively parallel assays are increasingly available, PCR has remained the technology of choice for validating high-throughput data [2]. PCR sensitivity ranges from only a few amplicons through fully 6 orders of magnitude typically with a replicate covariance of less than 2% [3], making developments to PCR quantification of considerable significance for biological research.
Comprehensive reviews of the protocols, primer selection criteria and biophysical constraints necessary in designing a real-time PCR experiment are available (www.gene-quantification.de) [4; 5; 6; 7]. Once design choices have been made and measurements of a multi-cycle PCR amplification process acquired, initial template quantification is required. The fractional number of cycles (C) required to generate a fluorescent signal exceeding an arbitrary threshold (t) is generally assessed. From this value a cycle-zero fluorescence that is proportionate to the concentration of the initial DNA template sequence is inferred. Each additional cycle required to achieve Ct approximately halves the initial fluorescence estimate relative to the threshold t. Consequently, a change in value of Ct between any two amplification processes suggests the relative difference in initial templates from a baseline to an experimental condition. In an ideal reaction the value 2C 1/2C 2, i.e. 2(C 1 −C 2), yields the ratio difference in initial templates arising from the shift in Ct between cycles C1 and C2.
However PCR rarely proceeds as such an ideal reaction. Even small differences in the amplification efficiencies of reactions will lead to detectable differences in Ct whether or not the concentrations of the starting templates differ. Approaches are available to adjust for some of the template-linked quality factors that may inhibit the progress of a reaction [8; 9]. Ct values can be compared between both experimental states and controls such as ‘house-keeping’ genes or spike-in transcripts. Changes in control Ct values are combined with those between conditions (2ΔΔC t) to describe differences in sample quality. The appropriateness of endogenous reference standards such as 18S rRNA, GAPDH and VEGF have come into question [10; 11; 12]. In addition, the readily visible portion of the reaction curve can be a poor indicator of where an appropriate (efficiency) matched control has been selected. Dilution strategies have been the most successfully explored to establish control and target gene efficiencies although these may require multiple replicate dilutions in order to establish efficiency with confidence [13].
Explicit corrections for differences between reaction kinetics have proven a difficult and sometimes unreliable alternative. Modifying exponential terms risks introducing substantial adjustment error [14]. However, if achieved, these approaches could describe reaction efficiency differences and reduce the impact of other confounding factors such as competition between parallel in-tube reactions and crosstalk between flours. Hence the development of efficiency corrected PCR approaches without the strict requirement for matched efficiency controls [15] continues to be desirable.
Several means to computationally correct for reaction efficiency have been described. Linearization of the exponential reaction through a log transformation allows fluorescence to be regressed back to its zeroth cycle and continues to be the approach most widely adopted [9; 16; 17]. Reaction efficiencies below 100% yield shallower gradients in the log-transformed signal thereby generating proportionately larger starting template estimates. While useful, these approaches are limited by real-world considerations. Ideally, the log-linear phase of the amplification would be free of background noise, but it rarely is. At a very low signal, background effects such as CCD thermal noise and shot noise, lead to reduced reliability in the points from which the linear regression tangent is calculated. The log-linear phase may be significantly departed, only a few cycles beyond these high noise measurements, even as the signal to noise ratio improves. This can result in an estimate of the concentration of the initial template that is highly sensitive to the selection or exclusion of signal points. To offset this limitation an extended set of points can be included using more advanced ground-phase and sigmoid models [18] to approximate the development of the entire reaction and thereby indirectly estimate the relative exponential efficiencies between amplifications. These and other models have recently been reviewed [19].
Confounding many analytical assumptions, serial PCR reactions may only approximate and never truly sustain exponential progression [20]. The progress of a multi-cycle PCR amplification reaction is impeded by, (A), conditions that limit its maximum efficiency and (B) by processes that reduce the reaction efficiency on a per-cycle basis. Examples of type-A factors may include reagent quality, primer design, the impediment to amplification generated by secondary structure even at weak primer hairpins as well as other unique sub-features residing between the primers within the template. Examples of type-B constraints likely include the decreasing availability of reagents such as dNTPs for de-novo synthesis, and the ongoing degradation of the polymerase as the reactions progress. During the early cycles this steady reduction in efficiency from its maximum may be small. However, as the reaction proceeds and fluorescence becomes detectable, the effect of the continued reduction in efficiency and hence an imperfect log-linear progression generally becomes evident. Accordingly to reduce noise and increase the confidence when estimating efficiency an alternative approach that uses data from beyond the log-linear amplification phase was developed. PCR reaction efficiency is regressed to estimate the per-cycle profile of asymptotically departed peak efficiency, even when this is not closely approximated in the measurable cycles. This leads to an estimate of the maximum reaction efficiency that may be considered primer-design specific. The utility of this strategy is demonstrated in a series of scenarios described in this communication.
Methods
KLAB-PCR (Krawetz LABoratory-PCR http://klab.med.wayne.edu/KLABPCR.zip) is a tool that implements two algorithms to quantify the starting template in a PCR reaction. The first is a modified Ct strategy that assumes an ideal efficiency and is calculated for reference. The second employs a parametric fitting approach to construct a non-linear approximation to the reaction efficiency that is regressed backwards to establish a peak efficiency. The implementation can use data from a single PCR reaction, or from several reactions where the same primers are used yielding a consensus of peak efficiency. We have tested these two approaches using standard dilution studies [21] to estimate the extent to which the efficiency was accurately determined and have adapted this approach as part of our routine PCR analysis. The results suggest that this non-linear model may represent a promising alternative to Ct that obviates the need for internal controls.
Ct Model
KLAB-PCR implements a refined Ct approach. The ideal reaction efficiency is assumed for all reactions. For each series, the subset of cycles over which an exponential development is most closely approximated over three cycles is identified. Evidence of product (Tn) at the central cycle is then taken as the cycle from which to assume Tn = T02 n and hence T0 = Tn/2 n While essentially the Ct approach, the threshold is independently calculated through the closest approximation to a low-noise exponential phase for each reaction, hence both cycle C and threshold t can vary.
Non-Linear Model
Extending work on exponential sigmoid approaches to reaction efficiency [20] we sought to explore alternate general biological models for the progressive deterioration of an exponential amplification. The model assumes that the amplification reaction has an inherent maximum efficiency that decreases at each cycle as reagents age and as competition for a reducing supply of resources increases for each amplicon. This generates the basic recursion relationship (Equation 1) for the amplification reaction. The multiple effects that serially reduce efficiency from a maximum (Emax) are represented by the compound function G. This function describes the aggregate impact of (k) confounding elements (Equation 2) that will ultimately fully quench the reaction. Each of the k components of G at amplification cyclei+1 is assumed to be generated by an independent function of Ti, the total template at the ith cycle of amplification.
| (Eq. 1) |
| (Eq. 2) |
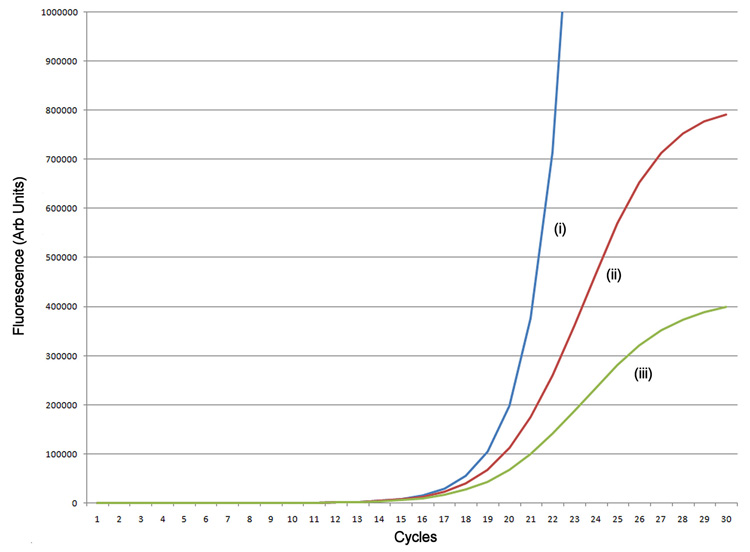
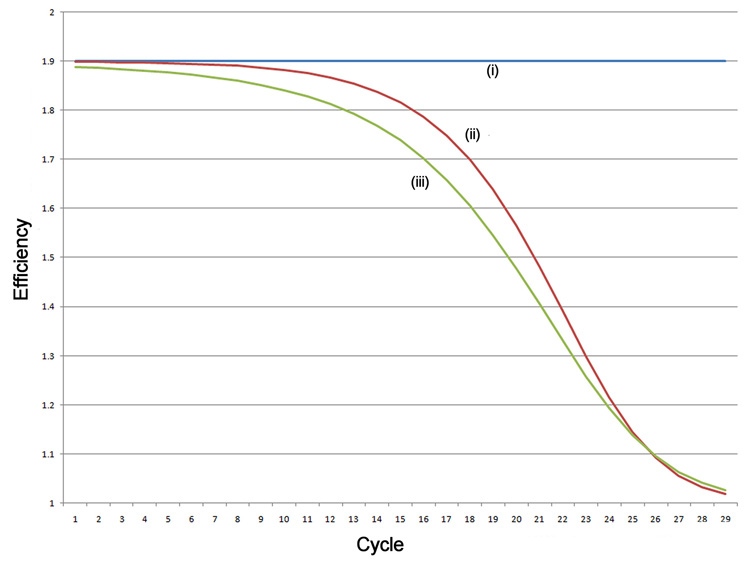
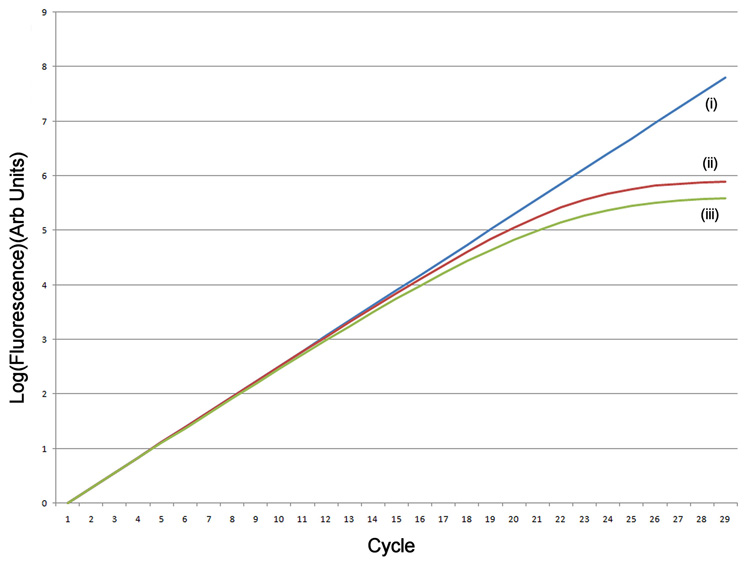
Ideally, amplification Emax would be 2.0 (100% efficiency) and all components of G constant and zero. However, in most reactions, Emax will be less than 2.0, a type A constraint, and G always rises as the reaction progresses as a consequence of type-B constraints. When Emax-G(Ti) reaches 1, amplification is essentially terminated. The term Emax-G(Ti) is thus the effective reaction efficiency at the ith cycle, Ei(effective). As expected (Figure 1A) even simple functions may serve to model G in ways that generally approximate the fluorescence trends observed during amplification. Clearly the reaction may rapidly depart from the maximum efficiency and become limited by G (Figure 1B). It is also evident that estimates of the log-linear gradient at later cycles increasingly underestimates the efficiencies of the earlier cycles (Figure 1C). By using a model of Ei(effective) that is allowed to vary and is carried back to cycle zero, an estimate of the initial template that inherently recognizes a declining efficiency prior to observating the measurable fluorescent signal should be possible.
Figure 1.
Simulation of amplification. (A) A simulated exponential amplification curve with Emax=1.9 (i) generated using an unconstrained efficiency Tn+1=Tn × 1.9 (T0=1), (ii) efficiency limited as a simple function of increasing template Tn+1=Tn × (1.9−0.001×Tn 0.5), and (iii) efficiency limited by a more physically realistic function Tn+1=Tn × (1.9−(0.001×Tn 0.5 + 0.01×Tn 0.25)). (B) Reaction efficiency as a function of cycle for the three models. (C) Log(fluorescence) of the exponential amplification.
G is anticipated to be a higher-order function that will vary in form between reactions as the design and environment factors that contribute to the deterioration of an exponential reaction vary. It is the task of the algorithm to approximate a representative function G from the reliable signal data. To accomplish this, G is assumed to be a continuous non-periodic function (Equation 3), that can be closely approximated by a truncated series of power terms.
| (Eq. 3) |
Values for the exponents 0≤n>2 were readily removed from consideration since they lead to non-physical models where runaway and cyclical amplification processes are respectively generated. Using a large test dataset generated primarily on MJ Research (BioRad) Chromo4, but also other systems including the ABI 7500, Corbett LifeSciences Rotor-Gene and Stratagene Mx3005, we estimated the weight for each exponent term in the set n(j). This was performed by serially adding terms to a model, minimizing the residual (Equation 4), and recording the weight Kj for each term. Given x, the cycle at which reliable signal is first detected, and max, the cycle at which the 95% maximum signal is attained, T(obs) and T(pred) are the observed signal and the predicted signal used to estimate a model residual. The higher-order terms should have a weak impact on the early cycles of a reaction but rapidly clamp the developing amplification, while low-order terms have an impact that is evident from the earliest cycles.
| (Eq. 4) |
While the different terms varied between systems it was readily apparent that weights for J>5 (ie n(j)≥1.2) became vanishingly small in most reactions due to the unrealistic rapid quenching of the reaction in these models. Similarly the contributions made by lower-order terms j<2 (n(j)<0.2) were also small reflecting the very protracted reaction duration that would be simulated. Hence only the weights Kj for 2≤j≤5 (0.4≤n≤1.0) and Emax are estimated in the current implementation. Optimization of weights takes place again through residual minimization rather than differentiation as has been undertaken in other exponential models [18]. Contributions to the residual are not considered equal, but are adjusted (w) by cycle. Following removal of any ground-state signal the weights are adjusted with earlier amplification cycles where signal/noise is close to zero, w is low, while cycles close to a log-linear phase contribute more, and finally the later cycles of amplification are assigned a decreasing weight as the reaction progresses through its log-linear phase to termination.
Implementation
The KLAB-PCR package was implemented in two parts to aid cluster-based parallelism for large projects. The user interface and scheduling were developed in object oriented VisualBasic (RealSoftware.com) while the core modeling (‘child’) elements were developed in C++ using Microsoft Visual Studio (2005).
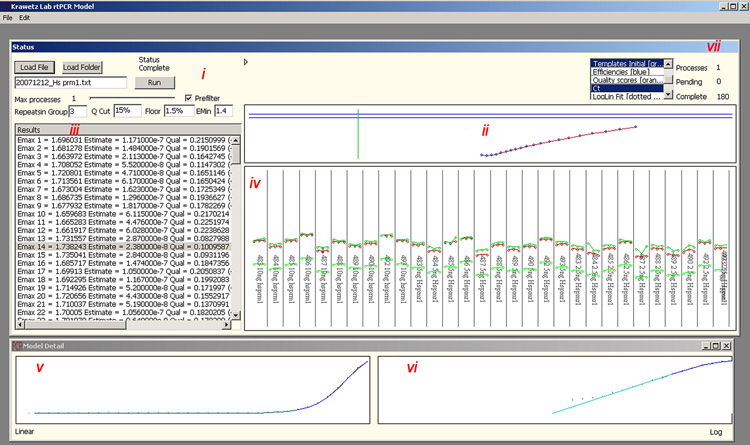
The system allows the user to specify the total effective number of CPUs available. The scheduling component (Figure 2) then maintains a parallel number of child modeling instances using the operating system to distribute the processes over the available resources. The child model uses a two-stage approach to estimate the unknown variables in the power series. In the first stage an initial estimate of Emax is calculated by seeking the optimum fit from a series in which only the most significant power terms are modeled. These estimates are then averaged over any available replicates using a trimmed mean to develop a robust estimate of maximum efficiency. Emax is then fixed in the second iteration of modeling and the higher order power series elements are estimated while the lower order terms are optimized. Finally the scheduling application assesses the models provided by the child process and assigns a fit index to each ranging from zero, when no difference between model and experiment is observed, to higher values when increasing weaknesses in the models are evident. Weak models and curves that could not be modeled are flagged.
Figure 2.
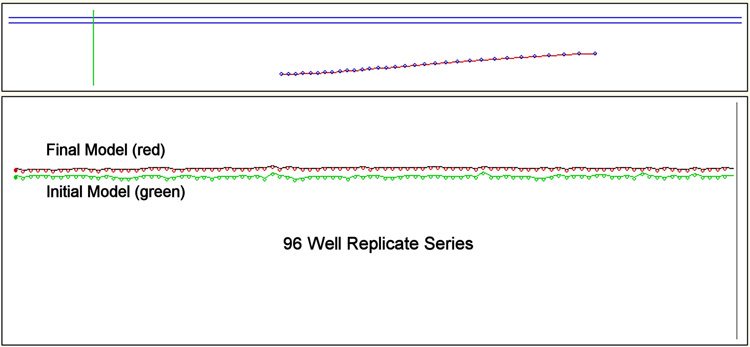
The user interface of KLAB-PCR. The window driven interface includes (i) data loading and analysis preferences (ii) E(max) identification through the first non-linear model (iii) data output including Emax, template estimation and model quality (iv) a graphical representation of template estimates from the first model (top green) final model (middle red) and Ct approaches (lower green) (v) PCR amplification curve (blue) generated from the final model and data curve (red) (vi) Log-linear fit (blue) to data (red) (vii) Progress of analysis. Replicates may be grouped based on sets of primers (A) or treated as a single group for example where the same reaction is replicated across 96 wells (B).
PCR
All PCR reactions were carried out in a 20 µL volume utilizing the Sigma SYBR® Green JumpStart™ Taq™ ReadyMix system and evaluated on the Chromo4 real time PCR detection system (Bio-Rad). All results were analyzed using the KLab-PCR program.
PCR validation of loop and nuclear matrix fractionated DNAs assessed by CGH (Comparative Genomic Hybridization) were carried out using 5 ng template DNA and a final primer concentration of 2 µM per reaction. Quantification of DNA was determined using PicoGreen™ (Molecular Probes) fluorometry [22]. Cycling conditions were 94°C for 2 min, followed by 45 cycles of 94°C for 30 s, 65°C for 1 min, and 72°C for 1 min (Table 1).
Table 1.
Primers used for the determination of copy number, CGH and relative expression.
| PRIMER NAME | FORWARD (5’ – 3’) | REVERSE (5’ – 3’) | AMPLICON SIZE | Ta |
|---|---|---|---|---|
| CGH VALIDATION PRIMERS | ||||
| Human Chromosome 16:589541 – 590150 | CGTGGGTGTTCGCTACTGT | AGAGGCTCCAACATCAAGGG | 609 | 65 |
| EXPRESSION ANALYSIS PRIMERS | ||||
| PRM1* | CGGAGCTGCCAGACACGGA | CTACATCTCGGTCTGTACCTGGG | 65 | 64 |
| PRM2* | AAGACGCTCCTGCAGGCAC | GCCTTCTGCATGTTCTCTT | 71 | 64 |
| TNP2 | GCCTTCTGCATGTTCTCTT | TTGCGTAGAAATCACCATAGT | 1161 | 64 |
| ZYGOSITY PRIMERS | ||||
| Mouse Chromosome 1610802607:10802980 | TTAAAGATAATGCGGGATGTAT | GCTCCAAGGCAACTCTTAAT | 373 | 52 |
| PRM1 | CAGAGCCGGAGCAGATATTACC | ATTTATTGACAGGCGGCATTGTT | 359 | 62.5 |
Steger K, Wilhelm J, Konrad L, Stalf T, Greb R, Diemer T, Kliesch S, Bergmann M, Weidner W. Both protamine-1 to protamine-2 mRNA ratio and Bcl2 mRNA content in testicular spermatids and ejaculated spermatozoa discriminate between fertile and infertile men. Human Reproduction 2008 23(1):11–16
Reverse transcription of 5 µg of total testis RNA was performed using the Invitrogen Superscript III™ system. All PCR reactions contained 5 ng cDNA and a final primer concentration of 1 µM. Cycling conditions were 95°C for 15 min, followed by 45 cycles of 94°C for 20 s, 64°C for 1 min, and 72°C for 30 s (Table 1).
Zygosity was determined using a dilution series of 2.5, 5, and 10 ng of genomic DNA. All reactions had a final primer concentration of 1 µM. Reactions were carreid out for 35 cycles And were initiated at 95°C for 15 min, followed by 45 cycles of 94°C for 20 s, 64°C for 1 min, and 72°C for 30 s as summarized in Table 1.
Results and Discussion
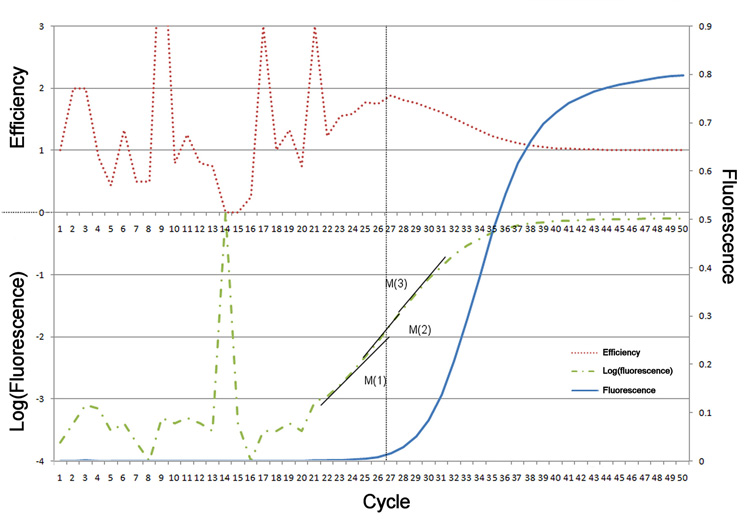
The successful application of any algorithm is ultimately limited by the sensitivity and linearity of the measuring instrument. As illustrated in Figure 3, background noise generally obscures the signal from the fluorescently tagged product over many of the early amplification cycles. In estimating the form of the reaction curve the algorithms would be limited to the detectable signal available around cycle 26 and beyond. While the log-linear phase of the reaction appears most consistent at cycle 26–27 (M1), it is apparent from the increasing efficiency data that these cycles are most likely compromised by poor measurement resolution and the non-linearity of the instrument at low signal.
Figure 3.
PCR fluorescence data (blue – right axis) measured on a Chromo4 Thermocycler, together with efficiency (red – left axis) and log(fluorescence) (green – left axis). Three tangents M(1–3) are shown relative to the log signal. M(1) demonstrates the highest local linearity (R2=0.9993) but is in the poorly resolved low-signal segment. The range of initial template predicted by M(1–3) varies from 1.5e-2 to 2e-3 demonstrating the sensitivity to data selection.
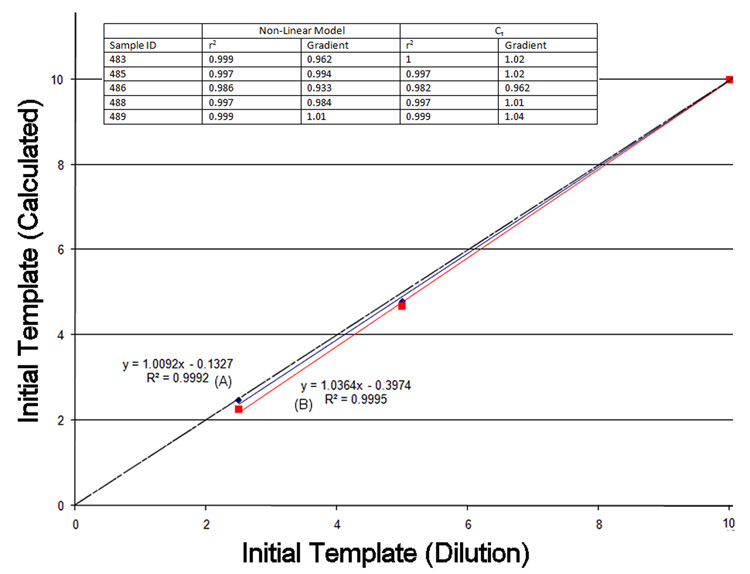
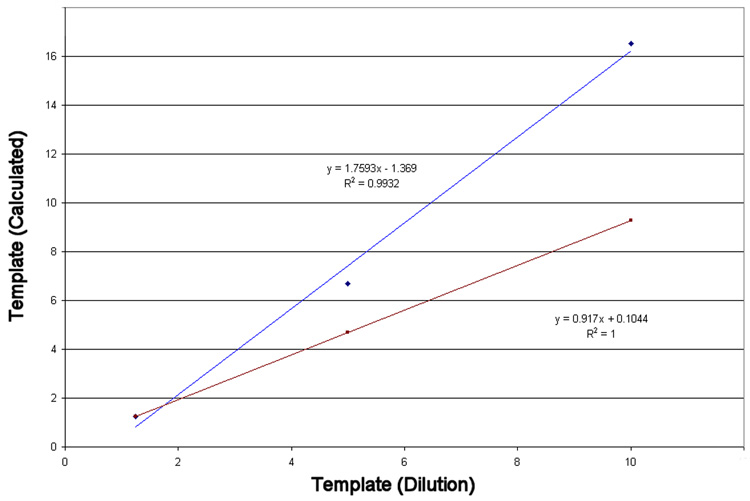
To test the two approaches an intergenic chromosome 16 genomic template (Table 1) was serially diluted from an arbitrary starting concentration (10 units) to 5 and 2.5 units. These concentrations were plotted against the predictions of the two algorithms to estimate linearity and dilution accuracy. When the efficiency is correctly determined the dilution rate approaches 1. When the reaction efficiency is close to 100% both the Ct and non-linear models are concordant (Figure 4). In contrast, when the reaction efficiency falls significantly below 100%, the Ct approach while still predicting a linear dilution, over-estimates the dilution. Conversely, the non-linear model shows both high linearity and continues to reflect the experimental dilutions (Figure 5). With ‘good data’ the non-linear approach is generally robust. However, in those cases where the experimental data is subject to a high background it may not be possible to model the earlier development phase of the reaction. In this case the Ct method may provide a useful alternative when used with the standard comparators.
Figure 4.
Genomic template concentration calculated using the known dilution (X) and also by the two approaches described (Y). Initial template (Protamine 1, primers Table 1) (10 units) was serially diluted by a factor of 2 and 4 and reactions undertaken on a Chromo4 thermocycler. The non-linear model (A, blue) and Ct model (B, red) both closely parallel each other in this reaction due to the near perfect reaction efficiency. The r2 and gradients for five different biological samples are also shown (inset table). Ideal values for the gradients and r2 values are 1 as indicated by the dotted line in the chart.
Figure 5.
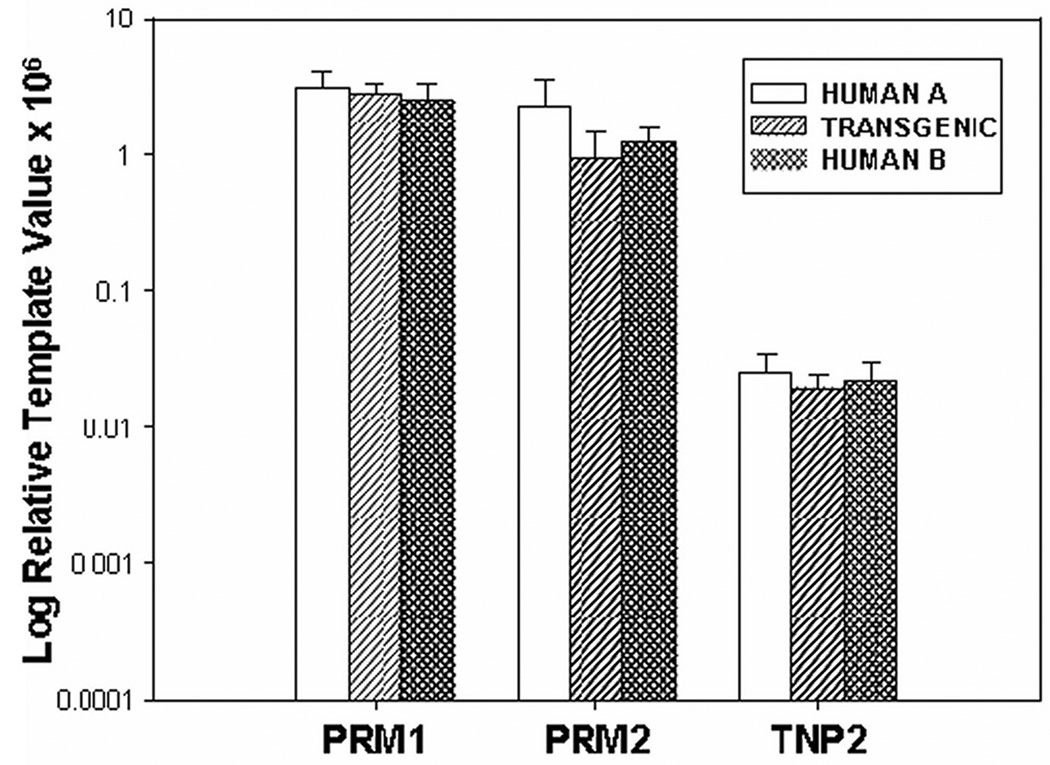
Relative level of expression of the members of the human protamine locus. The expression of human PRM1, PRM2, and TNP2 genes were assayed by qRT-PCR of total testis RNA. Relative expression was determined by the parametric modeling approach. Expression of the suite of genes in transgenic animals was similar to that observed in human.
Validation of consistency of the algorithm with respect to multiple near-identical amplification reactions was demonstrated using a manufacturer supplied 96-well test plate. The results (Figure 2B) show that as implemented, the algorithm is remarkably consistent. The concentration of the initial template shows a low coefficient of variation consistent with the manufacturer’s thermal stability (±0.4C) across the thermocycler stage.
To assess the efficacy of this approach the application of this technology to three scenarios from our laboratory was examined. These included the confirmation of high-throughput CGH analysis, expression analysis and assessing heterozygosity.
CGH Validation
Fractionation that separates DNA associated with the nuclear matrix from non-associated portions of the genome may now be conducted at the genomic scale and analyzed through both high-throughput sequencing and microarray-based CGH [23]. These technologies provide global snapshots of nuclear architecture. They nonetheless require validation that ensures systematic bias has not been introduced. PCR validation provides an accurate local reference relative to which the high-throughput approaches can be compared and validated. Since unique primers are designed to interrogate DNA in the different fractions, accurate PCR validation requires that reaction efficiencies are appropriately compensated to permit the correct assessment and comparison of relative fractionation.
HeLa cell genomic nuclear matrix and loop associated DNA was fractionated using LIS (lithium 3,5-diiodosalicylate) extraction as described [24]. The loop fraction was labeled with Cy-3 and matrix fraction with Cy-5 respectively then competitively hybridized to high resolution chromosome 16 oligonucleotide arrays (Roche Nimblegen) [23]. Negative signal values on these arrays show DNA to be associated with the nuclear matrix. A series of PCR reactions were designed to amplify 1 kb region of chromosome 16p that by CGH were shown to be consistently associated with the nuclear matrix (Build 36.2 location 589,161 to 590,161). The initial template value for each reaction was calculated using the parametric non-linear fitting model and median values for the replicates were compared. As anticipated the ratio of loop to matrix DNA were reflective of the results obtained with CCH analysis (Table 2).
Table 2.
Loop/Matrix Genome Fractionation. (A) Initial template values from triplicate amplifications of loop and matrix DNA were calculated using the KLab PCR parametric modeling. Ratios of loop:matrix median values were used to determine the percentage of the total DNA in each fraction. (B) CGH array analysis of the fractionated genomic DNA probed within the amplified region.
| A. | ||||
|---|---|---|---|---|
| Region Amplified | Reaction Name | Initial Template | Median Values | % of Total |
| 589,161 – 590,161 | HeLa LIS Loop 1 | 1.36E-05 | 0.0000175 | 38% |
| HeLa LIS Loop 2 | 1.75E-05 | |||
| HeLa LIS Loop 3 | 2.12E-05 | |||
| HeLa LIS Matrix 1 | 2.86E-05 | 0.0000286 | 62% | |
| HeLa LIS Matrix 2 | 2.96E-05 | |||
| HeLa LIS Matrix 3 | 2.37E-05 | |||
| B. | |
|---|---|
| Chromosome 16 Genomic Probe Location | Normalized Matrix Percentage |
| 589,501 | 60% |
| 590,181 | 66% |
Expression Analysis
The algorithm described allows the relative expression levels at multiple genic regions to be readily compared even where the primers demonstrate a broad range of amplification efficiencies. The results permit a rapid quantitative study of the underlying expression trend that does not require a full dilution series for each location.
Expression from each member of the human transgenic PRM1, PRM2 and TNP2 a locus was assessed. Total testis RNA was isolated from transgenic mouse and human tissue. Each gene in the human protamine domain was interrogated using its own primer pair (Tabel 1). Analysis of the relative expression levels of the human protamine genes demonstrated that transgenic animals harboring the human protamine locus expressed the suite of genes (Figure 5) Comparison to the total human testis RNAs demonstrated that expression of the transgene was similar confirming that the transgenic system may act as a functioning model of the human protamine domain (Figure 5).
Zygosity
PCR may allow for the determination of relative copy number and hence the zygosity of transgenic animals without the need for multiplexed PCR reactions or Southern blotting. Though the development of a multiplex PCR assay for such analysis was a significant improvement over the use of radio-labeled probes [25], a more efficient method of ascertaining zygosity was desirable. The non-linear parametric modeling algorithm may be applied to quickly extrapolate the relative template values of a region of DNA. Selection of parallel primer sets directed to a portion of the endogenous genome and the transgenic insertion yields a simple ratio of template values that may be used to establish zygosity.
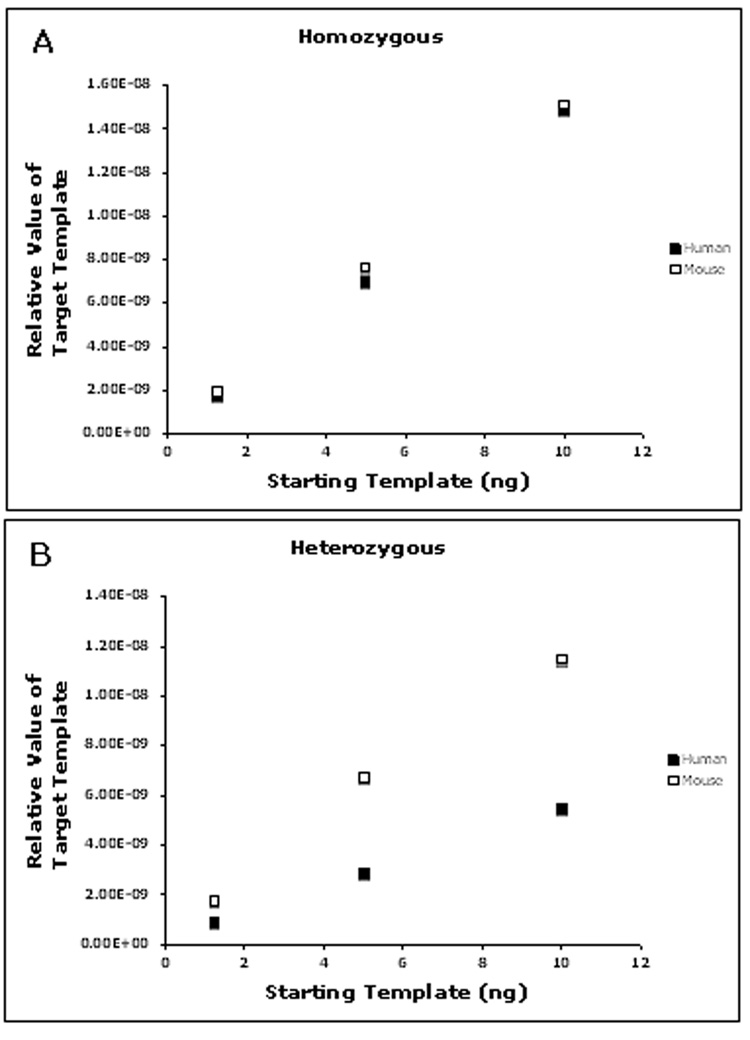
Following quantification, transgenic DNA was serially diluted and assessed in separate PCR reactions containing primer pairs (Table 1) targeting a portion of the mouse genome or a specific region within a transgenic insertion. The results were analyzed using KLAB-PCR to determine the relative amount of template for each targeted genomic region initially present in the sample. For both primer sets the resulting dose response was correlated (r2 = 0.99; Figure 6). The dilution series is not required but demonstrates the linearity for both primer sets in all samples as determined using this approach. The zygosity of the transgenic animals was then ascertained by comparing the resulting relative amount of template for each amplified regions. Within a single copy transgenic mouse line the inserted region will be present once in a heterozygote and twice in a homozygote. The ratio of the relative template value of the transgenic region to that of the endogenous was 1 for all points in a dilution series in samples isolated from a homozygote (Figure 7A). This ratio is reduced to half in those samples derived from heterozygous individuals (Figure 7B). Similarly, multi-copy transgenic animals are readily identified as the ratio of the relative template value of the transgene to that of the endogenous exceeds 1.
Figure 6.
Performance of the non-linear and Ct models. The reaction efficiency was not-ideal (Emax=1.75). While both approaches exhibit a linear response as a function of the template concentration, the Ct approach significantly over-estimates the dilution rate where the model generally reflects the dilution series.
Figure 7.
Determination of zygosity by comparison of transgene and endogenous template values. Serially diluted DNA isolated from single copy transgenic mice was subjected to PCR analysis with primer pairs Determination of Copy number. An endogenous region of the genome or a portion of the human transgene were targeted for PCR analysis. Data from separate reactions was combined to demonstrate the different ratios of relative template values of the templates indicative of a homozygous (A) or heterozygous (B) state.
Conclusion
We assume that the maximum efficiency of a reaction may plateau at an Emax below 100%. However it is useful to reflect whether this efficiency plateau is constraining in all or only a subset of reactions? The early cycles of a reaction are difficult to observe in any ‘real world’ system. As cycle zero is approached, PCR efficiency may, in some cases, trend asymptotically towards near ideal efficiency. The approach does allow for both a system in which the cycle-zero efficiency is near ideal but quickly departs this level, as well as models with a cycle-zero efficiency of less than 100% that only significantly drops from this level at later cycles (see Figure 1B). The former condition would however benefit from models with additional lower order (0<n<0.2) power terms. Future developments will seek to extend this approach.
Acknowledgements
The contributions of Dr Rui Pires Martins to test data generation and his comments on the manuscript are gratefully acknowledged. This work was supported by National Institute of Child Health and Human Development Grant HD36512 (to S.A.K.) and the Department of Obstetrics and Gynecology of Wayne State University (S.A.K.).
Footnotes
Publisher's Disclaimer: This is a PDF file of an unedited manuscript that has been accepted for publication. As a service to our customers we are providing this early version of the manuscript. The manuscript will undergo copyediting, typesetting, and review of the resulting proof before it is published in its final citable form. Please note that during the production process errors may be discovered which could affect the content, and all legal disclaimers that apply to the journal pertain.
References
- 1.Wang AM, Doyle MV, Mark DF. Quantitation of mRNA by the polymerase chain reaction. Proc Natl Acad Sci U S A. 1989;86:9717–9721. doi: 10.1073/pnas.86.24.9717. [DOI] [PMC free article] [PubMed] [Google Scholar]
- 2.Roth CM. Quantifying gene expression. Curr Issues Mol Biol. 2002;4:93–100. [PubMed] [Google Scholar]
- 3.Klein D. Quantification using real-time PCR technology: applications and limitations. Trends Mol Med. 2002;8:257–260. doi: 10.1016/s1471-4914(02)02355-9. [DOI] [PubMed] [Google Scholar]
- 4.Bustin SA. Quantification of mRNA using real-time reverse transcription PCR (RT-PCR): trends and problems. J Mol Endocrinol. 2002;29:23–39. doi: 10.1677/jme.0.0290023. [DOI] [PubMed] [Google Scholar]
- 5.Ginzinger DG. Gene quantification using real-time quantitative PCR: an emerging technology hits the mainstream. Exp Hematol. 2002;30:503–512. doi: 10.1016/s0301-472x(02)00806-8. [DOI] [PubMed] [Google Scholar]
- 6.Orlando C, Pinzani P, Pazzagli M. Developments in quantitative PCR. Clin Chem Lab Med. 1998;36:255–269. doi: 10.1515/CCLM.1998.045. [DOI] [PubMed] [Google Scholar]
- 7.Gevertz JL, Dunn SM, Roth CM. Mathematical model of real-time PCR kinetics. Biotechnol Bioeng. 2005;92:346–355. doi: 10.1002/bit.20617. [DOI] [PubMed] [Google Scholar]
- 8.Liu W, Saint DA. Validation of a quantitative method for real time PCR kinetics. Biochem Biophys Res Commun. 2002;294:347–353. doi: 10.1016/S0006-291X(02)00478-3. [DOI] [PubMed] [Google Scholar]
- 9.Ostermeier GC, Liu Z, Martins RP, Bharadwaj RR, Ellis J, Draghici S, Krawetz SA. Nuclear matrix association of the human beta-globin locus utilizing a novel approach to quantitative real-time PCR. Nucleic Acids Res. 2003;31:3257–3266. doi: 10.1093/nar/gkg424. [DOI] [PMC free article] [PubMed] [Google Scholar]
- 10.Tricarico C, Pinzani P, Bianchi S, Paglierani M, Distante V, Pazzagli M, Bustin SA, Orlando C. Quantitative real-time reverse transcription polymerase chain reaction: normalization to rRNA or single housekeeping genes is inappropriate for human tissue biopsies. Anal Biochem. 2002;309:293–300. doi: 10.1016/s0003-2697(02)00311-1. [DOI] [PubMed] [Google Scholar]
- 11.Vandesompele J, De Preter K, Pattyn F, Poppe B, Van Roy N, De Paepe A, Speleman F. Accurate normalization of real-time quantitative RT-PCR data by geometric averaging of multiple internal control genes. Genome Biol. 2002;3 doi: 10.1186/gb-2002-3-7-research0034. RESEARCH0034. [DOI] [PMC free article] [PubMed] [Google Scholar]
- 12.Dheda K, Huggett JF, Bustin SA, Johnson MA, Rook G, Zumla A. Validation of housekeeping genes for normalizing RNA expression in real-time PCR. Biotechniques. 2004;37:112–114. 116, 118–119. doi: 10.2144/04371RR03. [DOI] [PubMed] [Google Scholar]
- 13.Pfaffl MW. A new mathematical model for relative quantification in real-time RT-PCR. Nucleic Acids Res. 2001;29:e45. doi: 10.1093/nar/29.9.e45. [DOI] [PMC free article] [PubMed] [Google Scholar]
- 14.Skern R, Frost P, Nilsen F. Relative transcript quantification by quantitative PCR: roughly right or precisely wrong? BMC Mol Biol. 2005;6:10. doi: 10.1186/1471-2199-6-10. [DOI] [PMC free article] [PubMed] [Google Scholar]
- 15.Freeman WM, Walker SJ, Vrana KE. Quantitative RT-PCR: pitfalls and potential. Biotechniques. 1999;26:112–122. 124–125. doi: 10.2144/99261rv01. [DOI] [PubMed] [Google Scholar]
- 16.Rutledge RG, Cote C. Mathematics of quantitative kinetic PCR and the application of standard curves. Nucleic Acids Res. 2003;31:e93. doi: 10.1093/nar/gng093. [DOI] [PMC free article] [PubMed] [Google Scholar]
- 17.Ramakers C, Ruijter JM, Deprez RH, Moorman AF. Assumption-free analysis of quantitative real-time polymerase chain reaction (PCR) data. Neurosci Lett. 2003;339:62–66. doi: 10.1016/s0304-3940(02)01423-4. [DOI] [PubMed] [Google Scholar]
- 18.Tichopad A, Dilger M, Schwarz G, Pfaffl MW. Standardized determination of real-time PCR efficiency from a single reaction set-up. Nucleic Acids Res. 2003;31:e122. doi: 10.1093/nar/gng122. [DOI] [PMC free article] [PubMed] [Google Scholar]
- 19.Rebrikov DV, Trofimov D. Real-time PCR: approaches to data analysis (a review) Prikl Biokhim Mikrobiol. 2006;42:520–528. [PubMed] [Google Scholar]
- 20.Alvarez MJ, Vila-Ortiz GJ, Salibe MC, Podhajcer OL, Pitossi FJ. Model based analysis of real-time PCR data from DNA binding dye protocols. BMC Bioinformatics. 2007;8:85. doi: 10.1186/1471-2105-8-85. [DOI] [PMC free article] [PubMed] [Google Scholar]
- 21.Peirson SN, Butler JN, Foster RG. Experimental validation of novel and conventional approaches to quantitative real-time PCR data analysis. Nucleic Acids Res. 2003;31:e73. doi: 10.1093/nar/gng073. [DOI] [PMC free article] [PubMed] [Google Scholar]
- 22.Goodrich RJ, Ostermeier GC, Krawetz SA. Multitasking with molecular dynamics Typhoon: quantifying nucleic acids and autoradiographs. Biotechnol Lett. 2003;25:1061–1065. doi: 10.1023/a:1024154817579. [DOI] [PubMed] [Google Scholar]
- 23.Linnemann AK, Platts AE, Doggett N, Gluch A, Bode J, Krawetz SA. Genomewide identification of nuclear matrix attachment regions: an analysis of methods. Biochem Soc Trans. 2007;35:612–617. doi: 10.1042/BST0350612. [DOI] [PubMed] [Google Scholar]
- 24.Kay V, Bode J. Detection of scaffold-attached regions (SARs) by in vitro techniques; activities of these elements in vivo. In: Papavassiliou AG, King SL, editors. Methods in Molecular and Cellular Biology: Methods for studying DNA-protein interactions - an overview. Wiley-Liss; 1995. pp. 186–194. [Google Scholar]
- 25.Martins RP, Krawetz SA. Using multiplexed real-time polymerase chain reaction to rapidly identify single-copy transgenic animals. Anal Biochem. 2004;329:337–339. doi: 10.1016/j.ab.2004.02.041. [DOI] [PubMed] [Google Scholar]


