

Abstract
Neuropeptide S (NPS) has been shown to modulate arousal, sleep-wakefulness, anxiety-like behavior and feeding after central administration of the peptide agonist to mice or rats. We report here the chemical synthesis and pharmacological characterization of SHA 66 (3-Oxo-1,1-diphenyl-tetrahydro-oxazolo[3,4-a]pyrazine-7-carboxylic acid benzylamide) and SHA 68 (3-Oxo-1,1-diphenyl-tetrahydro-oxazolo[3,4-a]pyrazine-7-carboxylic acid 4-fluoro-benzylamide), two closely related bicyclic piperazines with antagonistic properties at the NPS receptor (NPSR). The compounds block NPS-induced Ca2+-mobilization and SHA 68 shows displaceable binding to NPSR in the nanomolar range. The antagonistic activity of SHA 68 appears to be specific as it does not affect signaling at fourteen unrelated G protein-coupled receptors. Analysis of pharmacokinetic parameters of SHA 68 demonstrates that the compound reaches pharmacologically relevant levels in plasma and brain following intraperitoneal (i.p.) administration. Furthermore, peripheral administration of SHA 68 in mice (50 mg/kg, i.p.) is able to antagonize NPS-induced horizontal and vertical activity as well as stereotypic behavior. Therefore, SHA 68 could be a useful tool to characterize physiological functions and pharmacological parameters of the NPS system in vitro and in vivo.
Introduction
Neuropeptide S (NPS) and its receptor, NPSR, are a recently identified transmitter system that modulates a number of brain functions (Okamura and Reinscheid, 2007). NPS is a small peptide of 20 amino acids that occurs in all tetrapod vertebrates but is absent from fish (Reinscheid, 2007). Activation of NPSR produces transient increases in intracellular Ca2+ and cAMP and thus increases cellular excitability (Reinscheid et al., 2005). Expression of NPS precursors and receptors is found in specific brain areas that have been associated with arousal, emotional processing, energy and hormonal homeostasis, as well as learning and memory (Xu et al., 2004; 2007). In the rat, NPS precursor transcripts are expressed in only a few brainstem structures, in particular in a previously uncharacterized nucleus situated between the noradrenergic locus coeruleus and Barrington’s nucleus. Besides the pericoerulear region, NPS mRNA is only found in the lateral parabrachial nucleus and the principle sensory 5 nucleus of the rat brainstem. A few scattered cells expressing NPS precursor transcripts are also detected in the amygdala and hypothalamus. In the brainstem, the majority of NPS-expressing neurons co-express other excitatory transmitters, such as glutamate, acetylcholine or corticotropine-releasing factor (Xu et al., 2007). NPSR mRNA is found at high levels in hypothalamus, thalamus, amygdala, various cortical regions and the parahippocampal formation. Central administration of NPS was shown to produce profound arousal that is independent of novelty (Xu et al., 2004). NPS is also able to induce wakefulness by suppressing all stages of sleep, as demonstrated by electroencephalographic recordings in rats. In addition, NPS administration was shown to produce anxiolytic-like effects across various behavioral paradigms measuring responses to stressful or unfamiliar environments in mice (Xu et al., 2004, Leonard et al, 2005). Other studies reported anorexic effects after central NPS administration (Beck et al., 2005; Smith et al., 2006) and modulation of stress hormone levels (Smith et al., 2006), although a recent study challenged the initial findings on NPS-induced inhibition of feeding behavior (Niimi, 2007).
A functional polymorphism in the human NPSR gene has been identified that encodes an Asn to Ile amino acid exchange at position 107 of the receptor protein (A/T; SNP database accession number rs324981). NPSR Ile107 shows a five to tenfold increased agonist sensitivity compared to NPSR Asn107 when measuring second messenger responses, although binding affinity for the natural agonist NPS is unchanged at both receptor isoforms (Reinscheid et al., 2005). This polymorphism had been originally associated with an increased risk of asthma and other allergic diseases (Laitinen et al., 2004) but the role of NPSR in airway function is currently unclear (Allen et al., 2006). We have recently found evidence for a gender-specific association of the NPSR Asn107Ile polymorphism with panic disorder (Okamura et al., 2007) and a genome-wide screen for markers of sleep behavior and circadian phenotypes identified the NPSR Ile107 polymorphism strongly associated with mean bedtime in a random population cohort (Gottlieb et al., 2007). These early data indicate that the endogenous NPS system might be involved in modulating sleep or circadian behaviors as well as emotional processing.
Characterization of physiological functions modulated by NPS is still at an early stage and availability of a selective NPSR antagonist is critically important for such research. A series of synthetic compounds with presumed activity at NPSR were published recently in a patent application by Takeda Pharmaceuticals Inc., but no pharmacological or biological data were presented (Fukatsu et al., 2005). The patent disclosed that structures containing a substituted bicyclic piperazine scaffold possess NPSR antagonistic activity. Two structurally similar compounds were quoted to have affinities below 100 nM, but no primary data were presented to support the claim. We therefore set out to synthesize these compounds and validate their pharmacological properties as potential NPSR antagonists in vitro and in vivo. The availability of synthetic NPSR antagonist compounds will certainly facilitate further research on physiological functions of the NPS system.
Methods
Chemicals
All chemicals were of analytical grade or higher quality. NPS was synthesized by the Peptide Proteomic Centre, Brain Research Centre, University of British Columbia (Vancouver, BC, Canada) and stock solutions were dissolved in water. [125I] Tyr10-NPS was kindly provided as a gift from NEN Perkin-Elmer. Other peptides were purchased from Bachem (Torrance, CA) or American Peptide Company (Sunnyvale, CA).
Synthesis and structure verification of SHA 66 and SHA 68
1H NMR and 13C NMR spectra were recorded at ambient temperature at 400 MHz and 100 MHz, respectively, using a Bruker DRX 400 spectrometer. All spectra were acquired in CDCl3 with chemical shifts reported as δ values in ppm and are calibrated according to internal CDCl3 (7.26 ppm) solvent residual peak. The data are reported as follows: multiplicity (br = broad, s = singlet, d = doublet, t = triplet, dd = double doublet, dt = double triplet, m = multiplet), integration, and coupling constants (Hz). Infrared spectra (IR) were obtained on a Perkin-Elmer Model 1600 series FTIR spectrophotometer and are reported in wavenumbers (cm-1). High resolution mass spectra were acquired on a Waters LCT Premier (ESI) spectrometer. Synthesis and characterization of previously unreported compounds are detailed below. Structures are numbered (in bold type) according to the synthesis scheme as depicted in Fig. 1. LogP values for SHA 66 and SHA 68 were calculated with a web-based calculator (http://intro.bio.umb.edu/111-112/OLLM/111F98/newclogp.html).
Fig. 1.
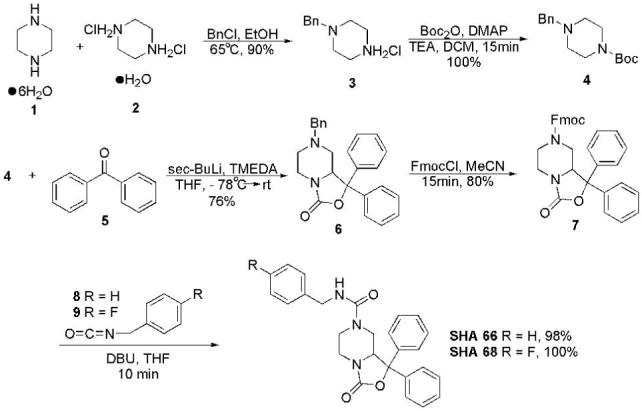
Chemical synthesis of SHA 66 and SHA 68. Intermediate compounds are numbered (in bold type) and described in Materials and Methods.
7-Benzyl-1,1-diphenyl-hexahydro-oxazolo[3,4-a]pyrazin-3-one (6)
To a solution of 4 (1.00 g, 3.74 mmole) in tetrahydrofuran (THF, 12 ml) and N,N’-tetramethylethylene diamine (1.20 ml, 8.23 mmole) was added sec-butyllithium (6.20 ml, 8.23 mmole) dropwise at -78 °C. The mixture was allowed to warm to -30 °C over 2 h, at which point the reaction was cooled back to -78 °C. A solution of benzophenone (1.40 g, 7.48 mmole) in THF (8 ml) was added dropwise. The flask was allowed to warm to room temperature overnight and the reaction was quenched by the addition of saturated aqueous NH4Cl (10 ml), extracted with ethyl acetate (3 × 30 ml), washed with H2O, dried (Na2SO4), filtered and concentrated. The residue was purified by column chromatography (10-50 % EtOAc:hexanes) to yield 6 (1.06 g, 76 %) as a clear oil that foamed under vacuum. IR (neat): 3027, 2814, 1769, 1449, 1249, 1032, 995, 917, 755, 699 cm-1; 1H NMR (400 MHz, CDCl3): δ 7.52-7.55 (m, 2H), 7.23-7.40 (m, 13H), 4.58 (br d, 1H, J = 9.0 Hz), 3.82 (dd, 1H, J = 2.5, 13.2 Hz), 3.52 (d, 1H, J = 13.1 Hz), 3.33 (d, 1H, J = 13.1 Hz), 3.12 (br t, 1H, J = 12.1 Hz), 2.71 (br d, 1H, J = 8.5 Hz), 2.58 (dd, 1H, J = 2.6, 11.4 Hz), 1.96 (br t, 1H, J = 8.6 Hz), 1.61 (t, 1H, J = 11.1 Hz); 13C NMR (100 MHz, CDCl3): δ 156.1, 142.8, 138.8, 129.1, 128.7, 128.6, 128.5, 128.4, 128.0, 127.5, 126.1, 125.9, 85.4, 63.0, 61.5, 55.9, 50.9, 41.8; HRMS (ESI) calculated for C25H24N2O2Na (M+Na) 407.1736, found 407.1732.
3-Oxo-1,1-diphenyl-tetrahydro-oxazolo[3,4-a]pyrazine-7-carboxylic acid 9H-fluoren-9-ylmethyl ester (7)
To a solution of 6 (3.48 g, 9.05 mmole) in acetonitrile (45 ml) was added FmocCl (2.58 g, 9.96 mmole) in one portion and the mixture brought to reflux at 90 °C. After approximately 10 minutes a white precipitate formed in the reaction flask. The suspension was allowed to stir at reflux for an additional 5 h, after which the mixture was cooled and vacuum filtered. The precipitate was washed with an additional portion of cold acetonitrile (20 ml). The crude white solid 7 (3.76 g, 80 %) was then used without further purification. IR (neat): 1762, 1702, 1449, 1426, 1229, 986, 757, 702 cm-1; 1H NMR (400 MHz, CDCl3) (spectrum acquired at room temperature): 7.74-7.80 (m, 2H), 7.25-7.55 (m, 15H), 7.14-7.16 (m, 1H), 4.50-4.88 (m, 2H), 4.21 (br s, 1.4H), 4.16 (br s, 0.6H), 3.98 (br s, 1H), 3.75 (br s, 1.6H), 3.45 (br s, 0.4H), 2.70-2.92 (m, 2H), 2.13 (t, 1H, J = 12.4 Hz); HRMS (ESI) calculated for C33H28N2O4Na (M+Na) 539.1947, found 539.1951.
3-Oxo-1,1-diphenyl-tetrahydro-oxazolo[3,4-a]pyrazine-7-carboxylic acid benzylamide (SHA 66)
To a mixture of 7 (2.00 g, 3.87 mmole) and benzyl isocyanate (962 μl, 7.74 mmole) in THF (20 ml) was added 1,8-diazabicyclo[5.4.0]undec-7-ene (637 μl, 4.26 mmole) dropwise. The reaction was stirred for 15 minutes at room temperature, quenched by addition of saturated aqueous NH4Cl (10 ml), extracted with ethyl acetate (3 × 40 ml), dried (Na2SO4), filtered and concentrated. The residue was purified by column chromatography (40 % EtOAc:hexanes then 10 % MeOH:CHCl3) to give SHA 66 (1.61 g, 98%) as a yellow oil that foamed under vacuum. IR (neat): 3354, 1755, 1633, 1538, 1450, 1263, 1082, 1030, 982, 752, 699; 1H NMR (400 MHz, CDCl3): 7.46-7.48 (m, 2H), 7.15-7.40 (m, 13H), 5.90 (t, 1H, J = 5.5 Hz), 4.25-4.41 (m, 3H), 4.05 (dd, 1H, J = 2.7, 13.3 Hz), 3.77 (br d, 1H, J = 11.4 Hz), 3.64 (dd, 1H, J = 2.7, 13.0 Hz), 2.92 (dt, 1H, J = 3.5, 12.7 Hz), 2.67 (dt, 1H, J = 3.4, 13.3 Hz), 2.06, (dd, 1H, J = 11.4, 13.2 Hz); 13C NMR (100 MHz, CDCl3): 157.4, 156.0, 141.7, 139.4, 138.2, 128.7, 128.6, 128.5, 128.4, 128.2, 127.4, 127.2, 125.9, 125.7, 85.8, 60.4, 46.5, 44.8, 43.4, 41.2; HRMS (ESI) calculated for C26H25N3O3Na (M+Na) 450.1794, found 450.1783.
3-Oxo-1,1-diphenyl-tetrahydro-oxazolo[3,4-a]pyrazine-7-carboxylic acid 4-fluoro-benzylamide (SHA 68)
To a mixture of 7 (2.00 g, 3.87 mmole) and 4-fluorobenzyl isocyanate (986 μl, 7.74 mmole) in THF (20 ml) was added 1,8-diazabicyclo[5.4.0]undec-7-ene (636 μ l, 4.25 mmole) dropwise. The reaction was stirred for 15 minutes at room temperature, quenched by addition of saturated aqueous NH4Cl (10 ml), extracted with ethyl acetate (3 × 40 ml), dried (Na2SO4), filtered and concentrated. The residue was purified by column chromatography (40 % EtOAc:hexanes then 10 % MeOH:CHCl3) to give SHA 68 (1.72 g, 100%) as a clear oil that foamed under vacuum. IR (neat): 3356, 1748, 1633, 1538, 1508, 1449, 1222, 1156, 1032, 981, 832, 753, 701; 1H NMR (400 MHz, CDCl3): δ 7.49 (br d, 2H, J = 7.2 Hz), 7.22-7.40 (m, 10H), 6.98 (t, 2H, J = 8.6 Hz), 5.07 (t, 1H, J = 5.4 Hz), 4.28-4.42 (m, 3H), 4.03 (dd, 1H, J = 2.8, 13.3 Hz), 3.79 (dd, 1H, J = 3.0, 13.0 Hz), 3.67 (br d, 1H, J = 12.1 Hz), 3.04 (dt, 1H, J = 3.6, 12.6 Hz), 2.86 (dt, 1H, J = 3.5, 13.0 Hz), 2.14 (dd, 1H, J = 11.4, 13.1 Hz); 13C NMR (100 MHz, CDCl3): δ 157.2, 156.1, 141.9, 138.4, 135.0, 129.5, 129.4, 128.9, 128.8, 128.7, 128.4, 126.0, 125.9, 115.7, 115.5, 85.9, 60.6, 46.6, 44.5, 43.8, 41.4; HRMS (ESI) calculated for C26H24FN3O3Na (M+Na) 468.1700, found 468.1700.
Functional characterization in vitro
Generation of stable cell lines expressing human NPSR Asn107, NPSR Ile107 and mouse NPSR has been described before (Xu et al., 2004; Reinscheid et al., 2005). Agonist-induced mobilization of intracellular Ca2+ was measured using the FLIPR technology as described previously (Reinscheid et al., 2005). Antagonist compounds were dissolved as 10 mM stock solutions in dimethyl sulfoxide (DMSO) and then diluted into assay buffer containing 0.1% bovine serum albumine (BSA) (Sigma, St. Louis, MS) with final DMSO levels at < 1% (V/V). Halfmaximal inhibitory concentrations (IC50) of antagonists were determined in triplicate by preincubating cells stably expressing NPSR for 10 min with the compounds before challenging with various concentrations of NPS peptide. IC50 values were calculated by nonlinear regression analysis using GraphPad Prism (GraphPad Software Inc., San Diego, CA). Dose-ratios for agonist dose-responses in the presence of different antagonist concentrations were determined for Schild analysis in order to obtain Kb values for antagonist binding. IC50 values at functional agonist EC50 were obtained by first running an agonist dose-response and then using the calculated agonist EC50 on the same batch of cells for antagonist dose-responses.
Radioligand binding in cells stably expressing NPSR-Ile107 was performed as described before (Xu et al., 2004). SHA 68 was tested in triplicate for displacement of [125I] Tyr10-NPS. Non-specific binding was determined in the presence of 1 μM NPS. Ki values were calculated with GraphPad Prism.
SHA 68 was tested for selectivity against a number of G protein-coupled receptors (GPCRs), expressed either stably, transiently or endogenously in various cell lines as listed in Table 1. Receptors were preincubated with 10 μM SHA 68 for 10 min and then activated with 100 nM of their corresponding agonists (Table 1) to test for both agonistic and antagonistic activity. Receptor activation was monitored as mobilization of intracellular Ca2+ using the FLIPR technology. In cases of Gi-linked receptors (e.g. D2 dopamine receptor or opioid receptors) the corresponding cell lines were cotransfected with a chimeric G protein that allows for coupling of Gi-linked receptors to the phospholipase C pathway, as described before (Saito et al., 1999).
Table 1.
Selectivity Profile of SHA 68
| Receptor | Cell line | Expression | Agonist |
|---|---|---|---|
| Vasopressin 1a | HEK 293 | transient | Arg8-vasopressin |
| Oxytocin | HEK 293 | transient | Oxytocin |
| Tachykinin 1 | U 373 MG | endogenous | Substance P |
| μ-Opioid | CHO | stable | Dermorphin |
| κ-Opioid | CHO | stable | Dynorphin A |
| Nociceptin/Orphanin FQ | CHO | stable | Orphanin FQ / Nociceptin |
| Somatostatin 2 | HEK 293 | transient | Somatostatin-28 |
| Melanin-concentrating hormone 1 | HEK 293 | stable | MCH |
| Neuropeptide Y 2 | HEK 293 | transient | Neuropeptide Y |
| D2 Dopamine | HEK 293 | transient | Dopamine |
| β2-Adrenergic | HEK 293 | endogenous | Isoproterenol |
| Trace amine 1 | HEK 293 | stable | Tyramine |
| P2Y1 | 1321 N1 | stable | ADP |
| P2Y12 | CHO | stable | ADP |
In vivo studies
Male C57BL/6 mice (National Cancer Institute, Bethesda, MD, or Charles River Laboratories, Wilmington, MA), age 8-12 weeks, were group-housed (4 animals per cage) under controlled conditions (temperature 21 ± 2°C; relative humidity 50-60%; 12-hour light-dark cycle, lights on 6:00 AM) with free access to food and water. For intracerebroventricular (i.c.v.) drug injections, mice were briefly anesthetized with halothane. NPS was dissolved in phosphate-buffered saline (PBS, pH 7.4) containing 0.1 % BSA and injected i.c.v. (total volume: 2 μl) as described before (Xu et al., 2004). SHA 68 was dissolved in PBS containing 10% Cremophor EL (Sigma) and 100 μl were injected intraperitoneally (i.p.).
For pharmacokinetic (PK) studies, mice were weighed and then injected i.p. or i.v. with the drug dissolved in a vehicle suitable for injection (5% dimethylacetamide, 5% Cremophor EL, 90% PBS at 0.2 mg/ml for i.v. and 2.5% dimethylacetamide, 2.5% Cremophor EL, 95% PBS at 0.5 mg/ml for i.p.). A total of 24 animals were used for a total of 6 time points with 4 animals per time point. Animals were euthanized and blood was collected in heparinized tubes. Plasma was isolated by centrifugation and drug levels were determined by LC/MS/MS according to the analytical method described below. Similarly, 12 animals were used from blood brain barrier (BBB) penetration studies for a total of 3 time points (0.25, 1, and 2 h) and 4 animals per time point. At the indicated time intervals, animals were euthanized. Their blood was collected and plasma was isolated for plasma drug level determination by LC/MS/MS. Brains were harvested, blotted on absorbent paper, and homogenized in a 50:50 (V/V) mixture of saline and ethanol (3 ml per gram of brain). Drug concentration in brain tissue was determined using the same LC/MS/MS method. All experiments were carried out in accordance with the Guidelines for the Care and Use of Mammals in Neuroscience and Behavioral Research (National Research Council, 2003) and approved by the local Institutional Animal Care and Use Committees (IACUC).
Analytical method
Plasma proteins were precipitated by mixing plasma samples with a stock solution of reserpine in acetonitrile (1 volume plasma for 3 volumes acetonitrile). After centrifugation, the supernatant was isolated and analyzed by liquid chromatography-coupled tandem mass spectrometry (LC/MS/MS). Homogenized brain samples were treated in a similar fashion with 3 volumes of the acetonitrile solution containing internal standard (reserpine). Precipitated material was removed by centrifugation and the supernatant was analyzed by LC/MS/MS. Standard curves were prepared by spiking plasma or brain homogenate with a stock solution of test compound dissolved in DMSO. The spiked samples were treated as described above.
Samples were analyzed on a Finnigan TSQ Quantum Ultra (Thermo Electron Corporation) mass spectrometer, equipped with a Turbo-Ionspray interface, in positiveion mode (source temperature: 400°C) and with an Agilent 1100 Series LC system comprising autosampler, pump, and column oven. A Kromasil 100-5 C4 (30 × 4.6 mm) column was used for the separation (3 min gradient using 0.1% formic acid in water as solvent A and 0.1% formic acid in acetonitrile as solvent B). Transitions m/z 446.2/167.0 and 609.7/195.0 were monitored for SHA-68 and the internal standard (reserpine), respectively.
Chromatograms were automatically integrated using Finnigan Xcalibur Software. A 1/x2-weighted least-squares linear regression was applied to calibration standards (ng/ml in plasma or brain sample) using peak area ratio of analyte to internal standard. Finally, concentrations for analyte in plasma and brain samples were interpolated. Plasma and brain concentrations (ng/ml and ng/g, respectively) were back-calculated from the interpolated concentrations and the dilution factors.
NPS-induced hyperlocomotion
Locomotion of mice was monitored in an automated activity system equipped with infrared sensors for both horizontal and vertical activity measurements (Versamax, Accuscan Inc., Columbus, OH). Male C57BL/6 mice were allowed to habituate to the recording chamber for 2 h. Vehicle or SHA 68 (in PBS, 10% cremophor EL) were injected i.p. 10 minutes before central administration of either NPS (1 nmole in 2 μl PBS, 0.1 % BSA) or vehicle (PBS, 0.1 % BSA). Recording of locomotor activity began 5 minutes after the i.c.v. injections and continued for 90 minutes. Horizontal activity represents infrared beam breaks in the X and Y dimension, while vertical activity was recorded by infrared sensors located 10 cm above the chamber floor (Z dimension). Stereotypic behavior is defined as repetitive breaks of a single beam that is not followed by a consecutive beam break of an adjacent sensor. The automated system does not allow for differentiation of individual stereotypic behaviors, such as grooming or sniffing.
Statistical analysis
PK data for SHA 68 (plasma concentration vs. time) were obtained at 1 mg/kg i.v. and 2.5 mg/kg i.p. PK curves were analyzed using a non-compartmental approach (NCA, Non-Compartmental Analysis, model 200, extravascular input, for i.p. injection, and NCA model 201, i.v.-bolus input, for i.v. dosing) with linear trapezoidal interpolation and uniform weighting in WinNonLin version 5.1.1 (Pharsight, Mountain View, CA). Cumulative horizontal, vertical or stereotypic activities for the complete 90-min session were analyzed by one-way ANOVA followed by Bonferroni’s post hoc test, where appropriate. Selected data sets of cumulative activity data were also compared by unpaired t-test. The time course of horizontal, vertical or stereotypic activity over the 90-min session was divided in 5-min intervals and analyzed by two-way ANOVA with time and drug treatment as variables. P values of < 0.05 were considered significant.
Results
Synthesis and structure verification
The piperazine derivatives SHA 66 and SHA 68 were both synthesized (Fig. 1) in five steps from cheap, commercially available piperazine hexahydrate 1 in 54 % and 55% overall yields, respectively. Monobenzylation of 1 was accomplished in the presence of one equivalent of piperazinium dihydrochloride monohydrate 2 (synthesized from 1) to yield 3 in 90 % yield after recrystallization (two crops) (Cymerman-Craig, 1959; Cymerman-Craig and Young, 1962; 1973). Standard Boc protection of 3 gave the differentially protected 4 in quantitative yield (Berkheij, 2005). Intermediate 4 was then treated with sec-BuLi/TMEDA, at -78 °C, followed by trapping of the intermediate anion with benzophenone. The formation of 6 occurred smoothly, in good yield (76 %), with only a small amount of the dialkylated side product (<10%) observed. After several unsuccessful attempts to selectively remove the benzyl protecting group of 6 via hydrogenolysis, an alternate strategy was employed. Fortunately, amine debenzylation could be accomplished by addition of FmocCl to an acetonitrile solution of 6 at room temperature. After approximately 10 minutes, 7 precipitated from the solution and could be filtered and used without further purification. The yield of the reaction could be increased to 80 % by heating to 90 °C for five hours, after which time, no further conversion was observed. Compounds SHA 66 and SHA 68 were then obtained in almost quantitative yield from a mixture of 7 and the requisite isocyanate (8 or 9) by treatment with DBU, to remove the Fmoc protecting group, followed by addition of the secondary amine to the isocyanate. The structures of SHA 66 and SHA 68 were fully characterized by IR, 1H and 13C NMR, and mass spectrometry. Both compounds were insoluble in water or aqueous buffers and calculated logP values of 4.21 for SHA 66 and 4.35 for SHA 68, respectively, supported this observation. Therefore, stock solutions of the compounds were prepared in 100% DMSO and diluted appropriately thereafter.
In vitro pharmacological activity
As shown in Fig. 2 A-D, SHA 66 and SHA 68 potently antagonized NPSR activation by the endogenous agonist NPS in HEK cells stably expressing human NPSR Asn107 or NPSR Ile107, respectively. Schild analysis revealed that SHA 66 inhibited NPS-induced Ca2+ mobilization with pA2 values of 7.662 at NPSR Asn107 and 7.486 at NPSR Ile107, respectively (Fig. 2E, Table 2). The fluorinated analog SHA 68 displayed pA2 values of 7.771 at NPSR Asn107 and 7.554 at NPSR Ile107, respectively. Since the slope of the Schild plot for both compounds at both receptor isoforms was close to 1.0 (Table 2) and therefore indicated that they are competitive antagonists, Kb values were extrapolated from the linear regression curves (Table 2). Schild analysis also indicated that both compounds have about 1.5-fold higher affinity at NPSR Asn107 than NPSR Ile107. At functional agonist EC50 concentrations, SHA 66 displayed IC50 values of 26.1 and 28.8 nM at NPSR Asn107 and NPSR Ile107, respectively, while SHA 68 yielded IC50 values of 22.0 and 23.8 nM at the two NPSR isoforms, respectively (Table 2). Cells stably expressing mouse NPSR showed similar inhibition of NPS-induced Ca2+ mobilization by SHA 66 and SHA 68 with IC50 values of 60.8 ± 13.8 nM and 48.7 ± 14.7 nM against a single agonist concentration of 12.5 nM NPS, respectively (data not shown). In radioligand binding experiments SHA 68 competed for labeled NPS binding at NPSR Ile107 with a Ki value of 47.7 nM (95% confidence interval: 39.01 - 58.31 nM), which is reasonably close to the calculated Kb of 27.9 nM for SHA 68 at NPSR Ile107 (Fig. 2 F, Table 2). Non-specific binding was approximately 14% of total binding under these conditions.
Fig. 2.

Pharmacological activity of SHA 66 (A, B) and SHA 68 (C, D) at NPSR Asn107 (NPSR-N107) and NPSR Ile107 (NPSR-I107). Both compounds were tested in the presence of increasing concentrations of NPS to generate dose-ratios for Schild analysis by measuring mobilization of intracellular Ca2+ in HEK 293 cells stably expressing the different NPSR isoforms. Concentrations of antagonist compounds are given in the figure legend of B. Data are shown as means ± SEM. E, Schild analysis of dose-ratios followed by linear regression analysis. F, Displacement of radioligand binding by SHA 68 in cells stably expressing NPSR Ile107. [125I] Tyr10-NPS (40 pmole) was used as a tracer and incubations were done in triplicate. Data are shown as means ± SEM.
Table 2.
Pharmacological characterization of SHA 66 and SHA 68
| SHA 66 | SHA 68 | |||
|---|---|---|---|---|
| NPSR Asn107 | NPSR Ile107 | NPSR Asn107 | NPSR Ile107 | |
| pA2 (95% CI) | 7.662 (7.997-7.426) | 7.486 (7.886-7.225) | 7.771 (8.167-7.502) | 7.554 (7.823-7.354) |
| Kb | 21.7 nM | 32.6 nM | 16.9 nM | 27.9 nM |
| Schild Slope | 1.007 ± 0.06363 | 1.041 ± 0.07110 | 1.066 ± 0.08553 | 0.9817 ± 0.05494 |
| IC50 (at functional agonist EC50) | 26.1 ± 8.1 nM | 28.8 ± 12.2 nM | 22.0 ± 4.4 nM | 23.8 ± 9.4 nM |
| Ki (binding) | 47.7 nM | |||
pA2, negative logarithm of antagonist concentration shifting the agonist EC50 by a factor of 2; Kb, dissociation constant of antagonist binding extrapolated from Schild analysis; Schild slope, slope from linear regression curve of dose-ratios; IC50, halfmaximal concentration of antagonist required to block agonist response at functional agonist EC50 (EC50 in this experiment: NPSR Asn107 = 15.6 nM; NPSR Ile107 = 4.3 nM); Ki, equilibrium dissociation constant determined by radioligand binding; CI, confidence interval
Selectivity profile of SHA 68
Fourteen different GPCRs were tested to establish a selectivity profile for SHA 68 (Table 1). Each receptor was expressed in a suitable cellular environment, either endogenously, transiently or as a stable clone, and activated with its endogenous ligand at 100 nM. SHA 68 was tested at a concentration of 10 μM. No agonistic or antagonistic activity of SHA 68 was observed at any of the GPCRs tested, indicating that the compound appears to be selective for NPSR. In particular, no activity of SHA 68 was detected at vasopressin or oxytocin receptors, which are sequentially closest to NPSR, albeit at only 25-29% amino acid identity.
Pharmacokinetic profile of SHA 68
SHA 66 and SHA 68 display very similar pharmacological profiles in vitro, but SHA 68 appears to have slightly higher potency at mouse NPSR than SHA 66. Therefore, we selected SHA 68 for further in vivo experiments in mice. Due to the lipophilic nature of SHA 68 (calculated logP = 4.35), we first analyzed the pharmacokinetic profile of the compound in mice. SHA 68 was injected into male C57BL/6 mice at 1, and 2.5 mg/kg for i.v. bolus and i.p. administration, respectively. Plasma samples were collected from 4 mice at 6 different time points and concentration of drug in plasma was determined by a standard LC/MS/MS protocol. Dose-normalized PK curves (plasma concentration Cp as a function of time) are presented in Figure 3A. Non-compartmental analysis of the data (WinNonLin, Pharsight) was used to generate PK parameters that are summarized in Table 3.
Fig. 3.

Pharmacokinetic analysis of SHA 68 in mice. A, Dose-normalized plasma concentrations (in (ng/ml)/(mg/kg)) as a function of time (in h) for i.v. administration of SHA 68 at 1 mg/kg dose (open squares) and i.p. administration at 2.5 mg/kg (triangles) dose. Plasma and brain concentrations of SHA 68 administered i.p. at 5 (B) and 50 mg/kg (C), 0.25, 1, and 2 hours post-dose. D, Brain/plasma ratio (ml/g) calculated from B and C as a function of dose and time. Animal numbers were n = 5 at all time points. Data are shown as means ± S.E.M.
Table 3.
Pharmacokinetic parameters of SHA 68
| i.v. | i.p. | |
|---|---|---|
| AUC_last (h.ng/ml) | 231 | 548 |
| AUC_inf (h.ng/ml) | 233 | 549 |
| CL (l/h/kg) | 4.29 | 4.56 |
| Vss (l/kg) | 2.53 | - |
| MRT (h) | 0.54 | 0.52 |
| t1/2 (h) | 0.74 | 0.43 |
| bioavailability | 94% | |
PK parameters obtained by non-compartmental analysis of PK curves (see text) for i.v. administration of SHA 68 at 1 mg/kg and i.p. dosing at 2.5 mg/kg. Data were calculated as described in the methods. AUC_last, area under the curve between time zero and the last measured time point; AUC_inf, area under the curve extrapolated to infinity; CL, clearance; Vss, volume of distribution at steady state; MRT, mean residence time, t1/2, half-life;
Bioavailability of the compound administered i.p., calculated as the ratio of dose-normalized area under the curve (AUC) between i.p. and i.v. dosing, is almost quantitative. Elimination half-life (t1/2) is shorter for i.p. than for i.v. route of administration. This observation is however driven by the last time points of the PK curve, which are the most susceptible to experimental errors. Mean residence times (MRT), on the other hand, are similar between the two injection routes. Volume of distribution at steady-state (Vss) was calculated to be 2.5 l/kg, showing extensive distribution of the compound outside the vasculature, and the extracellular space. Blood-brain-barrier (BBB) penetration of SHA 68 was tested by i.p. administration of 5 and 50 mg/kg in male C57BL/6 mice. Animals (4 per group) were euthanized at 0.25, 1, and 2 hours post-dose. Graphs of plasma and brain concentrations of SHA 68, in ng/ml, and ng/g, respectively, as well as their ratio, are presented in Figure 3B. While the brain-to-plasma ratio increases with progressing time at the 5 mg/kg dose, both brain and plasma concentrations of SHA 68 drop dramatically over the same period of time, as expected from PK data (decrease factor ∼50 for plasma and ∼8 for brain concentration ratio between 0.25 and 2 hours). On the contrary, at the 50 mg/kg dose, plasma and brain concentrations of SHA 68 are more stable over time (decrease factor ∼5 for plasma and ∼3 for brain concentration ratio between 0.25 and 2 hours). This is most likely due to a slowdown in elimination of the compound as the dose increases. Conversion to molar concentrations indicated that at a dose of 50 mg/kg i.p., pharmacologically relevant concentrations of SHA 68 at or above its Kb value can be reached for at least one hour in both plasma and brain (plasma: 87.99 ± 21.99 μM at 15 min, 49.63 ± 10.98 μM at 60 min; brain: 6.33 ± 0.33 μM at 15 min, 6.06 ± 0.23 μM at 60 min; data are averages ± SEM, n = 5).
In vivo activity of SHA 68
NPS is known to induce hyperlocomotion in mice after central administration. In order to test whether this central effect of NPS can be antagonized by SHA 68, we recorded motor activity in mice that had been injected with vehicle or SHA 68 (5 and 50 mg/kg; i.p.) and subsequently received central administrations of either vehicle or 1 nmole NPS (i.c.v.). As shown in Fig. 4A, injection of NPS + vehicle increased horizontal activity that lasted for at least 90 min. Injection of NPS + SHA 68 (50 mg/kg) reduced horizontal activity to about 50% of the activity recorded from NPS + vehicle injected mice, demonstrating that this dose of SHA 68 was effective in at least partially blocking NPS-induced horizontal activity. Statistical analysis revealed significant main effects of drug treatment (F4,68 = 211.52, p < 0.0001) and time (F17,68 = 19.12; p < 0.0001) with interaction (F = 1.47; p = 0.0087). Analysis of cumulative activity data revealed that SHA 68 alone [Veh + SHA 68 (50 mg/kg)] was able to reduce basal horizontal activity when compared to vehicle-injected mice (p = 0.022, unpaired t-test; Fig. 4D). However, this effect is not statistically significant across the five treatment groups of the experiment by one-way analysis of variance (ANOVA). At the highest dose (50 mg/kg), SHA 68 was able to block about 50% of 1 nmole NPS-induced motor activation. In contrast, a tenfold lower dose of SHA 68 (5 mg/kg) did not produce significant effects in blocking NPS-induced horizontal activity.
Fig. 4.

Effect of SHA 68 on motor activity in mice. Mice had been habituated for 2 h prior to injection. SHA 68 was dissolved in 10% cremophor EL (vehicle) and injected (i.p.) 10 min before NPS or vehicle (PBS, 0.1 % BSA) were injected centrally (i.c.v.). Group sizes: Veh + Veh, n = 12; Veh + SHA 68 (50 mg/kg), n = 12; NPS + Veh, n = 18; NPS + SHA 68 (50 mg/kg), n = 15; NPS + SHA 68 (5 mg/kg), n = 22. A, Time-course of horizontal activity, B, vertical activity, and C, stereotypic behavior over 90 min; D, Cumulative horizontal activity, E, cumulative vertical activity, and F, cumulative stereotypy time during the 90 min observation period; *** p < 0.001 Veh + Veh vs. NPS + Veh; # p < 0.05, ### p < 0.001 NPS + Veh vs. NPS + SHA 68 (50 mg/kg), one-way ANOVA with Bonferroni post-hoc test.
SHA 68 displayed similar effects on vertical activity, i.e. rearing and climbing, in mice. As shown in Fig. 4B, central NPS administration increased vertical activity and this effect was at least partially blocked by co-administration of 50 mg/kg SHA 68 while the lower dose of the antagonist had no effect. Statistical analysis by two-way ANOVA revealed significant main effects of drug treatment (F4,68 = 53.24, p < 0.0001) and time (F17,68 = 1.98; p = 0.0102) without interaction. Analysis of cumulative vertical activity showed that SHA 68 also reduced basal vertical activity when compared to Veh + Veh treated animals (unpaired t-test; p = 0.0114), although this effect was not significant across the five treatment groups (Fig. 4 E). Furthermore, central NPS administration was found to significantly increase stereotypic behavior (defined as repetitive movements recorded by breaks of a single infrared beam), as shown in Fig. 4C. Statistical analysis by two-way ANOVA revealed significant main effects of drug treatment (F4,68 = 135.65, p < 0.0001) and time (F17,68 = 12.75; p < 0.0001) without interaction. NPS increased the cumulative duration of stereotypic behavior about threefold as compared to Veh + Veh treated animals and SHA 68 (50 mg/kg) blocked this effect by about 50% (Fig. 4F). Together, these data demonstrate that peripheral administration of SHA 68 is able to - at least partially - antagonize behavioral effects produced by central administration of NPS. Thus, SHA 68 behaves as an NPSR antagonist in vivo.
Discussion
Analysis of physiological functions of any neurotransmitter system depends on the availability of selective, high-affinity agonists and antagonists. So far, the recently discovered NPS system has only been studied by using the endogenous peptide agonist NPS. To our knowledge, the present study is therefore the first report of compounds with antagonistic activity at the NPS receptor.
The data presented in this study demonstrate that SHA 66 and SHA 68 are potent antagonists at NPSR in vitro and the selectivity profile of SHA 68 indicates that this compound might be selective for NPSR, although the panel of 14 GPCRs used in the screening is certainly not exhaustive. The two closely related bicyclic piperazines SHA 66 and SHA 68 display almost identical affinities indicating that the fluorination does not affect receptor binding. The pharmacological profiles of the two compounds do however reveal a slightly higher affinity for the NPSR Asn107 variant over NPSR Ile107. These observations indicate that the amino acid in position 107 of NPSR might interfere with binding of the two antagonist compounds. This is of particular interest because we have previously shown that the polymorphism at position 107 of NPSR (Asn vs. Ile) does not affect agonist binding affinity but has in turn profound effects on agonist efficacy by shifting the EC50 five to tenfold (Reinscheid et al., 2005). Therefore, the Ile107 side chain might stabilize a receptor conformation that is promoting agonist activation while the Asn107 side chain might facilitate antagonist binding. Using the bicyclic piperazine scaffold it should therefore be possible to develop compounds that display enhanced selectivity towards one of the two isoforms of the human NPS receptor. Such compounds could not only be useful in understanding the structural role of this critical amino acid within the receptor protein but might lead to individualized drugs that target specific genotypes of NPSR. We have recently shown that the NPSR Asn107 isoform is underrepresented in male panic disorder patients (Okamura et al., 2007) and thus specifically targeting NPSR Ile107 with selective NPSR antagonists might be a viable concept for developing novel therapeutics to treat panic disorder. In addition, specific NPSR genotypes were repeatedly found to be associated with asthma or other immunological disorders, although the functional role of NPSR in these pathologies remains unclear (Laitinen et al., 2004; Feng et al., 2006; Malerba et al., 2007; D’Amato et al., 2007).
The present study also provides evidence that SHA 68 is able to enter the brain and block NPS-induced behavioral responses in vivo. The pharmacokinetic profile of SHA 68, however, indicates that the compound has only limited BBB penetration. This might explain our observation that even at a relatively high dose of 50 mg/kg, SHA 68 was able to block only about 50% of the motor-activating effect produced by NPS. Obviously, compounds with improved pharmacokinetic profiles are needed to extend these studies and the chemical scaffold of SHA 66 and SHA 68 may be useful as a lead structure to design new compounds with improved potency and pharmacokinetic properties. It should also be mentioned that the automated behavioral observation system used in this study does not allow for detection of more complex behaviors that are often associated with arousal, such as increased grooming or sniffing. These behaviors and other small repetitive movements are detected and summarized as stereotypic activity. Differentiation of locomotion into horizontal, vertical and stereotypic activity has been chosen to illustrate the arousing properties of NPS and the attenuation of these effects by SHA 68 co-administration.
In summary, we present evidence that two closely related bicyclic piperazines are potent and selective antagonists at NPSR in vitro and are able to antagonize NPS-induced effects in vivo. These molecules should therefore be useful in the characterization of physiological functions of the NPS system and might lead to the development of novel therapeutic compounds.
Acknowledgements
The authors would like to thank S.D. Clark and D.M. Duangdao for helpful discussion, and O. Civelli for generous access to equipment resources.
This study was funded in part by grants from the National Institute of Mental Health (MH-71313 to RKR) and the National Institute of Neurological Disorders and Stroke (NS-27600 to ARC).
Nonstandard Abbreviations
- BSA
bovine serum albumine
- DMSO
dimethyl sulfoxide
- GPCR
G protein-coupled receptor
- LC-MS/MS
liquid chromatography-coupled tandem mass spectrometry
- NPS
neuropeptide S
- NPSR
neuropeptide S receptor
- PBS
phosphate-buffered saline
- SNP
single nucleotide polymorphism
- THF
tetrahydrofuran
References
- Allen IC, Pace AJ, Jania LA, Ledford JG, Latour AM, Snouwaert JN, Bernier V, Stocco R, Therien AG, Koller BH. Expression and function of NPSR1/GPRA in the lung before and after induction of asthma-like disease. Am J Physiol Lung Cell Mol Physiol. 2006;291:L1005–1017. doi: 10.1152/ajplung.00174.2006. [DOI] [PubMed] [Google Scholar]
- Beck B, Fernette B, Stricker-Krongrad A. Peptide S is a novel potent inhibitor of voluntary and fast-induced food intake in rats. Biochem Biophys Res Commun. 2005;332:859–865. doi: 10.1016/j.bbrc.2005.05.029. [DOI] [PubMed] [Google Scholar]
- Berkheij M, van der Sluis L, Sewing C, den Boer DJ, Terpstra JW, Hiemstra H, Bakker WII, van den Hoogenband A, van Maarseveen JH. Synthesis of 2-substituted piperazines via direct a-lithiation. Tet Lett. 2005;46:2369–2371. [Google Scholar]
- Cymerman-Craig J. Preparation of 1-benzylpiperazine. J Chem Soc, Abstracts. 1959:3634–3635. [Google Scholar]
- Cymerman-Craig J, Young RJ. 1-Benzylpiperazine. Org Syn. 1962;5:88. [Google Scholar]; 1-Benzylpiperazine. Org Syn. 1973;42:19. [Google Scholar]
- D’Amato M, Bruce S, Bresso F, Zucchelli M, Ezer S, Pulkkinen V, Lindgren C, Astegiano M, Rizzetto M, Gionchetti P, Riegler G, Sostegni R, Daperno M, D’Alfonso S, Momigliano-Richiardi P, Torkvist L, Puolakkainen P, Lappalainen M, Paavola-Sakki P, Halme L, Farkkila M, Turunen U, Kontula K, Lofberg R, Pettersson S, Kere J. Neuropeptide s receptor 1 gene polymorphism is associated with susceptibility to inflammatory bowel disease. Gastroenterology. 2007;133:808–817. doi: 10.1053/j.gastro.2007.06.012. [DOI] [PubMed] [Google Scholar]
- Feng Y, Hong X, Wang L, Jiang S, Chen C, Wang B, Yang J, Fang Z, Zang T, Xu X, Xu X. G protein-coupled receptor 154 gene polymorphism is associated with airway hyperresponsiveness to methacholine in a Chinese population. J Allergy Clin Immunol. 2006;117:612–617. doi: 10.1016/j.jaci.2005.11.045. [DOI] [PubMed] [Google Scholar]
- Fukatsu K, Nakayama Y, Tarui N, Mori M, Matsumoto H, Kurasawa O, Banno H. Preparation of oxazolo[3,4-a]pyrazine derivatives as TGR23 ligand antagonists. WO 2005021555 PCT Int Appl. 2005
- Gottlieb DJ, O’Connor GT, Wilk JB. Genome-wide association of sleep and circadian phenotypes. BMC Med Genet. 2007;8(Suppl 1):S9. doi: 10.1186/1471-2350-8-S1-S9. [DOI] [PMC free article] [PubMed] [Google Scholar]
- Laitinen T, Polvi A, Rydman P, Vendelin J, Pulkkinen V, Salmikangas P, Makela S, Rehn M, Pirskanen A, Rautanen A, Zucchelli M, Gullsten H, Leino M, Alenius H, Petays T, Haahtela T, Laitinen A, Laprise C, Hudson TJ, Laitinen LA, Kere J. Characterization of a common susceptibility locus for asthma-related traits. Science. 2004;304:300–304. doi: 10.1126/science.1090010. [DOI] [PubMed] [Google Scholar]
- Leonard SK, Malberg JE, Schechter LE, Luo B, Platt B, Rosenzweig-Lipson S, Ring RH. 2005 Abstract Viewer/Itinerary Planner. Washington, DC: Society for Neuroscience. 2005. Behavioral effects of neuropeptide S in mouse models of anxiety and depression. Program No. 889.14. [Google Scholar]
- Malerba G, Lindgren CM, Xumerle L, Kiviluoma P, Trabetti E, Laitinen T, Galavotti R, Pescollderungg L, Boner AL, Kere J, Pignatti PF. Chromosome 7p linkage and GPR154 gene association in Italian families with allergic asthma. Clin Exp Allergy. 2007;37:83–89. doi: 10.1111/j.1365-2222.2006.02615.x. [DOI] [PubMed] [Google Scholar]
- National Research Council . Guidelines for the care and use of mammals in neuroscience and behavioral research. National Academies Press; Washington DC: 2003. [PubMed] [Google Scholar]
- Niimi M. Centrally administered neuropeptide S activates orexin-containing neurons in the hypothalamus and stimulates feeding in rats. Endocrine. 2006;30:75–79. doi: 10.1385/ENDO:30:1:75. [DOI] [PubMed] [Google Scholar]
- Okamura N, Reinscheid RK. Neuropeptide S: A novel modulator of stress and arousal. Stress. 2007;10:221–226. doi: 10.1080/10253890701248673. [DOI] [PubMed] [Google Scholar]
- Okamura N, Hashimoto K, Iyo M, Shimizu E, Dempfle A, Friedel S, Reinscheid RK. Gender-specific association of a functional coding polymorphism in the Neuropeptide S receptor gene with panic disorder but not with schizophrenia or attention-deficit/hyperactivity disorder. Prog Neuro-Psychopharmacol Biol Psychiatry. 2007;31:1444–1448. doi: 10.1016/j.pnpbp.2007.06.026. [DOI] [PubMed] [Google Scholar]
- Reinscheid RK, Xu YL, Okamura N, Zeng J, Chung S, Pai R, Wang Z, Civelli O. Pharmacological characterization of human and murine neuropeptide S receptor variants. J Pharmacol Exp Ther. 2005;315:1338–1345. doi: 10.1124/jpet.105.093427. [DOI] [PubMed] [Google Scholar]
- Reinscheid RK. Phylogenetic appearance of neuropeptide S precursor proteins in tetrapods. Peptides. 2007;28:830–837. doi: 10.1016/j.peptides.2007.01.008. [DOI] [PMC free article] [PubMed] [Google Scholar]
- Saito Y, Nothacker HP, Wang Z, Lin SH, Leslie F, Civelli O. Molecular characterization of the melanin-concentrating-hormone receptor. Nature. 1999;400:265–259. doi: 10.1038/22321. [DOI] [PubMed] [Google Scholar]
- Smith KL, Patterson M, Dhillo WS, Patel SR, Semjonous NM, Gardiner JV, Ghatei MA, Bloom SR. Neuropeptide S stimulates the hypothalamo-pituitary-adrenal axis and inhibits food intake. Endocrinology. 2006;147:3510–3518. doi: 10.1210/en.2005-1280. [DOI] [PubMed] [Google Scholar]
- Xu YL, Reinscheid RK, Huitron-Resendiz S, Clark SD, Wang Z, Lin SH, Brucher FA, Zeng J, Ly NK, Henriksen SJ, de Lecea L, Civelli O. Neuropeptide S: A neuropeptide promoting arousal and anxiolytic-like effects. Neuron. 2004;43:487–497. doi: 10.1016/j.neuron.2004.08.005. [DOI] [PubMed] [Google Scholar]
- Xu YL, Gall CM, Jackson VR, Civelli O, Reinscheid RK. Distribution of neuropeptide S receptor mRNA and neurochemical characteristics of neuropeptide S-expressing neurons in the rat brain. J Comp Neurol. 2007;500:84–102. doi: 10.1002/cne.21159. [DOI] [PubMed] [Google Scholar]