

Abstract
A colorimetric chemodosimeter (SQ1) for the detection of trace palladium salts in cross-coupling reactions mediated by palladium is described. Decolorization of SQ1 is affected by nucleophilic attack of ethanethiol in basic DMSO solutions. Thiol addition is determined to have an equilibrium constant (Keq) of 2.9 × 10⁶ M-1, with a large entropic and modest enthalpic driving force. This unusual result is attributed to solvent effects arising from a strong coordinative interaction between DMSO and the parent squaraine. Palladium detection is achieved through thiol scavenging from the SQ1-ethanethiol complex leading to a color “turn-on” of the parent squaraine. It was found that untreated samples obtained directly from Suzuki couplings showed no response to the assay. However, treatment of the samples with aqueous nitric acid generates a uniform Pd(NO3)2 species, which gives an appropriate response. “Naked-eye” detection of Pd(NO3)2 was estimated to be as low as 0.5 ppm in solution, and instrument-based detection was tested as low as 100 ppb. The average error over the working range of the assay was determined to be 7%.
1. Introduction
Palladium complexes represent some of the more useful facilitators of organic transformations known. Palladium(II) salts, such as PdCl2,1 Pd(OAc)2 2 and PdCl2(PPh3)2, 3 are predominantly used as oxidizing reagents, as well as precatalysts for cross-coupling reactions. The wide array of commonly used reactions catalyzed by these complexes,4 such as Suzuki, Heck, and aromatic amination reactions, are processes that would otherwise be infeasible or impractical. Many of these methodologies are widely utilized in pharmaceutical research and development for the discovery and production of drugs.5 However, governmental restrictions on the levels of residual heavy metals in end products are very strict. Typical contamination levels of palladium remaining in the organic phase after experimental work up range from 5 to 100 ppm.4 Due to its utility as well as its inherent stickiness, palladium poses a difficult challenge both for its detection and removal. The most popular current method for detecting the presence of such metals utilizes ICP-MS to vaporize the metal ions and obtain a quantitative mass spectrum. Though very precise even in the ppt and ppq range, the instruments are somewhat expensive to run, and the need for highly acidic samples in palladium detection tends to corrode the cones faster than normal. Hence, new, milder methods for the sensitive detection of trace palladium are desirable.
Exploitation of reversible covalent bond formation for use as a tool in the detection of analytical targets has become an area of much interest in the last few years.6 Of particular interest to the research presented in this paper are a class of organic dyes known as squaraines, which have been shown to undergo a decolorizing electrophilic addition from nucleophiles such as cyanide and various thiols.7, 8 Squaraines, such as SQ1 shown in Scheme 1, represent a unique class of organic dyes with a peculiar electronic structure, which gives rise to strong intramolecular charge transfer character in both the ground and excited states.9 These charge transfer states lead to strong, sharp absorption in the long visible and near IR spectrum giving squaraines an intense blue color. The electronic structure of the central four-membered ring can be described as a cyclobutadienyl dication. The two electrons in the aromatic dication reside as a singlet in a single low energy molecular orbital. Since Lewis structures are insufficient to convey this situation, resonance forms similar to that shown in Scheme 1 are often used. Upon addition of a nucleophile to this electron deficient ring, the charge transfer is disrupted, and the complex is effectively decolorized.
Scheme 1.
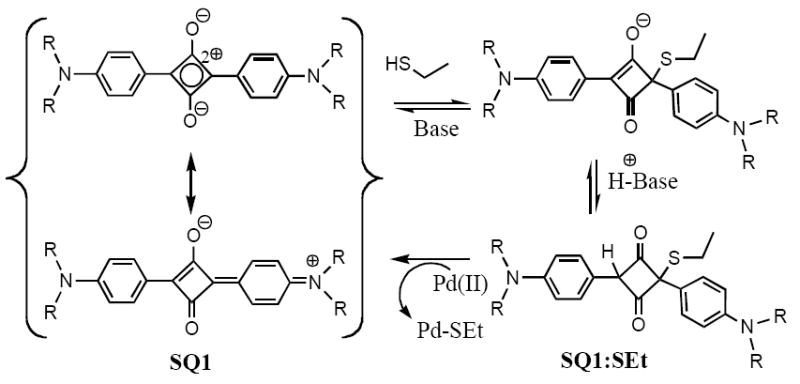
Decolorization of SQ1 with ethanethiol followed by palladium(II) scavenging.
Based on the work using thiols, we postulated that a sufficiently thiophilic metal, such as palladium, would be capable of scavenging the thiol. With the thiol removed, the conjugation and charge transfer (CT) character of the parent squaraine would be restored (Scheme 1). Concurrent with our work in this area, Soto and coworkers reported a similar system for the selective detection of mercury in aqueous media.10 Whereas Soto’s work shows selectivity for mercury in aqueous solutions, our own work in organic media suggests that little selectivity among heavy metal(II) salts is achieved. Preliminary results show that the current method is sensitive not only to Pd(II) but also several other commonly used transition metals such as tin and common pollutants such as lead, cadmium, and of course mercury. For the application we envision, however, the lack of specificity will not be detrimental, as generally only one or two different metals will be present in a sample taken from a pharmaceutical process plant. Herein, we report the development of a simple colorimetric chemodosimeter assay using UV-Visible spectroscopy and the “naked eye” to detect Pd(II) levels in contaminated products of cross-coupling reactions.11
2. Results and Discussion
2.1 Understanding the SQ1:SEt Complexation
Though several reports have now been published on the interactions of squaraines with various nucleophiles, very little is known about the affinity of the nucleophile-squaraine interaction.7, 8, 12 Since work with cyanide anions and thiols, the interaction was perceived to be complete and not at equilibrium. However, this study has found that in organic media, this “dosimetric” system is dynamic and has equilibrium-like properties. Thus, an understanding of this equilibrium is of considerable importance.
2.1.1 1H-NMR Studies
We conducted a series of 1H-NMR spectroscopic studies to fully characterize the nucleophilic addition of the thiol to the central four-membered ring (see Supporting Information). These studies, as well as those previously reported literature, have shown that squaraine molecules desymmeterize upon the addition of nucleophiles (Figure 1).12 The * and + signs show the desymmetrization after the addition of one equivalent of ethane thiol. For the conditions to be optimal for the nucleophilic attack in chloroform a base was added to facilitate deprotonation of the thiol for greater nucleophilicity. In these preliminary studies, the base 1,8-diazabicyclo[5.4.0]undec-7-ene (DBU) was employed.
Figure 1.
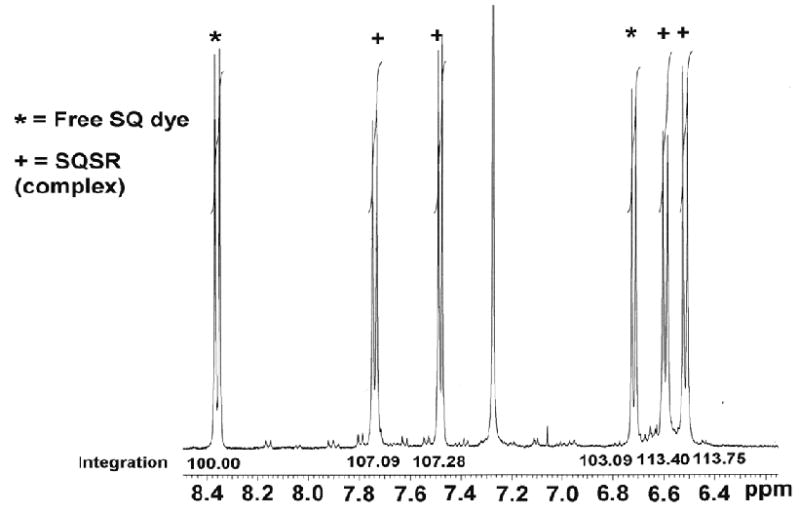
1H-NMR of SQ1 with ethanethiol in the presence of DBU in CHCl3-d. [SQ1]0 = 37 mM; [DBU]0 = 37 mM; [EtSH]0 = 185 mM.
2.1.2 Van’t Hoff Analysis
Further studies on the thermodynamics of the SQ1:SEt complex were carried out through the use of van’t Hoff techniques. A van’t Hoff analysis garners a plot of lnKeq versus 1/T, which gives ΔH° from the slope of the graph and ΔS° from the intercept. In this case, SQ1:SEt was first generated by reaction of 1 equivalent each of SQ1 and ethanethiol in DMSO facilitated by 0.75 equivalents of the base 2,8,9-trimethyl-2,5,8,9-tetraaza-1-phosphabicyclo[3.3.3]undecane, VB (a Verkade base).

The use of this base and its stoichiometry, rather than DBU, will be discussed in more detail below. The absorbance of unbound SQ1 was measured at regularly increasing temperature from 288.5 K to 317.8 K to monitor the change in the complex formation (Figure 2). Higher temperatures were not used due to the low boiling point of ethanethiol.
Figure 2.
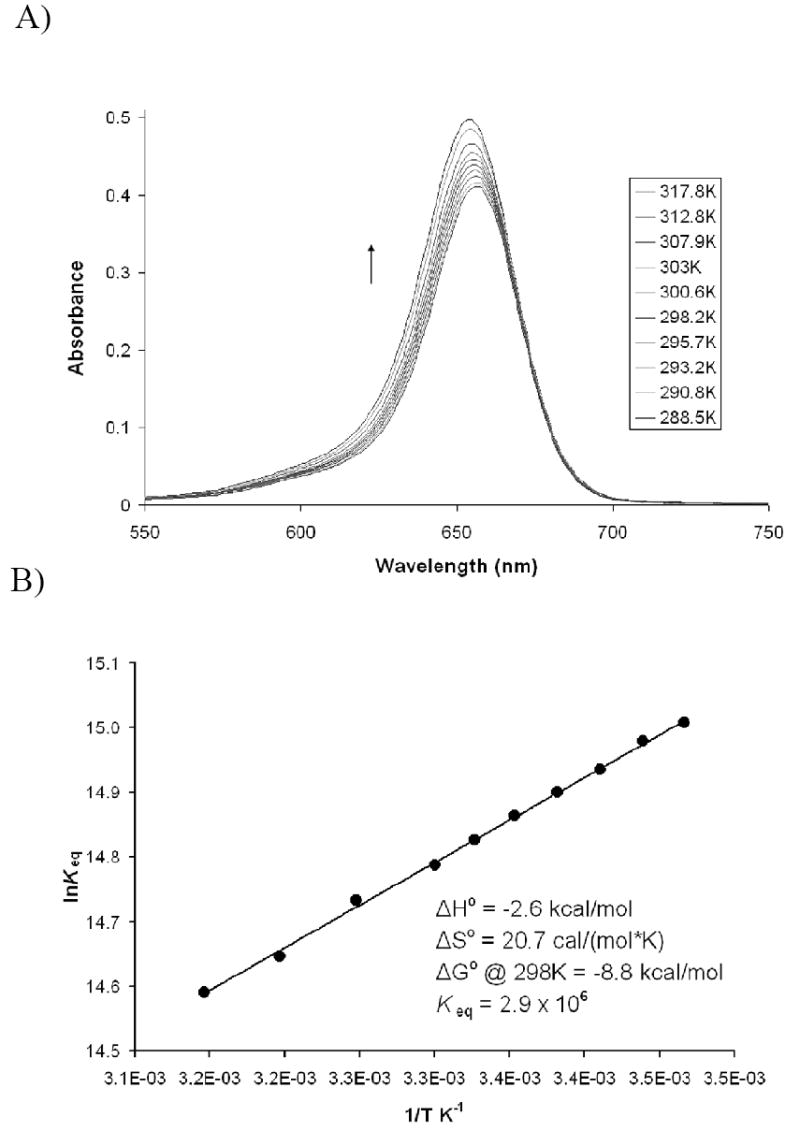
Van’t Hoff analysis of SQ1:SEt at 1.2 × 10⁻⁵ M. A) Spectral data of free SQ1 at tempuratures from 288.5 K to 317.8 B) van’t Hoff plot of lnKeq vs. 1/T.
The temperature dependent equilibrium constants were derived as follows. The concentration of free SQ1 was calculated from the absorbance at 656 nm based on its extinction coefficient. The bound complex SQ1:SEt and free thiol concentrations were extrapolated from the concentration of free SQ1 assuming a 1:1 association of thiol with the squaraine (confirmed from the 1H-NMR spectroscopic studies, see Figure 1 and supplementary material). With these concentrations the equilibrium constants at each temperature could be calculated as Keq = [SQ1:SEt]/([SQ1][RSH]). The plot of the natural log of these values versus 1/T gives the plot shown in Figure 2B. The ΔH° determined from the slope of the van’t Hoff plot was found to be -2.6 kcal/mol whereas ΔS° taken from the intercept is 20.7 cal mol-1K-1. Thus at 298 K, this association is primarily entropy driven, with TΔS° contributing 6.2 kcal/mol versus only -2.6 kcal/mol from the enthalpy term. The overall ΔG° at 298 K is -8.8 kcal/mol with an association constant of 2.9 × 10⁶ M-1. Solvation effects are commonly applied to explain entropy complexations.13
Mixed solvent studies on squaraines with non-complexing and complexing solvents have shown that at high concentrations of the coordinating solvent, a preferential solvation phenomenon occurred in which a 2:1 or 3:1 solvent-solute complex are forming.14 Hence, if the introduction of a nucleophile to the electron deficient core of SQ1 serves to break up a solvent-solute complex, the solvent release upon binding would be more entropically favorable than the cost of bringing the squaraine and the nucleophile together. It is also reasonable to imagine that the formation of this bond would not be greatly enthalpically favorable. The bond dissociation energies of C-S single bonds are generally quite low, usually less than 75 kcal/mol, compared even to aliphatic S-H bonds which are usually around 83 kcal/mol.15 Couple these effects with the decrease in conjugation and charge transfer interactions that accompany the formation of SQ1:SEt; it becomes clear that any enthalpic gain in this reaction would be low. Of course, the equilibria constants involved in the Van’t Hoff also involves proton transfer to the from the thiol to the base, and this reaction will influence the entropy of the reaction. Perhaps the most striking observation is how rare it is to find entropically driven associations in supposedly non-competitive media such as DMSO.13
2.2 Pd(II) Determination
Based on the Beer’s Law and van’t Hoff analyses, in order to keep the absorbance intensity within the limits of Beer’s Law, the total concentration of SQ1 both bound and unbound should be less than 10-5 M. Initial studies were conducted in a DMSO-based solution containing a small amount of chloroform for squaraine solubility purposes. As before, the SQ1:SEt complex was prepared by allowing a thiol (ethanethiol) to react with a solution of SQ1 in a one-to-one ratio in the presence of a suitable base (DBU) to prepare a complex in situ that had a concentration of 47 μM. Upon completion of the reaction, the absorbance at 656 nm is greatly reduced or “switched off”. Under these conditions, formation of SQ1:SEt is kinetically slow and takes approximately 24 hours to come to equilibrium. The SQ1:SEt complex must be formed prior to Pd(II) analysis and can be stored for use. When stored in the dark, the solution is stable for roughly 48 hours and is able to retain a reproducible response to Pd(II).
2.2.1 UV-Vis Titrations
Two palladium salts were used in the initial study. Pd(OAc)2 and PdCl2(PPh3)2 were chosen due to their extensive use in cross-coupling reactions. Titrations of both palladium species into solutions of SQ1:SEt formed with DBU are shown in Figure 3 and Figure 4.
Figure 3.
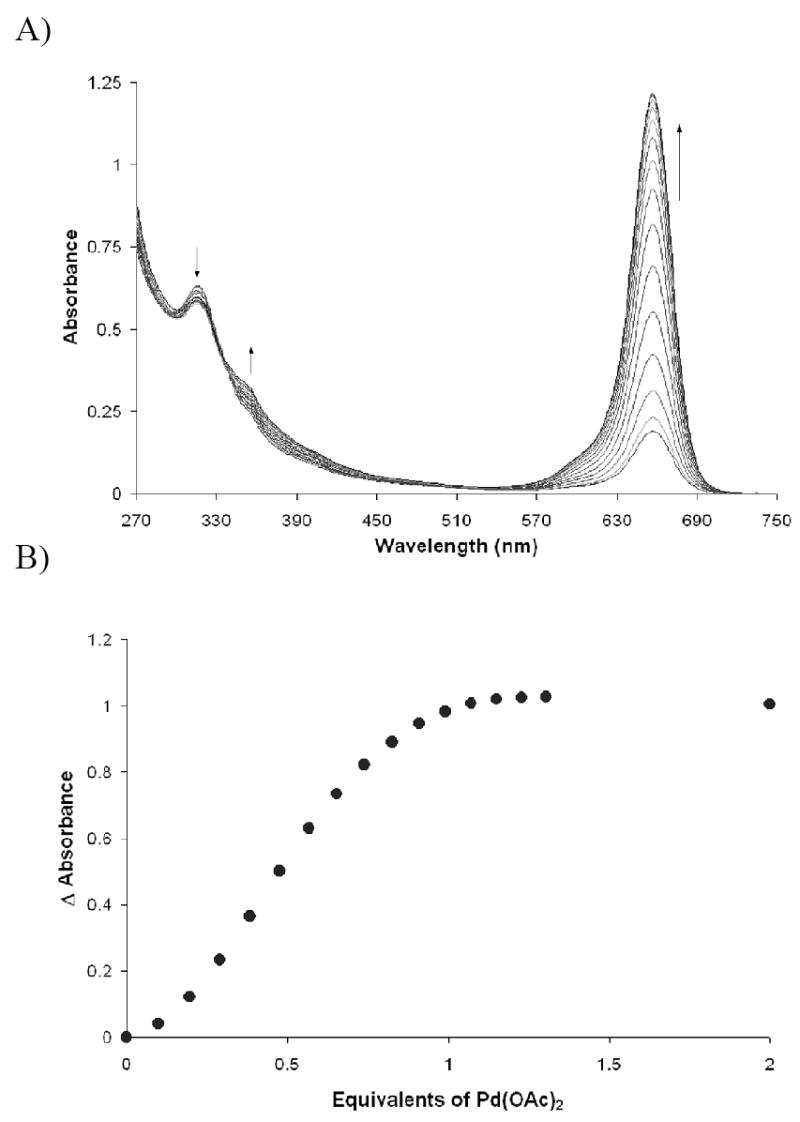
Titration of Pd(OAc)2 into a solution of SQ1:SEt at 2.35 × 10⁻⁵ M in DMSO. SQ1:SEt complexation was facilitated with 1 equivalent of ethanethiol and 2 equivalents of DBU.
Figure 4.
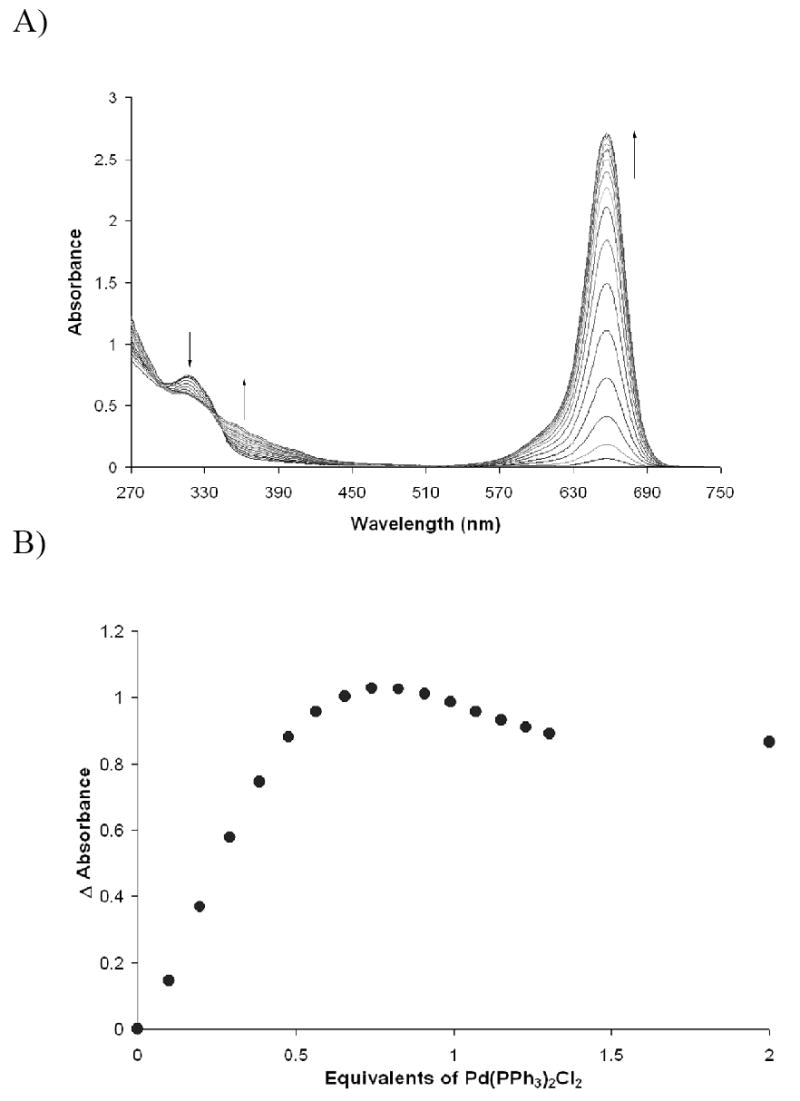
Titration of Pd(PPh3)2Cl2 into a solution of SQ1:SEt at 2.35 × 10⁻⁵ M in DMSO. SQ1:SEt complexation was facilitated with 1 equivalent of ethanethiol and 2 equivalents of DBU
Upon the addition of the palladium(II) salts, the band at 317 nm decreases and the band at 656 nm increases, switching “on” the color. An isosbestic point is observed near 344 nm indicating the interconversion of two distinct species. The isotherms obtained for the titration experiments are sigmoidal in shape at low Pd(II) concentrations because at equilibrium, thiol complexation to the squaraine is not complete. Thus, small amounts of uncomplexed thiol exist in solution, and the initial palladium that is added binds first to the “free” thiol. Once the free thiol has been bound the remaining palladium then scavenges thiol away from the SQ1:SEt complex and turns on the colorimetric response. The saturation at one equivalent of palladium, evident in Figure 3A, suggests that the species responsible for the absorbance at 373 nm is a monothiolated palladium species.
Interestingly, the isotherm for the Pd(PPh3)2Cl2 does not plateau but instead a slight decrease in absorbance is seen at 656 nm as more Pd(II) salt was added. The formation of a covalent Pd-S bond liberates a chloride anion. However, from previous studies on nucleophilic addition to squaraines, the probability that this chloride is responsible for the subsequent “re-quenching” of SQ1 is small.8
A more likely scenario is that the formation of the Pd-S bond significantly reduces the electrophilicity of the Pd center causing one or both of the triphenylphosphine ligands to dissociate. The PPh3 group is thus indirectly displaced by the thiol is itself nucleophilic and attacks the electron deficient 4-membered ring system of SQ1. This result was confirmed by preparing a solution of SQ1 and adding one equivalent of PPh3 with the observation of a color “turn-off”. The ultimate sensitivity for these two Pd(II) salts using this method was roughly 10-6 M.
2.3 Testing Unknowns
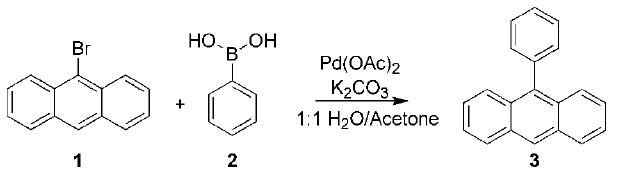
It was apparent that this system could be used to quantitatively detect Pd(II) salts. In order to test the viability of the system, calibration curves were first created using several solutions containing known quantities of Pd(OAc)2. To perform real sample tests, several Suzuki coupling reactions were run as shown in Scheme 2. The Suzuki coupling was chosen because it uses the palladium(II) acetate precatalyst and a non-nucleophilic carbonate base. When aliquots were taken directly from the reaction and administered to the SQ1:SEt solutions, the result was a moderate turn-on of the 656 nm band corresponding to free SQ1 (see Supporting Information.) However, the calculated concentration did not match well with the calibration curve. Furthermore, administration of samples taken from the quenched or worked up Suzuki reaction showed no turn-on at all.
Scheme 2.
During the course of a palladium catalyzed reaction, much of the palladium is converted to Pd(0), and upon quenching, all remaining active catalyst is either precipitated as palladium black or tied up in bulky, intractable ligands created during the reaction. These palladium species would be insoluble and therefore undetectable by this chemodosimeter. Our remedy to this problem was to generate a uniform Pd(II) species via oxidation or ligand exchange with nitric acid to form the highly soluble nitrate salt. To characterize an assay for use with nitric acid digested samples, several titrations were performed with Pd(NO3)2.
2.3 Pd(NO3)2 Characterization
Initially, the SQ1:SEt complex was formed as described above using a 1:9 v/v chloroform:DMSO solvent mixture in the presence of 2 equivalents of DBU. The titration of Pd(NO3)2 into a 24 μM solution of SQ1:SEt is shown in Figure 5. Interestingly, saturation occurred at 0.5 equivalents of palladium(II) nitrate suggesting a 2:1 thiolate:palladium interaction. Initially, we attributed this result to the increased electrophilicity of the nitrated palladium center. However, upon further review of the spectral data, we observed that full turn on of SQ1 was not achieved even after reaching saturation. A plot of the calculated concentration of SQ1 from absorbance at 635 nm (ε ≈ 99,000) versus the concentration of palladium(II) added should have a slope of 2 based on the saturation point of the titration and a 2:1 stoichiometry. However, the slope was found to be 1 suggesting 1:1 binding. In fact, extrapolation of the initial slope on the isotherm in Figure 5 (dotted line) to the point at which full turn on is predicted by the extinction coefficient (dotted-dashed line) gives 1:1 binding.
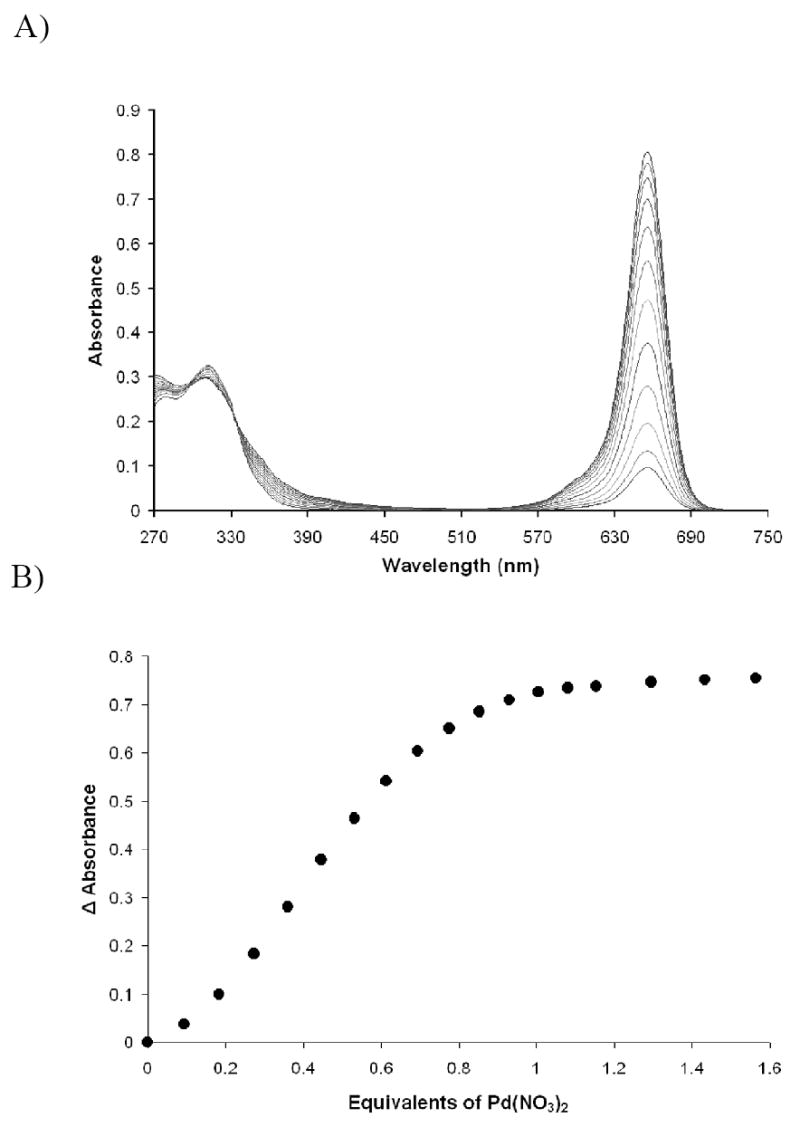
Figure 5.
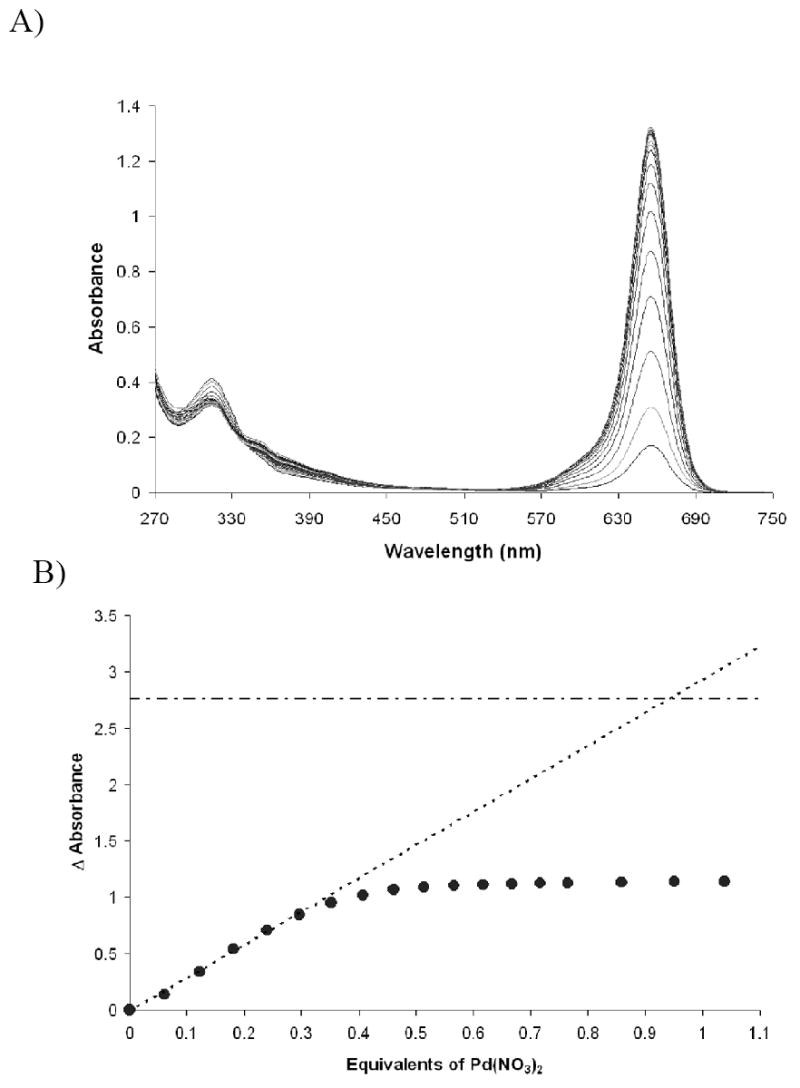
Titration data for Pd(NO3)2 into SQ1:SEt (1.18 × 10⁻⁵ M in DMSO) formed with ethanethiol and 2 equivalents DBU. A) Spectra. B) Isotherm showing apparent 2:1 thiol:palladium interaction. Dotted line—extrapolation of initial slope; dotted and dashed line—absorbance at full recovery.
To solve this quandary, we re-evaluated the choice of base, DBU, and discovered that we had made a poor selection. In aqueous solution, the pKa of H-DBU+ is roughly 12, and that of a typical aliphatic thiol is close to 10.16 Hence, in water DBU is a suitable base to produce the thiolate anion. However, the polar aprotic environment of DMSO drastically changes this relationship. In the cationophilic DMSO medium, the pKa of H+-DBU does not differ very much from that in water; however, the pKa of a thiol is dramatically increased to near 18.17
Thus, with DBU in DMSO, the complex formation occurs either by general base catalysis or involves an exceedingly low concentration of preformed thiolate anion. This revelation explains why the complex formation was kinetically slow under these conditions. In addition to being inadequate as a base, it was also discerned that DBU was too nucleophilic, and when added to SQ1 in excess (4+ equivalents), fairly rapid decolorization ensued. Our first instinct then, led us to assume that the discrepancy between the saturation isotherm and the Beer’s Law equivalency arose from these non-optimal properties of DBU.
2.4 The Verkade Base
To resolve both the basicity and nucleophilicity issues we turned to the so-called “super bases.” In particular, we chose the tricyclic phosphatrane base, VB also known as a Verkade base.18 Reported to have a protonated pKa of 26.8 in DMSO, VB is basic enough to deprotonate an aliphatic thiol in DMSO.19 Several tests were conducted to determine the best ratio of base to thiol to achieve both facile complex formation and full recovery of SQ1 upon introduction of analytes. Using 0.75 equivalents of VB gave the best results upon addition of Pd(NO3)2. Scheme 1 above shows the equilibrium between two possible forms of the SQ1:SEt complex. VB is able to facilitate this equilibrium because its pKa lies between that of the thiol and the carbon acid shown. Hence, using a substoichiometric amount of VB helps to drive the complex formation forward. This stoichiometry was also advantageous in that full recovery of the parent squaraine was achievable if the SQ1:SEt complex was given four hours to equilibrate. A typical titration using this method is shown in Figure 6. For this new system, titrations were performed at a lower concentration of SQ1:SEt (8.8 × 10⁻⁶ M) to maintain Beer’s Law linearity over the complete titration range. In addition to the expected full recovery of SQ1 absorbance after a four hour SQ1:SEt equilibration time, a return to 1:1 Pd(II) to thiol binding was observed. Yet, as now described, the most accurate Pd(II) sensing system is achieved after allowing an even longer equilibration time for SQ1, thiol, and base.
Figure 6.
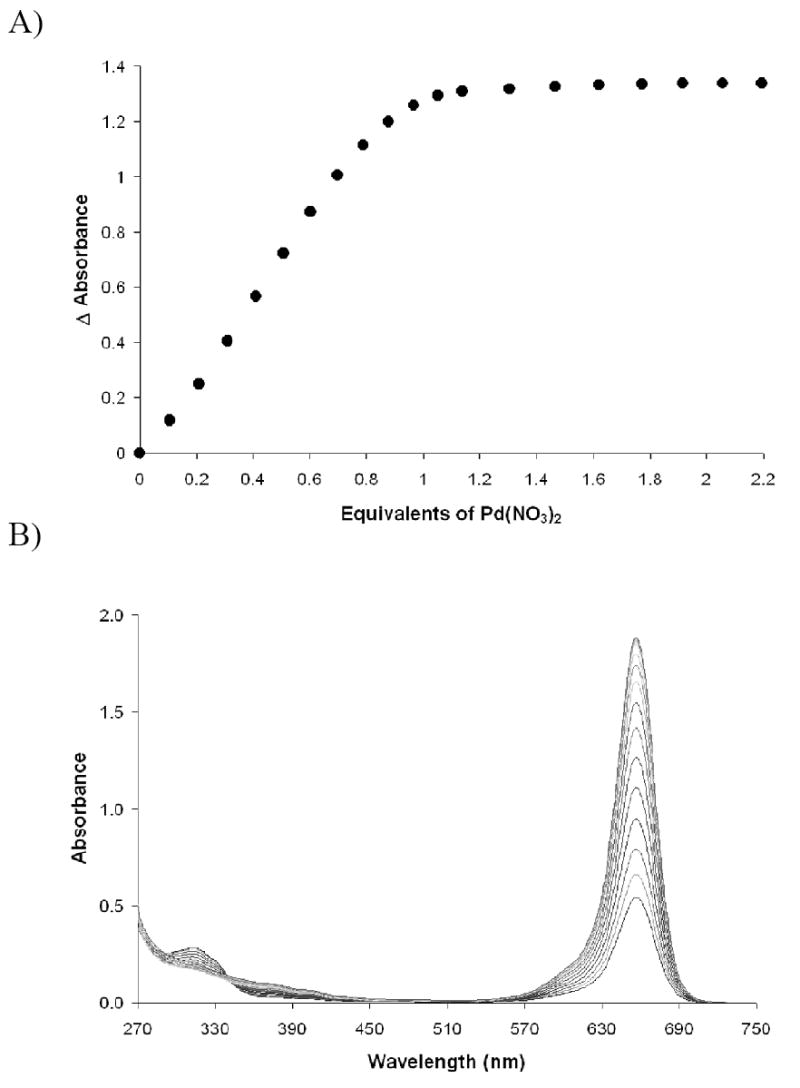
Titration of Pd(NO3)2 into 8.8 × 10⁻⁶ M SQ1:SEt in DMSO formulated with ethanethiol and Verkade base VB. Titration was conducted after 4 hours reaction time between squaraine SQ1 and ethanethiol.
If the SQ1, VB, and ethanethiol mixture was allowed to come to full equilibrium over a 12-15 hour period, the Pd(NO3)2 titration data were the most stable from trial to trial. However, longer equilibration time led to a slightly lower color recovery and a slightly less than 1:1 thiol:palladium stoichiometry (approximately 0.9:1.) Figure 7 gives typical Pd(II) titration data with the Verkade system in DMSO when the titration is performed after allowing 12-15 hours for the formation of the SQ1:SEt complex.
Figure 7.
Titration of Pd(NO3)2 into 8.8 × 10⁻⁶ M SQ1:SEt in DMSO formulated with ethanethiol and Verkade base VB. Titrations were conducted after 12-15 hours reaction time between squaraine SQ1 and ethanethiol
2.5 Calibration Curves for DMSO-Verkade System
Samples of known Pd(NO3)2 concentration were prepared and tested against the titration data to determine its usefulness as a calibration curve for unknown samples. Unfortunately, in all cases using a 5 minute wait period between sample injection and measurement, the samples tested fell short of their theoretical turn on quantity. The discrepancies between the titration data and the known Pd(II) samples arises from a kinetic effect. Throughout the course of a titration such as the one shown in Figure 7, each aliquot of Pd(NO3)2 injected is given a 5 minute interval, during which equilibration was found to be achieved because with each data point in a titration, only a small shift in equilibrium occurs. While the titration data is a good measure of the overall turn on one should expect, when applied to a sample with an intermediate concentration, a longer time is needed because a larger shift in the equilibrium is occurring
To better understand the time required to allow equilibration with Pd(NO3)2 at intermediate concentrations, we turned to time course plots. For this determination, several Pd(NO3)2 samples of increasing concentration were assigned fresh solutions of complexed SQ1:SEt, and upon injection of a 20 μL aliquot of the Pd(II) sample, the color turn on was monitored over time at 656 nm. The normalized kinetic traces are shown in Figure 8. As expected, the time to full equilibrium was found to increase as the concentration of Pd(II) increased until saturation is achieved. The inset in Figure 8 shows the region at which the traces reach the half-time to full turn on. The line drawn at 0.5 normalized absorbance units in the inset shows that as the concentration of the Pd(II) sample increases, the half-time to completion becomes steadily longer until the isotherm of maximum absorbance reaches saturation. Past this saturation point, the half-time stabilizes briefly then begins to decrease because increasing palladium concentration increases the rate at which the system achieves equilibrium. Over the concentration range tested (0.1-1.5 × 10⁻⁵ M Pd(NO3)2), full equilibration times ranged from 2.5 to 15.5 minutes, while the half-times ranged from 5 to 84 seconds. The traces shown in red are those of samples containing greater than 1 equivalent of Pd(II) and show a quickening trend. Since a large concentration range gives a regular increase in the half-time to reaction completion, the implication is that for unknown samples containing less than a full equivalency of palladium, the half-time to full turn on could be used as a secondary validation in concentration determination.
Figure 8.
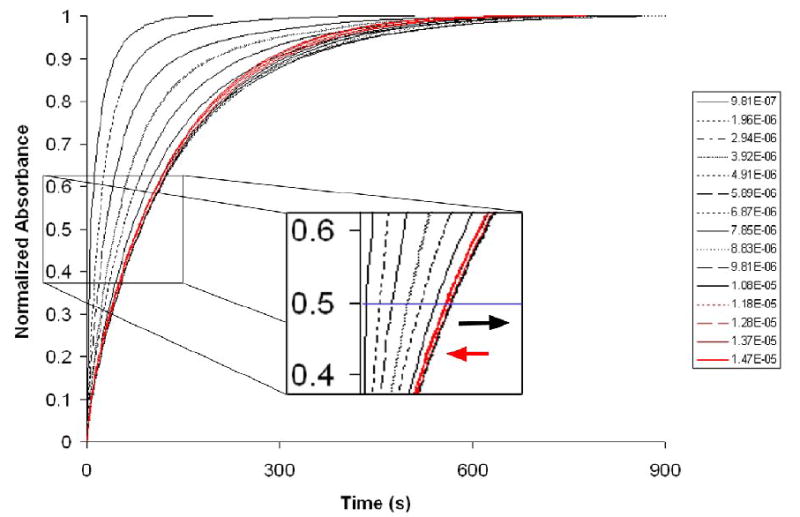
A) Normalized kinetic traces of calibration curve data using a series of samples of increasing palladium concentration. Below 1 equivalent shown in black, above shown in red. The inset shows the half-time. [SQ1:SEt] = 1.2 × 10⁻⁵; [Pd] range = 9 × 10⁻⁷ to 1.5 × 10⁻⁵
This understanding of the kinetic exchange of the thiol between the squaraine core and the palladium analyte allows one to perform a more accurate titration for calibration purposes by allowing for the full equilibration to occur between each point as well as during real sample testing. This means, that at a minimum, approximately fifteen minutes should be given before reading the Pd(II) concentration. To test this equilibration method, a calibration curve was created just prior to determinations of several arbitrary samples of known palladium concentration, and samples taken from the cross-coupling reaction of Scheme 2. The injections, both during the generation of the calibration curve, and the analysis of the unknowns, were allowed to equilibrate for 15 minutes. The isotherm derived from titration is shown in Figure 9. The sigmoidal Richards type 1 curve fit analysis is shown and has a high degree of fidelity.
Figure 9.

Isotherm and curve fit of kinetically monitored titration. Isotherm was fit using a sigmoidal Richards type 1 function with the Origin graphing software.
Two determinations were conducted at each unknown sample concentration, and the absorbance values were then applied to the function derived from the curve fit of the isotherm. Table 1 shows that in this fashion, the average error over the concentration range tested was 7%. At low concentrations, the error tended to be low, whereas higher concentrations led to over estimation. However, the extent of the error is fairly uniform with an average relative deviation of roughly 4%. Furthermore, based on these determinations, colorimetric detection of palladium as low as 105 ± 7 ppb in DMSO solution has been reliably performed.
Table 1.
Data for arbitrary known samples tested against a fully equilibrated titration isotherm of SQ1:SEt. [SQ1:SEt] = 1.17 × 10⁻⁵ M
| Sample | Known [Pd] | [Derived #1] | [Derived #2] | Average %Error |
|---|---|---|---|---|
| 1 | 1.62E-06 | 1.62E-06 | 1.48E-06 | 4.6 |
| 2 | 2.70E-06 | 2.87E-06 | 2.58E-06 | 5.3 |
| 3 | 4.33E-06 | 4.74E-06 | 4.51E-06 | 6.8 |
| 4 | 6.49E-06 | 7.36E-06 | 7.07E-06 | 11.1 |
|
| ||||
| Average Error | 6.9 | |||
|
| ||||
| Average Relative Deviation | 3.6 | |||
3. Conclusions
In conclusion, we have developed a sensitive chemodosimeter for palladium(II) using the highly chromogenic squaraine class of organic dyes. Thermodynamic analysis of the interaction of the thiol nucleophile with the squaraine dye shows a unique entropically driven association to form the decolorized complex in DMSO. We attribute this anomalous behavior to the release of a highly ordered solute-solvent complex upon addition of the thiol. Though similar thiol-squaraine systems have shown selectivity for mercury in aqueous media, the extension of this methodology into organic media has allowed for response to other thiophilic metals. Through careful consideration of many different aspects, calibration of this system has been achieved for palladium, with detection tested as low as 100 ppb. Though our focus has been on palladium due to its wide range of uses in organic synthesis, preliminary observations have suggested the system could be useful for determination of other metals such as cadmium, tin, and lead, as well as others.
4. Experimental
4.1 General
1H and 13C NMR spectra were recorded on a Varian Unity Plus 300 MHz spectrometer in CHCl3-d. All spectra are recorded at ambient temperatures. UV-Vis experiments were performed on Beckman DU-70 and DU-800 UV-Vis spectrophotometrs. Low and High-resolution mass spectra were measured with a Finnigan TSQ70 and VG Analytical ZAB2-E instruments, respectively. Compound SQ1 was synthesized according to the reference method (see Supporting Information).20 All chemicals and reagents where brought from Aldrich or Fluka and used without further purification. DMSO was degassed via displacement with N2 and dried over molecular sieves for at least 6 hours prior to use. Dilutions and aliquots were performed using FisherBrand Finnpipette autopipets calibrated by mass.
4.1.1 UV-Vis Titrations in DMSO with DBU
A stock solution of SQ1 (6.0 × 10⁻⁴ M) was prepared by dissolving SQ1 (3 mg, 6 μmol) in 10 mL 1:9 CHCl3/DMSO. This stock solution was then used to prepare a 4.7 × 10⁻⁵ M solution of SQ1 using pure DMSO. A separate stock solution of ethanethiol (2.7 × 10⁻³ M) and (2 eq. of DBU) was also prepared in pure DMSO. This second solution was then used to prepare a 4.7 × 10⁻⁵ M solution of ethanethiol. Equal volumes (2 mL) were added together and left for 24 hours to form a theoretical 2.35 × 10⁻⁵ M solution of SQ1:SEt. A 1 mL aliquot of the SQ1:SEt complex was transferred to the UV-Vis cuvet. A separate solution of the Pd(II) salts where prepared at 10 times palladium concentration and 10 μL aliquots were added and the spectrum was recorded 5 minutes after each aliquot injection.
4.1.2 UV-Vis Titrations in DMSO with Verkade Base
A 4.7 × 10⁻⁵ M solution of SQ1 was prepared in DMSO analogously to the previous method. A separate solution of 4.7 × 10⁻⁵ M ethanethiol and 0.75 eq (3.53 × 10⁻⁵ M) 3.31 was also prepared. Complex SQ1:SEt formation was achieved by combining 1 part each of the above solutions with 2 parts DMSO. The resulting concentrations of SQ1 and ethanethiol were each 1.18 × 10⁻⁵ M. Decolorization proceeded quickly, though the solution was allowed to come to equilibrium for 12-15 hours prior to use. The complex thus prepared and stored over molecular sieves was stable for titration use up to 48 hours.
The palladium(II) nitrate titrant solution was prepared by dilution of 2.5 mg of Pd(NO3)2·2H2O in 10 mL DMSO. 100 μL of this solution is combined with 750 μL of the SQ1:SEt complex solution and 150 μL DMSO to give a 1 mL solution containing roughly 10 eq. of Pd(II) to squaraine. A standard, quartz, 3 mL volume, 1 cm pathlength UV-Vis cuvet was charged with 750 μL of the 1.18 × 10⁻⁵ M solution of SQ1:SEt and 250 μL DMSO giving a final concentration of 8.82 × 10⁻⁶ M. The titration was performed by administering successive 10 μL aliquots of the Pd(II) solution.
4.1.3 van’t Hoff Analysis
500 μL of the above prepared solution of SQ1:SEt with the Verkade base and 500 μL DMSO were placed in a standard 1 cm pathlength cuvet. UV-Vis spectra were collected upon equilibration of the SQ1:SEt at iteratively increasing temperatures. The temperature was set using a built in Peltier apparatus and independently monitored in cuvet using a FisherBrand digital K-thermocouple. The absorbance readings at 656 nm and 635 nm were used for separate determinations of the thermodynamic parameters.
4.1.4 Kinetics and Calibration Curve Determination (Figure 2)
SQ1:SEt solutions were prepared as described in the titrations. 4 mg Pd(NO3)2 was dissolved 10 mL DMSO to give a 1.5 × 10⁻³ M solution. 15 vials labeled 1-15 were given 10 μL-increasing amounts of the Pd(II) stock solution such that vial 1 contained 10 μL and vial 15 contained 150 μL. The vials were then charged with DMSO to bring the total volume in each vial to 150 μL. Directly before each kinetics determination, each vial was charged with 150 μL of the SQ1:SEt solution to give a total volume of 300 μL and SQ1:SEt concentration 1.2 × 10⁻⁵ M. Directly before each kinetics determination, each vial was charged with 250 μL of the prepared SQ1:SEt solution to give a total volume of 500 μL and concentration of SQ1:SEt of 1.2 × 10⁻⁵ M.
The cuvet was charged with 500 μL of the SQ1:SEt solution and 500 μL of DMSO to give 1.2 × 10⁻⁵ M solutions of SQ1:SEt. The UV-Vis sample holder was kept at a constant temperature of 25 °C by a built-in Peltier apparatus. Once the sample had equilibrated to temperature (5-10 minutes depending on ambient temperature), an initial wavelength scan was collected. The UV-Vis was then switched into kinetics mode and set to acquire. A timer set to count down 5 seconds was on hand. A 20 μL aliquot of the vial being sampled was injected into the cuvet while simultaneously starting the 5 second timer. The cuvet was shaken vigorously to mix and replaced in the cell holder within the 5 second countdown. The kinetics collection at 656 nm was started at the completion of the 5 second countdown and the absorption was monitored until it leveled off. Upon completion, another wavelength scan was collected for verification of the final absorbance value. The kinetic traces were then normalized such that the maximum absorbance was set equal to 1. Five seconds was added to the start of the trace to account for the time from injection to the start of data collection.
Supplementary Material
Synthesis and purification of SQ1, Beer’s Law analysis of SQ1, 1H-NMR titration analysis of SQ1-ethanethiol interaction. This material is available free of charge via the Internet at http://pubs.acs.org
Acknowledgments
We thank Chris Welch of Merck Pharmaceuticals for many helpful discussions. Funding for this research was provided by Merck Pharmaceuticals, the Welch Foundation (F-1151), and the NIH (GM077437).
Footnotes
Publisher's Disclaimer: This is a PDF file of an unedited manuscript that has been accepted for publication. As a service to our customers we are providing this early version of the manuscript. The manuscript will undergo copyediting, typesetting, and review of the resulting proof before it is published in its final citable form. Please note that during the production process errors may be discovered which could affect the content, and all legal disclaimers that apply to the journal pertain.
References
- 1.Liesen PJ, Varma RS, Naicker KP. Tetrahedron Lett. 1999;40:2075–2078. [Google Scholar]
- 2.Liu W-J, Xie Y-X, Liang Y, Li J-H. Synthesis. 2006:860–864. [Google Scholar]
- 3.Baxter JM, Steinhuebel D, Palucki M, Davies IW. Org Lett. 2005;7:215–218. doi: 10.1021/ol047854z. [DOI] [PubMed] [Google Scholar]
- 4.Buchwald SL, Mauger C, Mignani G, Scholzc U. Adv Synth Catal. 2006;348:23–39. [Google Scholar]
- 5.Arvela Riina K, Leadbeater NE, Collins Michael J., J Tetrahedron. 2005;61:9349–9355. [Google Scholar]
- 6.Mohr GG. Sensors and Actuators B. 2005;107:2–13. [Google Scholar]
- 7.Ros-Lis JV, Garcia B, Jimenez D, Martinez-Manez R, Sancenon F, Soto J, Gonzalvo F, Valldecabres MC. J Am Chem Soc. 2004;126:4064–4065. doi: 10.1021/ja031987i. [DOI] [PubMed] [Google Scholar]
- 8.Ros-Lis JV, Martinez-Manez R, Soto J. Chem Commun. 2002;2248:2249. doi: 10.1039/b206500b. [DOI] [PubMed] [Google Scholar]
- 9.Bigelow RW, Freund HJ. Chem Phys. 1986;107:159–174. [Google Scholar]
- 10.Ros-Lis JV, Marcos MD, Martinez-Manez R, Rurack K, Soto J. Angew Chem Int Ed. 2005;44:4405–4407. doi: 10.1002/anie.200500583. [DOI] [PubMed] [Google Scholar]
- 11.Optical sensors for Pd(II) are rare, but for two examples see Lee DYK, Lam MHW, Wong W-Y. New J Chem. 2002;26:330–335.Song F, Garner AL, Koide K. J Am Chem Soc. 2007 doi: 10.1021/ja073910q. in press.
- 12.Ros-Lis JV, Martinez-Manez R, Rurack K, Sancenon F, Soto J, Spieles M. Inorg Chem. 2004;43:5183–5185. doi: 10.1021/ic049422q. [DOI] [PubMed] [Google Scholar]
- 13.Schmidtchen FP. Coord Chem Rev. 2006;250:2918–2928. [Google Scholar]
- 14.Law KY. J Phys Chem. 1987;91:5184–5193. [Google Scholar]
- 15.CRC Handbook of Chemistry and Physics. 76. CRC Press; Boca Raton: 1995. pp. 9pp. 65–66. [Google Scholar]
- 16.Gordon AJ, Ford RA. The Chemist’s Companion. John Wiley and Sons Inc; New York: 1972. pp. 57–59. [Google Scholar]
- 17.Chrisment J, Nicole D, Delpuech JJ. Comptes Rendus des Seances de l’Academie des Sciences, Serie C: Sciences Chimiques. 1978;286:541–4. [Google Scholar]
- 18.Lensink C, Xi SK, Daniels LM, Verkade JG. J Am Chem Soc. 1989;111:3478–9. [Google Scholar]
- 19.Laramay MAH, Verkade JG. J Am Chem Soc. 1990;112:9421–2. [Google Scholar]
- 20.Tian M, Furuki M, Iwasa I, Sato Y, Pu LS, Tatsuura S. Journal of Physical Chemistry B. 2002;106:4370–4376. [Google Scholar]
Associated Data
This section collects any data citations, data availability statements, or supplementary materials included in this article.
Supplementary Materials
Synthesis and purification of SQ1, Beer’s Law analysis of SQ1, 1H-NMR titration analysis of SQ1-ethanethiol interaction. This material is available free of charge via the Internet at http://pubs.acs.org