

Abstract
Objective
To test function of hematopoietic stem cells (HSCs) in vivo in C57BL/6 (B6) and Trp53-deficient (Trp53 null) mice by using two HSC enrichment schemes.
Methods
Bone marrow (BM) Lin-CD41-CD48-CD150+ (SLAM, signaling lymphocyte activation molecules), Lin-CD41-CD48-CD150- (SLAM-) and Lin-Sca1+CD117+ (LSK) cells were defined by fluorescence activated cell staining (FACS). Cellular reactive oxygen species (ROS) level was also analyzed by FACS. Sorted SLAM, SLAM- and LSK cells were tested in vivo in the competitive repopulation (CR) and serial transplantation assays.
Results
The SLAM cell fraction was 0.0078 ± 0.0010% and 0.0135 ± 0.0010% of total BM cells in B6 and Trp53 null mice, and was highly correlated (R2 = 0.7116) with LSK cells. CD150+ BM cells also contained more ROSlow cells than did CD150- cells. B6 SLAM cells repopulated recipients much better than B6 SLAM- cells, showing high HSC enrichment. B6 SLAM cells also engrafted recipients better than Trp53 null SLAM cells in the CR and the follow-up serial transplantation assays. Similarly, LSK cells from B6 donors also had higher repopulating ability than those from Trp53 null donors. However, whole BM cells from the same B6 and Trp53 null donors showed the opposite functional trend in recipient engraftment.
Conclusion
Both SLAM and LSK marker sets can enrich HSCs from B6 and Trp53 mice. Deficiency of Trp53 up-regulates HSC self-renewal but causes no gain of HSC function.
Hematopoietic stem cells (HSCs) reside in fetal liver, cord blood and adult bone marrow (BM) in very low frequencies but perform a vital function of sustaining life-long production of all mature blood cells[1-5]. Various methods have been developed to enrich HSCs for functional studies as well as for clinical transplantation[6-10]. HSCs lack the expression of cell surface molecules for lineage-specific mature cells, and are therefore Lin-[6,7,10]. In mouse models, HSCs usually express stem cell antigen 1 (Sca1+) and c-Kit (Kit+, CD117), a trans-membrane tyrosine kinase that serves as a receptor for stem cell factor [10-12]. These findings led to the establishment of Lin-Sca1+Kit+ (LSK) as a standard marker set for HSCs, although other antigens, such as CD34 and CD38, are often added to refine HSCs into even smaller populations[7,9,10]. The recent discovery of CD150 as a positive selection marker for HSCs provided a new strategy for HSC enrichment [4]. CD150 and two other members of the signaling lymphocyte activation molecule (SLAM) family proteins, CD48 and CD244, have stage-specific expression patterns on hematopoietic cells [4]. CD150 positive selection has been successfully applied to enrich HSCs from mouse fetal liver and from BM of old and young mice [4,13,14]. A recent study using the combination of CD150 selection, Hoechst dye efflux side population and canonical markers for HSC enrichment has confirmed the potential of CD150 positive selection for HSC enrichment, but found that HSC activity is also present in the CD150- cells fraction [15].
In the current study, we tested HSC function in normal C57BL/6J (B6) and B6.129S2-Trp53tm1Tji/J (Trp53 null) mice using enriched HSC populations based on the SLAM and LSK markers. We specifically selected the Trp53 null mice for the study because Trp53 is a cell cycle regulator that affects HSC function. It was found that Trp53 null mice have a greater number of HSCs responsible for reconstitution of lethally irradiated recipients after 5-fluorouracil treatment [16]. It was also observed that Trp53 null mice have a larger pool of LSK cells in the BM, and that whole BM (WBM) cells from Trp53 null donors had higher competitive repopulating ability relative to wild type B6 donor cells but 56% of recipients of Trp53 null BM cells died within five months following cell infusion [17]. These findings implied that overall HSC function is up-regulated in the BM of Trp53 null mice with undefined cause of early recipient death.
We conducted this study aimed to verify CD150 as a positive selection marker for HSC enrichment and to understand whether HSCs from Trp53 null mice are truly functionally advantageous when enriched cells in addition to WBM cells are used for the engraftment assay. By using fluorescence activated cell sorting (FACS), competitive repopulation (CR), and serial transplantation assays, we demonstrated that BM cells defined by the SLAM and LSK markers were both highly enriched for HSC activity in B6 and Trp53 null mice. Upon re-transplantation, SLAM-enriched B6 HSCs maintained high functional ability in the secondary recipients. Using SLAM and LSK cells in the CR assay, we found that HSC engraftment ability was lower in cells from Trp53 null than from normal B6 mice, which differed from the outcome when WBM cells were used as the HSC source. Our findings support the usage of CD150 as a positive selection marker for HSC enrichment, and provide fresh evidence indicating that Trp53 deficiency may up-regulate HSC self-renewal but does not produce a true functional advantage for engraftment.
Materials and methods
Mice
Inbred B6, congenic B6.SJL-Ptprc (B6-CD45.1), and Trp53 null mice were originally obtained from the Jackson Laboratory (Bar Harbor, Maine, USA), and were bred and maintained in the National Institutes of Health animal facility. All mice were used at 2-4 months of age. The B6-CD45.1 and Trp53 null mice had been backcrossed to B6 for 22 and 12 generations respectively to ensure a relatively pure B6 genetic background [18]. Animal studies were approved by the National Heart, Lung, and Blood Institute Animal Care and Use Committee.
Flow cytometry cell staining and cell sorting
BM cells were flushed from tibiae and femurs of both legs of each donor or competitor mouse into 2 mL of IMDM media, filtered through a 90 μm nylon mesh, and counted by a ViCell counter (Beckman Coulter, Miami, FL) before use. Monoclonal antibodies for mouse CD3 (clone 145-2C11), CD4 (clone GK 1.5), CD8 (clone 53-6.72), CD11b (clone M1/70), CD41 (clone MWReg 30), CD45R (B220, clone RA3-6B2), CD48 (Clone BCM1) CD117 (c-Kit, clone 2B8), erythroid cells (clone Ter119), granulocytes (Gr1/Ly6-G, clone RB6-8C5), and stem cell antigen 1 (Sca1, clone E13-161), were from BD Biosciences (San Diego, CA). Antibodies were conjugated to fluorescein isothyocyanate (FITC), phycoerythrin (PE), or allophycocyanin (APC). Anti-mouse CD150 antibody was from Biolegend (San Diego, CA) while the fluorescent probe 2′,7′-dichlorofluorescein diacetate (DCF-DA) dye was from Invitrogen (Carlsbad, CA).
Procedures for flow cytometry were adapted as previously described [17]. In brief, BM cells were incubated in Geys solution (130.68 mM NH4Cl, 4.96 mM KCl, 0.82 mM Na2HPO4, 0.16 mM KH2PO4, 5.55 mM Dextrose, 1.03 mM MgCl2, 0.28 mM MgSO4, 1.53 mM CaCl2 and 13.39 mM NaHCO3) for ten minutes on ice to lyse RBCs. After washing with a flow buffer (2.68 mM KCl, 1.62 mM Na2HPO4, 1.47 mM KH2PO4, 137 mM NaCl, 7.69 mM NaN3, and 1% BSA), cells were incubated with antibody mixtures on ice for 30 minutes. We used the antibody mixture CD41-FITC + CD48-FITC + Lin-PE (CD3, CD4, CD8, CD11b, CD45R, Gr1, Ter119) + CD150-APC for the staining of SLAM cells and the antibody mixture Lin-PE + Sca1-PE-Cy7 + CD117-APC for the staining of LSK cells. After each staining and washing step, cells were centrifuged at 500 g for 5 minutes at 4°C. Acquisition was carried out using a BD-LSR II flow cytometer with the FACSDiva software (Becton Dickinson, San Jose, CA). The procedure used for ROS measurement was the same as described earlier [19]. BM cells were incubated with the DCF-DA dye and the anti-mouse CD150-APC antibody in a 37°C water bath for 30 minutes and then washed and acquired, as described above.
For cell sorting, BM cells from B6 and Trp53 null donors were stained with CD41-FITC + CD48-FITC + Lin-PE + CD150-APC antibody mixture and were separated into Lin-CD41-CD48-CD150+ (SLAM) and Lin-CD41-CD48-CD150- (SLAM-) cell fractions. We first gated out Lin- cells and then gated CD41-CD48- cells on Lin- cells. At last, we displayed CD150 expression on the Lin-CD41-CD48- cells and sorted out CD150+ cells as SLAM cells and CD150- cells as SLAM- cells. Gates were set arbitrarily to sort only the cells that are very bright or truly negative for CD150 expression by avoiding the cells with moderate CD150 expression to eliminate any potential overlap of CD150+ and CD150- cells (Figure 1A). B6 and Trp53 null BM cells were also stained with Lin-PE + Sca1-PE-Cy5 + CD117-APC antibody mixture and sorted out the Lin-Sca1+Kit+ LSK cell fraction. Cell sorting was performed using a FACSVantage cell sorter equipped with the FACSDiva software (Becton Dickinson, San Jose, CA). Collected cells were centrifuged at 500 g for 30 minutes and were reconstituted in fresh IMDM for transplantation.
Figure 1. BM Lin-CD41-CD48-CD150+ SLAM cells and Lin-Sca1+c-Kit+ LSK cells in B6 and Trp53 null mice.
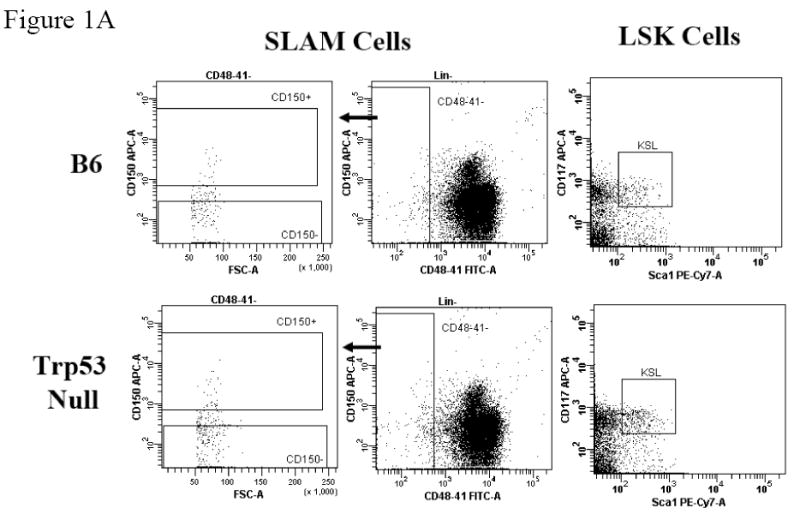
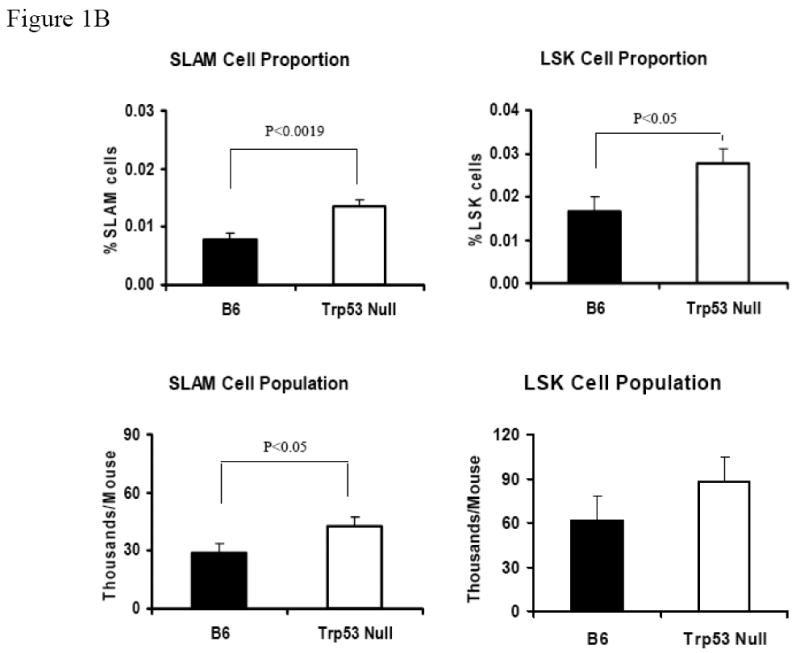
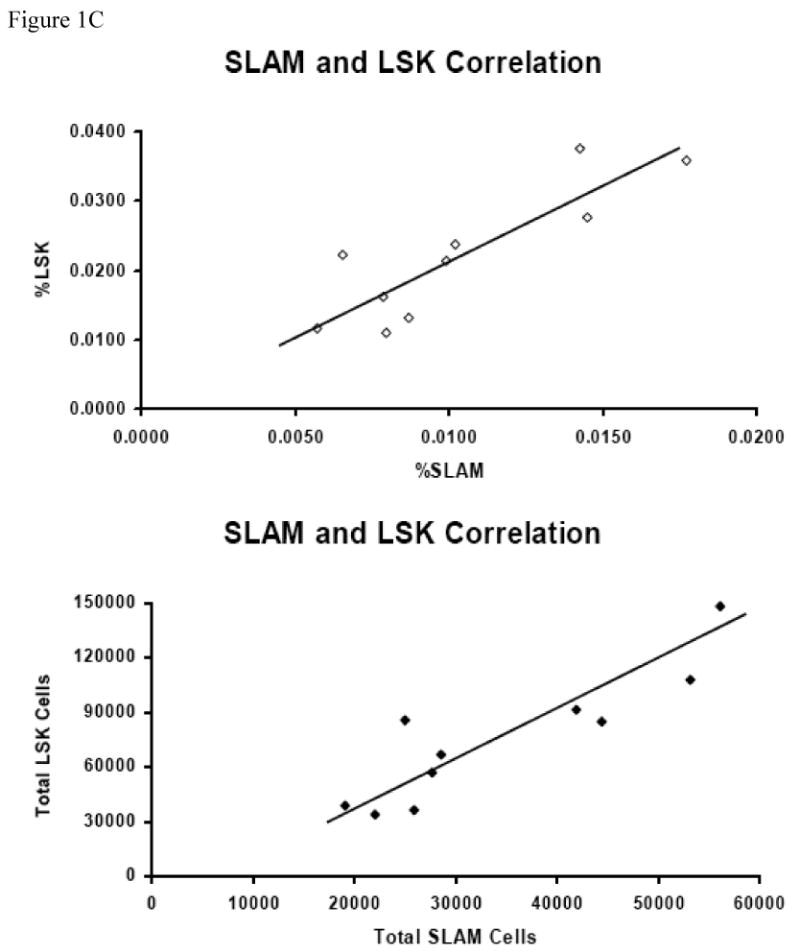
BM cells from five B6 and five Trp53 null mice were stained with antibody cocktails containing CD41-FITC + CD48-FITC + Lin (CD3, CD4, CD8, CD11b CD45R, Gr1, Ter119)-PE + CD150-APC, or Lin-PE + Sca1-PE-Cy7 + CD117-APC, respectively. Lin-CD41-CD48- cells were gated to show CD150 expression for SLAM cells while Lin- cells were gated to show Sca1 and CD117 expressions for LSK cells (A). Proportions and total numbers of BM SLAM and LSK cells were higher in Trp53 null mice than in B6 mice (B). SLAM and LSK cells are highly correlated in percentage (R2 = 0.7116) as well as in total cell number (R2 = 0.7705) (C).
Competitive repopulation and serial transplantation
Sorted SLAM and SLAM- cells from B6 and Trp53 null mice were mixed with whole BM cells from a pool of young CD45.1 congenic competitors at 102:106 and 103:106, respectively, and the cell mixtures were then injected into young B6 recipients which had received 11 Gys TBI (Shepherd Mark 1 137cesium gamma source, J. L. Shepherd & Associates, Glendale CA). Four recipients were used for each donor cell type and donor contributions to recipient T (CD3+), B (CD45R+) and myeloid cells (CD11b+) were analyzed by FACS for six months using the CD45.1+/CD45.2+ allelic difference. Four B6 mice that received 11 Gy TBI and 106 competitor BM cells without donor cells were used as controls to monitor average host contribution which was subtracted from the donor contribution at each time point. Two weeks after the sixth month measurement, the recipient from each donor cell group that had the highest donor cell contribution was euthanized, and BM cells were serially-transplanted into a new set of lethally-irradiated (11Gy TBI) B6 recipients at 15 × 106 cells per recipient, three recipients per donor. The proportions of CD45.2 donor and CD45.1 competitor cell engraftment in the secondary recipients were measured at two, six, fourteen and twenty seven weeks using the same methods.
To further validate observations from engraftment using SLAM cells, we then sorted out LSK BM cells from B6 and Trp52 null donors and mixed them 1:300 with a pool of B6-CD45.1 competitor cells and then transplanted the cell mixture into lethally irradiated young B6 recipients in another CR assay. We used six recipients for each donor type. As a comparison, we also mixed unfractionated WBM cells from the same B6 and Trp53 null donors with competitor BM cells at 1:1 and transplanted the cell mixtures into recipients in the same assay. Donor contributions were measured at four, eight and eleven weeks after transplantation.
Data analyses
Data from cell proportion and competitive engraftment measurements were analyzed by the JMP statistical software (SAS Institute Inc., NC) using single factor (genotype: B6 vs Trp53 null) and two-factor (genotype × cell type) models [20]. Data are presented as means with standard errors. Statistical significance P values are given wherever a significant difference exists.
Results
Correlation between SLAM and LSK cell populations
When BM cells from B6 and Trp53 null mice were stained for the Lin-CD41-CD48-CD150+ SLAM markers, we found a cell population at frequencies of 0.0078 ± 0.0010% and 0.0135 ± 0.0010% of total BM cells for B6 and Trp53 null mice, respectively (Figure 1A). When we stained BM cells from the same mice with the well-established HSC-containing LSK markers, the LSK cell populations were found to be 0.0165 ± 0.0035% for B6 and 0.0276 ± 0.0035% for Trp53 mice respectively (Figure 1A). Both the SLAM (P<0.0019) and the LSK cell (P<0.05) populations were significantly larger in Trp53 null than in B6 mice (Figure 1B). From these measurements, we found a significant correlation between SLAM and LSK cell proportions (R2 = 0.7116, P<0.0013, Figure 1C), as well as a significant correlation between total SLAM and total LSK cells (R2 = 0.7705, P<0.0005, Figure 1C), suggesting that SLAM cells, just as LSK cells, could be highly enriched for HSCs.
Lower level of ROS in CD150+ cells
To test whether the SLAM cell population actually enriched HSCs, we first analyzed the DCF-DA dye uptake in CD150+ and CD150- BM cells from B6 and Trp53 null mice as a measurement of cellular ROS content. The proportion of ROSlow cells in total BM was similar between B6 and Trp53 null mice (Figure 2A). However, CD150+ BM cells from B6 and Trp53 null mice both had significantly higher proportions of (P<0.0001) ROSlow cells (79.5 ± 1.68% and 83.6 ± 1.68%) CD150- BM cells (71.1 ± 1.68% and 71.6 ± 1.68%, Figure 2B, 2C), suggesting that the CD150+ cell fraction contains more cells that are primitive and inactive than the CD150- cell fraction.
Figure 2. BM cell ROS content.
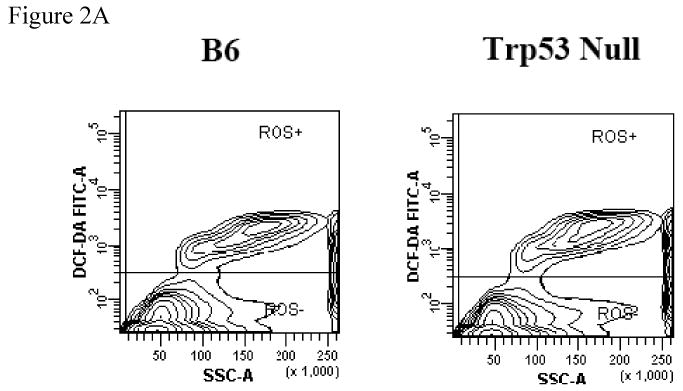
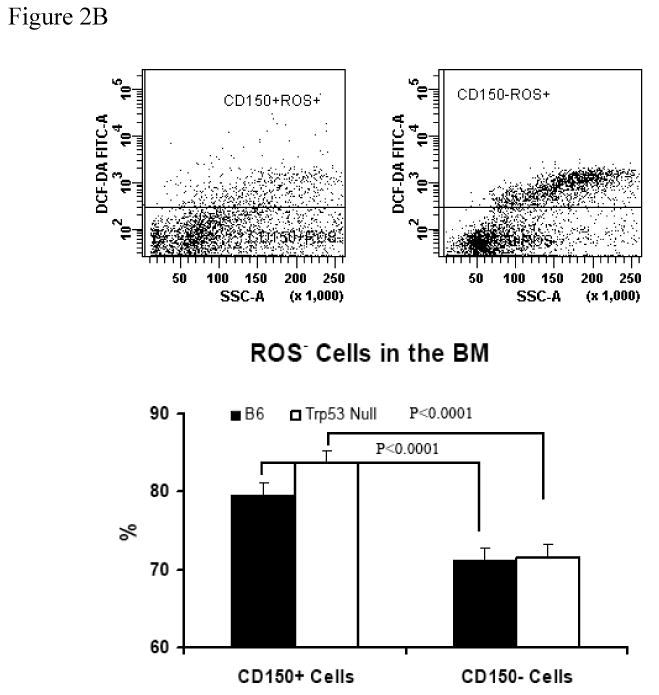
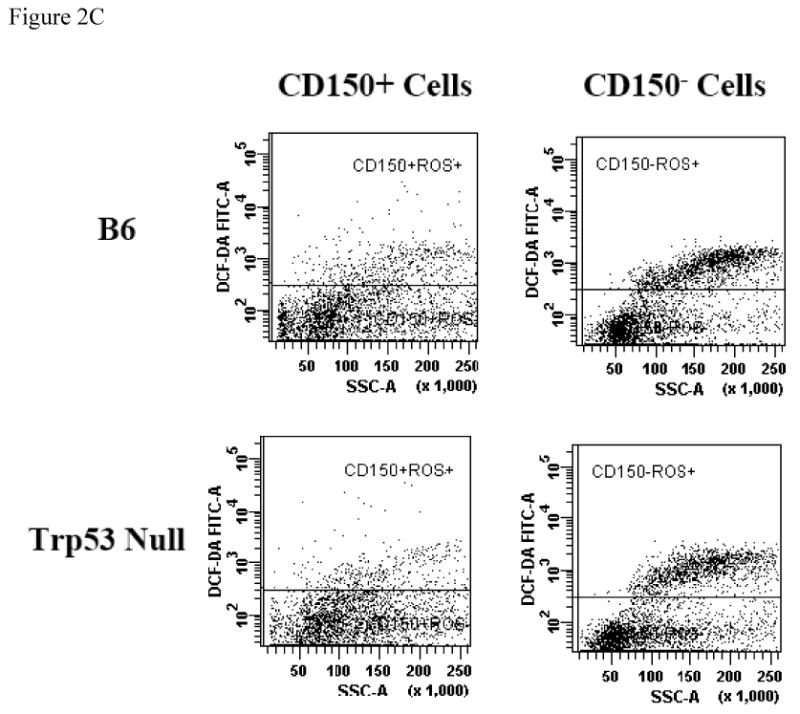
BM cells from five B6 and five Trp53 null mice were incubated with DCF-DA along with an anti-CD150 antibody to measure reactive oxygen species (ROS). Proportion of ROSlow cells was similar between B6 and Trp53 null mice (A). Proportion of ROSlow cells was significantly higher in CD150+ than in CD150- cells in both B6 and Trp53 null mice. Data were shown as means with standard errors (B), or as representative dot plots (C).
Enrichment of functional HSCs in the SLAM cell population
Next we sorted and mixed SLAM and SLAM- cells from B6 and Trp53 donors with competitor BM cells and transplanted them into lethally-irradiated recipients (Figure 3A). The SLAM- cell contribution was relatively high at the first two months (6-8%) but reduced gradually thereafter to 4-5% at 5 and 6 months. To the opposite, the SLAM cell contribution increased steadily over time from 4-6% at one month to 12-13% at 5 and 6 months (Figure 3B). The large gap in the donor:competitor cell ratio is probably responsible for the low overall donor contribution and high variability among the four recipients from each group, hampering the possibility to achieve statistical significance when the means of donor contributions were compared among the different donor cell types. To test whether there is a significant difference in HSC function between SLAM and SLAM- cells, we re-transplanted BM cells from first round recipients into lethally-irradiated secondary hosts. Indeed, SLAM cells showed significantly higher levels of donor contribution than SLAM- cells when engrafted into secondary hosts for two (44.3 ± 2.0% vs 13.4 ± 2.5%, P<0.0001), six (78.1 ± 2.3% vs 21.7 ± 2.8%, P<0.01), fourteen (76.1 ± 2.8% vs 14.7 ± 3.4%, P<0.0001) and twenty-seven (75.6 ± 3.7 vs 17.2 ± 4.5, P<0.0001) weeks, showing that SLAM cells are much better enriched for HSCs than SLAM- cells (Figure 4A, 4B).
Figure 3. Repopulation of SLAM and SLAM- BM cells.
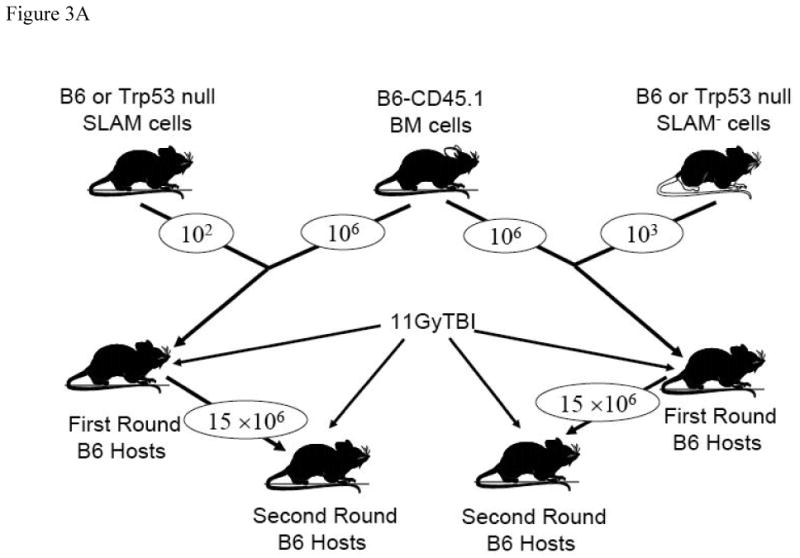

Sorted SLAM and SLAM- BM cells from B6 and Trp53 null donors were mixed 102 : 106 and 103 : 106 respectively with unfractionated BM cells from a pool of B6-CD45.1 congenic mice, and the cell mixtures were then injected into lethally-irradiated (11 Gy TBI) B6 recipients at four recipients per donor cell type (A). Engraftments of donor cells in lethally-irradiated recipient from one to six months were shown as averages with standard errors (B).
Figure 4. Serial transplantation.
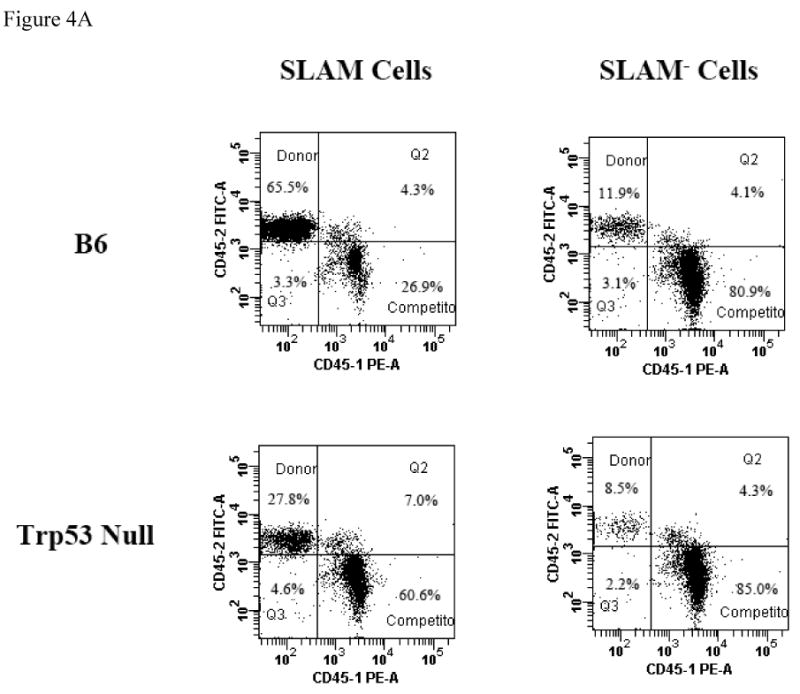
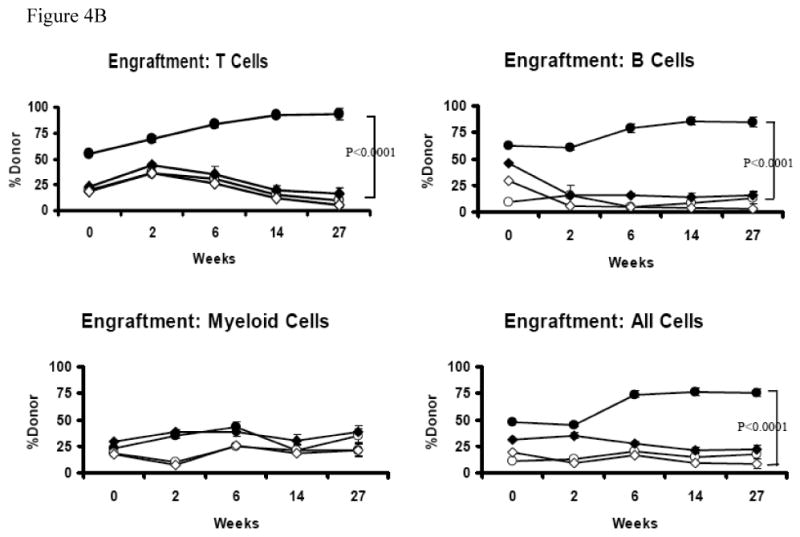
BM cells from the competitive repopulation recipients were obtained at six and a half months following the initiate reconstitution. BM cells from one recipient of each of the four original donor groups (B6 SLAM, B6 SLAM-, Trp53 null SLAM, and Trp53 null SLAM-) that had the highest donor engraftment were re-transplanted into new lethally-irradiated (11 Gy TBI) B6 secondary recipients at three recipients each type, with each recipient receiving 15 × 106 cells. Engraftment of original donor and competitor cells was measured at two, six, fourteen and twenty-seven weeks after secondary transplantation. Data shown are representatives (A) and average donor contributions with standard errors from three recipient mice used for each donor group (B).
Reduced engraftment from Trp53 null SLAM cells
In comparison to SLAM cells from normal B6 donors (12-13%), Trp53 null SLAM cells (7.5-8.5%) had much lower contribution to recipient engraftment, suggesting a possible HSC functional decline in Trp53 null mice (Figure 3B). Upon serial transplantation, Trp53 null SLAM cell contributions were 34.9 ± 2.4%, 29.8 ± 2.3%, 20.8 ± 2.8%; 21.9 ± 3.7% at two, six, fourteen and twenty-seven weeks respectively, much lower (P<0.01) than the 44.3 ± 2.0%, 78.1 ± 2.3%, 76.1 ± 2.8% and 75.6 ± 3.7 donor contribution from B6 SLAM cells. It seems that the difference in repopulating ability between Trp53 null and B6 SLAM cells enlarged over time in the secondary hosts (Figure 4B). In this study, all recipients survived and examination of three recipients of B6 SLAM cells and three recipients of Trp53 null SLAM cells at 13 months following initial transplantation found no gross pathologic change or obvious tumor formation. Blood smear revealed normal cell morphology and distribution with no sign of leukemia. All secondary recipients also survived without obvious abnormality except having lower levels (P<0.05) of circulating WBCs, neutrophils and lymphocytes in comparison to secondary recipients of B6 SLAM cells (Table 1).
Table 1. Recipient complete blood counts six months following serial transplantation.
| B6 | Trp53 null | STAT | |||
|---|---|---|---|---|---|
| SLAM | SLAM- | SLAM | SLAM- | ||
| WBC (106/mL) | 5.7 ± 0.5 | 5.9 ± 0.5 | 3.4 ± 0.5 | 3.2 ± 0.5 | S |
| Neutrophils (106/mL) | 1.1 ± 0.2 | 1.1 ± 0.2 | 0.7 ± 0.2 | 0.5 ± 0.2 | s |
| Lymphocytes (106/mL) | 4.4 ± 0.5 | 4.6 ± 0.5 | 2.6 ± 0.5 | 2.6 ± 0.5 | S |
| RBC (109/mL) | 7.2 ± 1.1 | 8.1 ± 1.3 | 5.4 ± 1.1 | 4.4 ± 1.3 | NS |
| Hemoglobin (g/dL) | 9.2 ± 1.6 | 10.8 ± 2.0 | 6.9 ± 1.6 | 5.3 ± 2.0 | NS |
| Lymphocytes (106/mL) | 617 ± 108 | 781 ± 133 | 494 ± 108 | 422 ± 133 | NS |
Data shown as mean ± SEM from a two-way variance analysis with interactions using three recipients per group. S and s: significant strain difference at P<0.01 or P<0.05 respectively. NS: no significance.
Lower HSC function in Trp53 null LSK cells
To test whether the reduced engraftment from Trp53 null SLAM cells truly represent a lower HSC function in Trp53 null mice, we next sorted LSK cells from the BM of Trp53 null and B6 mice and engrafted cells into lethally irradiated B6 recipients in another CR assay. Contributions from Trp53 null and B6 LSK cells were 22.7 ± 3.4% and 24.0 ± 3.1% at four weeks, 13.5 ± 4.9% and 19.0 ± 4.5% at eight weeks, and 20.9 ± 3.7% and 33.8 ± 3.1% (P<0.05) at eleven weeks after transplantation (Figure 5). We also mixed WBM cells from the same Trp53 null and B6 donors 1:1 with WBM cells from the same B6-CD45.1 competitors in the same CR assay, and found that Trp53 null WBM cells engrafted equally well or better than B6 WBM cells with donor contributions of 38.2 ± 1.2% and 42.0 ± 1.2% at four weeks, 50.4 ± 3.4% and 47.3 ± 2.4% at eight weeks, and 74.1 ± 2.7% and 69.2 ± 1.9% at eleven weeks (Figure 5). Two of the four recipients of Trp53 null WBM cells died between eight and eleven weeks while all other recipients survived. We were not able to determine the cause of death for these two recipients. For the remaining recipients, complete blood counts showed no difference among the four donor cell types (data not shown, similar to those in Table 1). Results from this study indicate that Trp53 null LSK cells are also less functional for engraftment than B6 LSK cells while overall HSC number is still higher in the BM of Trp53 null than in normal B6 mice.
Figure 5. Reconstitution of LSK cells.
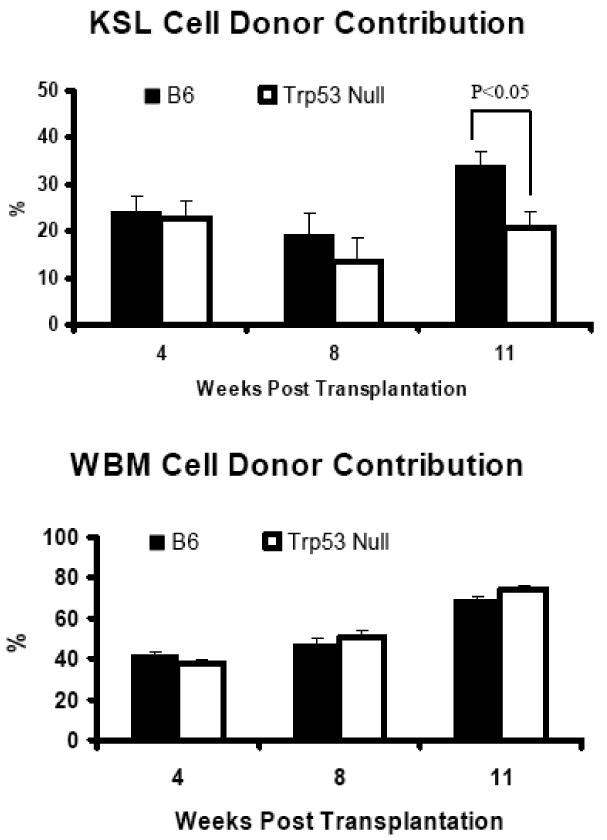
Sorted LSK cells from B6 and Trp53 null mice were mixed 1:300 with B6-CD45.1 congenic BM cells and injected into lethally irradiated (11 Gy TBI) B6 recipients at six recipients per donor type. Unfractionated WBM cells from the same B6 and Trp53 null donors were mixed 1:1 with B6-CD45.1 competitor cells and injected to similar recipients at four recipients per donor type. Donor contributions were measured at four, eight and eleven weeks after transplantation. Data presented as means with standard errors.
Discussion
Characterization of CD150 as a HSC marker added a new method for HSC enrichment [4,13,14]. In the current study, we combined CD150 selection with the conventional Lin- marker set along with negative selection for CD41 and CD48 to isolate Lin-CD41-CD48-CD150+ SLAM cells as enriched HSCs. The high correlation between SLAM and LSK cells suggests that the SLAM combination provides a set of surrogate markers for HSC enrichment as do LSK markers. CD150+ BM cells had a significantly higher proportion of ROSlow cells than CD150- BM cells, which further supports the notion that CD150+ cells are enriched for HSCs since primitive HSCs are metabolically inactive and contain lower levels of ROS. Our results are in agreement with a recent report by Jang et al, in which primitive HSCs had lower levels of ROS whereas ROShi cells display signs of HSC exhaustion through serial transplantation [21]. In a mouse model of Fanconi anemia, administration of the proinflammatory cytokine tumor necrosis factor alpha induced premature senescence in BM HSCs, progenitor cells with higher Trp53, higher level of ROS, and more oxidative DNA damage [22]. The fact that SLAM cells are highly enriched for HSCs by CR and serial transplantation assessments provided definitive evidence showing that CD150-based SLAM markers are a useful set of markers effective for the enrichment of long-term functional HSCs, consistent with the original report showing much higher HSC activity in CD150+ BM cells [4]. We did observe HSC activity in the SLAM- cell fraction through CR and serial transplantation, indicating that not all HSCs are in the CD150+ cell population. This result is in agreement with a recent report showing that CD150- cells are present in the Hoechst dye efflux side population with HSC activity [15].
major finding from this study is the lower HSC functional ability in SLAM cells from Trp53 null mice in comparison to those from normal B6 mice through CR and serial transplantation. This observation is further confirmed by a separate study in which LSK cells from Trp53 null donors also had lower engraftment ability than LSK cells from normal B6 donors. These results seemed to differ from early studies showing a general elevation in HSC number and activity in Trp53 null mice [16,17,23]. However, when WBM cells from the same donors were used for the assay, we indeed found that HSC activity is elevated in Trp53 null mice, consistent with previous studies [16,17,23]. All recipients of Trp53 null SLAM, SLAM- and LSK cells and B6 SLAM, SLAM-, LSK and WBM cells survived through CR and/or serial transplantation with no signs of leukemia or tumor development. However, two recipients of Trp53 null WBM cells died between eight and eleven weeks. In a previous study, 56% of recipients of Trp53 null WBM cells died within 5 months after cell transplantation [17]. One possibility regarding recipient death is a potential “adverse” effect produced by all Trp53 null cells. In such a case, the relatively lower level of engraftment from Trp53 null SLAM and LSK cells might have limited the adverse effect and therefore prevented recipient mortality. Another possible explanation is the presence of “adverse” cells in the WBM, but not SLAM or LSK cells, in Trp53 null mice. These “adverse” cells might only proliferate when transplanted into lethally irradiated recipients in an active cytokine environment. We could not distinguish these two possibilities since the exact cause of recipient mortality remains unknown.
The fact that SLAM and LSK cells from Trp53 null donors had lower engraftment ability than normal B6 SLAM and LSK cells can at least be partially explained by a cell number effect. Both the LSK and SLAM cell populations were larger in Trp53 null than in normal B6 mice, consistent with findings from previous reports showing elevated HSC presence in Trp53 null mice [16,17,23,24]. This finding is also in line with findings from p21-deficient mice in which HSC proliferation and absolute numbers increased while HSC functionality in serial transplantation decreased in p21-deficient mice [25,26]. Together, results from this study indicate that HSC self-renewal, but not functional ability per cell, is elevated in mice deficient for Trp53.
Footnotes
Publisher's Disclaimer: This is a PDF file of an unedited manuscript that has been accepted for publication. As a service to our customers we are providing this early version of the manuscript. The manuscript will undergo copyediting, typesetting, and review of the resulting proof before it is published in its final citable form. Please note that during the production process errors may be discovered which could affect the content, and all legal disclaimers that apply to the journal pertain.
References
- 1.Chen J, Astle CM, Harrison DE. Development and aging of primitive hematopoietic stem cells in BALB/cBy mice. Exp Hematol. 1999;27:928–935. doi: 10.1016/s0301-472x(99)00018-1. [DOI] [PubMed] [Google Scholar]
- 2.Harrison DE, Astle CM, Stone M. Numbers and functions of transplantable primitive immunohematopoietic stem cells. Effects of age. J Immunol. 1989;142(11):3833–3840. [PubMed] [Google Scholar]
- 3.Hellman S, Botnick LE, Hannon EC, Vigneulle RM. Proliferative capacity of murine hematopoietic stem cells. Proc Natl Acad Sci U S A. 1978;75(1):490–494. doi: 10.1073/pnas.75.1.490. [DOI] [PMC free article] [PubMed] [Google Scholar]
- 4.Kiel MJ, Yilmaz OH, Iwashita T, Yilmaz OH, Terhorst C, Morrison SJ. SLAM family receptors distinguish hematopoietic stem and progenitor cells and reveal endothelial niches for stem cells. Cell. 2005;121(7):1109–1121. doi: 10.1016/j.cell.2005.05.026. [DOI] [PubMed] [Google Scholar]
- 5.Yuan R, Astle CM, Chen J, Harrison DE. Genetic regulation of hematopoietic stem cell exhaustion during development and growth. Exp Hematol. 2005;33(2):243–250. doi: 10.1016/j.exphem.2004.10.014. [DOI] [PubMed] [Google Scholar]
- 6.Spangrude GJ, Heimfeld S, Weissman IL. Purification and characterization of mouse hematopoietic stem cells. Science. 1988;241:58–62. doi: 10.1126/science.2898810. [DOI] [PubMed] [Google Scholar]
- 7.Osawa M, Hanada K, Hamada H, Nakauchi H. Long-term lymphohematopoietic reconstitution by a single CD34-low/negative hematopoietic stem cell. Science. 1996;273(5272):242–245. doi: 10.1126/science.273.5272.242. [DOI] [PubMed] [Google Scholar]
- 8.Goodell MA, Brose K, Paradis G, Conner AS, Mulligan RC. Isolation and functional properties of murine hematopoietic stem cells that are replicating in vivo. J Exp Med. 1996;183(4):1797–1806. doi: 10.1084/jem.183.4.1797. [DOI] [PMC free article] [PubMed] [Google Scholar]
- 9.Miller JS, McCullar V, Punzel M, Lemischka IR, Moore KA. Single adult human CD34(+)/Lin-/CD38(-) progenitors give rise to natural killer cells, B-lineage cells, dendritic cells, and myeloid cells. Blood. 1999;93:96–106. [PubMed] [Google Scholar]
- 10.Zhao Y, Zhan Y, Lin Y, Yang J, Harrison DE, Anderson WF. Regulation of murine hematopoietic stem cell proliferation in vivo. Blood. 2000;96:3016–3022. [PubMed] [Google Scholar]
- 11.Spangrude GJ, Brooks DM. Mouse strain variability in the expression of the hematopoietic stem cell antigen Ly-6A/E by bone marrow cells. Blood. 1993;82(11):3327–3332. [PubMed] [Google Scholar]
- 12.van de Rijn M, Heimfeld S, Spangrude GJ, Weissman IL. Mouse hematopoietic stem-cell antigen Sca-1 is a member of the Ly-6 antigen family. Proc Natl Acad Sci U S A. 1989;86(12):4634–4638. doi: 10.1073/pnas.86.12.4634. [DOI] [PMC free article] [PubMed] [Google Scholar]
- 13.Kim I, Yilmaz OH, Kiel MJ, Morrison SJ. Enhanced purification of fetal liver hematopoietic stem cells using SLAM family receptors. Blood. 2006;108(2):737–744. doi: 10.1182/blood-2005-10-4135. [DOI] [PMC free article] [PubMed] [Google Scholar]
- 14.Yilmaz OH, Kiel MJ, Morrison SJ. SLAM family markers are conserved among hematopoietic stem cells from old and reconstituted mice and markedly increase their purity. Blood. 2006;107(3):924–930. doi: 10.1182/blood-2005-05-2140. [DOI] [PMC free article] [PubMed] [Google Scholar]
- 15.Weksberg DC, Chambers SM, Boles NC, Goodell MA. CD150- side population cells represent a functionally distinct population of long-term hematopoietic stem cells. Blood. 2008;111(4):2444–2451. doi: 10.1182/blood-2007-09-115006. [DOI] [PMC free article] [PubMed] [Google Scholar]
- 16.Wlodarski P, Wasik M, Ratajczak MZ, Sevignani C, Hoser G, Kawiak J, Gewirtz AM, Calabretta B, Skorski T. Role of p53 in hematopoietic recovery after cytotoxic treatment. Blood. 1998;91(8):2998–3006. [PubMed] [Google Scholar]
- 17.TeKippe M, Harrison DE, Chen J. Expansion of hematopoietic stem cell phenotype and activity in Trp53-null mice. Exp Hematol. 2003;31(6):521–527. doi: 10.1016/s0301-472x(03)00072-9. [DOI] [PubMed] [Google Scholar]
- 18.The Staff of The Jackson Laboratory. Handbook on genetically standardized JAX mice. Bar Harbor, ME: The Jackson Laboratory; 1997. [Google Scholar]
- 19.Yao YG, Ellison FM, McCoy JP, Chen J, Young NS. Age-dependent accumulation of mtDNA mutations in murine hematopoietic stem cells is modulated by the nuclear genetic background. Hum Mol Genet. 2007;16(3):286–294. doi: 10.1093/hmg/ddl457. [DOI] [PubMed] [Google Scholar]
- 20.SAS Institute Inc. JMP Statistics and Graphics Guide, Version 3. Cary, NC: SAS Institute; 1998. [Google Scholar]
- 21.Jang YY, Sharkis SJ. A low level of reactive oxygen species selects for primitive hematopoietic stem cells that may reside in the low-oxygenic niche. Blood. 2007;110(8):3056–3063. doi: 10.1182/blood-2007-05-087759. [DOI] [PMC free article] [PubMed] [Google Scholar]
- 22.Zhang X, Sejas DP, Qiu Y, Williams DA, Pang Q. Inflammatory ROS promote and cooperate with the Fanconi anemia mutation for hematopoietic senescence. J Cell Sci. 2007;120(9):1572–1583. doi: 10.1242/jcs.003152. [DOI] [PMC free article] [PubMed] [Google Scholar]
- 23.Zhang X, Li J, Sejas DP, Pang Q. The ATM/p53/p21 pathway influences cell fate decision between apoptosis and senescence in reoxygenated hematopoietic progenitor cells. J Biol Chem. 2005;280(20):19635–19640. doi: 10.1074/jbc.M502262200. [DOI] [PubMed] [Google Scholar]
- 24.Dumble M, Moore L, Chambers SM, Geiger H, Van Zant G, Goodell MA, Donehower LA. The impact of altered p53 dosage on hematopoietic stem cell dynamics during aging. Blood. 2007;109(4):1736–1742. doi: 10.1182/blood-2006-03-010413. [DOI] [PMC free article] [PubMed] [Google Scholar]
- 25.Cheng T, Rodrigues N, Shen H, Yang Y, Dombkowski D, Sykes M, Scadden DT. Hematopoietic stem cell quiescence maintained by p21cip1/waf1. Science. 2000;287(5459):1804–1808. doi: 10.1126/science.287.5459.1804. [DOI] [PubMed] [Google Scholar]
- 26.Yu H, Yuan Y, Shen H, Cheng T. Hematopoietic stem cell exhaustion impacted by p18 INK4C and p21 Cip1/Waf1 in opposite manners. Blood. 2006;107(3):1200–1206. doi: 10.1182/blood-2005-02-0685. [DOI] [PMC free article] [PubMed] [Google Scholar]