Abstract
Age-related changes in the temporal properties of an S-cone pathway were characterized by the psychophysical impulse-response function (IRF). Participants included 49 color-normal observers ranging in age from 16.8 to 86.3 years. A double-pulse method was used to measure the IRF with S-cone modulation at constant luminance. Stimuli were presented as a Gaussian patch (±1SD=2.3°) in one of four quadrants around a central fixation cross on a CRT screen. The test stimulus was modulated from the equal-energy white of the background toward the short-wave spectrum locus. Each of the two pulses (6.67 ms) was separated by an inter-stimulus interval (ISI) from 20 to 720 ms. Chromatic detection thresholds were determined by a four-alternative forced-choice method with staircases for each ISI in one session. IRFs were calculated from the threshold data using a model with four parameters of an exponentially damped sine wave. S-cone IRFs have only an excitatory phase and a much longer time course compared with IRFs for luminance modulation measured with the same apparatus. The results demonstrated significant age-related losses in IRF amplitude, but the latency (time to peak) of the IRF was stable with age.
1. INTRODUCTION
The temporal response of the human visual system may be characterized in the time domain by its impulse response or in the frequency domain by its contrast sensitivity. To the extent that the visual system is linear, the impulse-response function (IRF) is related to the temporal contrast sensitivity function (tCSF) by the inverse Fourier transform. Psychophysical methods have been used to derive an IRF from two-pulse thresholds and from tCSFs for stimuli modulated in luminance. The two approaches agree reasonably well1,2 and are also qualitatively consistent with earlier studies of critical flicker frequency (CFF), considering that the latter seldom took account of retinal illuminance changes in the older retina due to reductions in pupil area and lenticular transmission.3,4
In our previous study,2 we measured two-pulse thresholds5 for an achromatic test patch with a spatial Gaussian shape superimposed on a 10 cd/m2 background having the same chromaticity as the pulse. Possible changes of criterion with age were controlled by a forced-choice method. The model of Burr and Morrone6 was used to calculate IRFs from the threshold data. These IRFs followed an exponentially damped sine function with a fast excitatory response followed by an inhibitory phase. Overall, there was a significant age-related reduction in amplitude of the first (excitatory) phase of the IRF, but no significant reduction in duration. For about one-third of the observers over age 55 years, the second (inhibitory) phase of the IRF was reduced, and, as a consequence, the duration of the first (excitatory) phase was quite slow and long. For all other observers, the duration of the first (excitatory) phase of the IRFs was ~40–60 ms and was nearly constant with age. Control conditions demonstrated that age-related changes in the IRF under these conditions cannot be ascribed to optical factors. Thus, in most cases, the human visual system maintains a stable speed of response to a flash modulated in luminance until at least ~80 years of age, even while the response signal level decreases with age. Senescent loss of temporal resolution for luminance-modulated stimuli may be ascribed to a loss in inhibitory amplitude.
Several characteristics of our luminance IRFs strongly imply mediation by a magnocellular pathway. For nearly half of the observers, the IRFs had three phases similar to Bowen’s triphasic IRFs inferred under suprathreshold conditions with pairs of intense, brief (5 ms) flashes.7 A trimodal response is not typical of parvocells, but is seen for magnocells at higher contrasts.8 The conditions of these measurements were also similar to those in which Benardete9 reported trimodal IRFs in magno ON cells in response to achromatic, low-spatial-frequency stimuli. The chromatic IRF would be expected to be quite different, although both monophasic6,10 and biphasic11,12 IRFs have been reported for red–green chromatic modulation. Monophasic IRFs would be expected from the low pass but not the bandpass form of the chromatic tCSF.13,14 These IRFs are likely mediated by a parvocellular pathway. Responses from an S-cone pathway may be mediated by a separate, koniocellular pathway15 under some conditions. The expectation that differences among chromatic channels may exist in their temporal tuning has not been supported by studies varying the chromaticity of isoluminant stimuli.16–18 None of these studies, however, used individually determined, S-cone isolating stimuli.
At the photoreceptor level, S cones do not differ in their temporal properties from M and L cones,19 but the temporal properties of the S-cone pathway are different from those of M- and L-cone pathways at a postreceptoral level. Previous studies of an S-cone pathway demonstrate that CFF occurs at low temporal frequencies,20 and there is a sharp decline in moduation sensitivity with increasing temporal frequency.21 These signals are thought to be carried by a sluggish chromatic pathway, but with an intense long-wave-adapting background, S-cone signals may have access to a second, faster pathway,22,23 contributing to a luminance signal with polarity opposite to that of M and L cones.24 Under these latter conditions, the tCSF is slightly bandpass, although with lower adaptation the tCSF becomes more lowpass.25 It is unclear whether age-related changes in temporal response observed for an achromatic pathway also take place in chromatic pathways.
Age-related losses in sensitivity of S-cone pathways have been well documented with a number of different temporal test probes,26–29 but whether part of the sensitivity loss is temporal frequency dependent has not been tested. The purpose of the study reported here was to measure age-related changes in the temporal response of an S-cone pathway without the complicating influences of chromatic adapting backgrounds and by use of individually determined tritan pairs to ensure modulation of an S-cone pathway with minimal influence of M- and L-cone pathways. This last feature of our approach was considered essential for present purposes, as there are age-related changes in ocular media density that could rotate the tritan line about the white point when determined with the somewhat broadband phosphors of a CRT. With individually determined S-cone stimuli and individually determined isoluminance, we found that the IRF is monophasic and that the amplitude declines with age. The speed of the S-cone IRF does not change significantly with age.
2. METHODS
A. Subjects
Forty-nine normal observers (25 males and 24 females ranging in age from 16.8 to 86.3 years) were tested. There were approximately equal numbers of males and females within each age decade, and ethnicity was representative of Sacramento County, California. In addition, ancillary data were collected from one pseudophakic observer (74.0 years, female) and one patient diagnosed with glaucoma (71.7 years, male). Prior to testing, each subject was screened in the Department of Ophthalmology at the UC-Davis Medical Center to rule out the presence of retinal disease and abnormal ocular media in the tested eye. Clinical examinations included visual acuity, slit-lamp examination, and direct and indirect ophthalmoscopy. Color stereo fundus photographs of the macula and optic disc (Early Treatment Diabetic Retinopathy Study Fields 1 and 2) were evaluated by a retinal specialist, and no normal participant had more than five small (≤63 μm) drusen or any vascular, retinal, choroidal, or optic nerve findings considered abnormal for the participant’s age. Intraocular pressure was ≤22 mm Hg. Visual acuity was ⩾20/25 in the tested eye except for one subject with 20/30 visual acuity. Exclusion of this observer would not affect the conclusions. Color vision was assessed as normal when tested with the Neitz anomaloscope, the Hardy–Rand–Rittler pseudoisochromatic plates, the Farnsworth F-2 plate, and the Cambridge Colour Test. Subjects with refractive errors greater than +4.00 or −6.50 D were excluded.
Written informed consent was obtained following the Tenets of Helsinki, and with approval of the Office of Human Research Protection of the University of California, Davis, School of Medicine.
B. Apparatus and Stimuli
Two-pulse thresholds were measured for stimuli that were modulated in chromaticity along a tritan line changing from the white background (CIE x,y=0.33,0.33; 10 cd/m2, 1.69 log Td) toward the short-wave spectrum locus. The two pulses were 6.7–20.0 ms each and separated by interstimulus intervals ranging from 20–720 ms. The stimuli were presented in one of four quadrants defined by a fixation cross such that they were located 1.70° to one side or the other and 1.70° above or below the center of the fixation cross. The test stimulus was a Gaussian patch of 2.26° diameter at 1 SD chosen as the test spatial profile to eliminate artifacts caused by spatial transients. These stimuli were presented on a CRT display (Sony GDM-200 PS) operating at a 150 Hz frame rate that was controlled by a video board with 15-bit resolution (Cambridge Research Systems, VSG 2/4) using a Dell Pentium computer. A second CRT monitor displayed the stimuli for the experimenter.
The CRT monitor was viewed through a 2.16× astronomical telescope. A beam splitter placed within the telescope allowed a monochromatic field from a Maxwellian-view optical system to be superimposed in the retinal image. An aperture was placed before the telescope objective to form a 2.5 mm exit pupil of the optical system in the plane of the subject’s anatomical pupil.
The Maxwellian-view optical channel used a 300 W xenon lamp powered by a regulated dc power supply. Retinal illuminance was controlled by a neutral density wedge placed in a focal plane and neutral density filters inserted in a collimated section of the beam, all calibrated at 420 nm, the central wavelength (8 nm bandwidth at half-peak amplitude) of an interference filter placed in a collimated beam. The focused image of the CRT and adapting field were 1.5 mm in extent in the plane of the eye pupil.
Trial lenses were mounted in the spectacle plane to correct individual refractive error. Observer position was maintained with a bite bar that could be adjusted separately in x–y–z planes. An alignment channel was made possible by a pellicle placed in the optical path so that light from the subject’s eye was directed into an auxiliary optical system. A reticule aligned with the optic axis of the telescope and Maxwellian-view system permitted precise alignment of the eye pupil. Stray light was controlled by placing a series of baffles around the observer and each optical channel.
C. Calibrations
The CRT phosphors were calibrated spectrally using a spectroradiometer/photometer (Photo Research, Model PR703-A), while luminance was measured with a chromameter (Minolta, CS-100). The relation between phosphor radiance and voltage was linearized based on lookup tables generated using a photodiode and calibration software in the Visual Stimulus Generator software (Cambridge Research Systems, OptiCal). Retinal illuminance of the Maxwellian-view channel used for an adaptation field was based on photometric calibrations following Westheimer’s method.30 Radiometric calibrations of neutral density wedges and filters were obtained with a p-i-n 10 silicon photodiode and linear readout system (United Detector Technology, Optometer 81).
Rise and fall times of the CRT phosphors were measured with a photodiode and digital oscilloscope and found to be ~1.2 ms for all phosphors. The diameter of the Gaussian patch at 1 SD was 106 pixels on a 640 × 480 pixel display; therefore, the decay of the test stimulus at the vertical scan frequency was less than 1.5 ms from the maximum. Peak-to-peak timing error of the interstimulus intervals (ISI) was <3%.
Age-related increases in ocular media density affect the absolute and relative intensity of the broadband CRT phosphors at the retina in a complex manner. With a model of age-related lens density change,31–33 we estimated these effects after equating the phosphors by heterochromatic flicker photometry (described in Subsection 2.D.2). An overall reduction in stimulus intensity due to age-related increases in ocular media has little effect on our results because we measured (logarithmic) contrast detection thresholds. For L-, M-, and S-cone stimulation, however, relative discrepancies between R, G, and B phosphors may introduce error in the calculated S-cone stimulation. The amounts of this relative discrepancy (using the nomogram of Pokorny et al.33) in terms of L-, M-, and S-cone log trolands are −0.011, 0.024, and 0.034, respectively, for a theoretical 80-year-old observer compared with a standard observer (32 years old). These values are lower for a theoretical 60-year-old observer (L-, M-, and S-cone log trolands =−0.004, 0.007, and −0.010, respectively). Thus, the accuracy of S-cone modulation in this study was sufficient even for the relatively broadband phosphors of the CRT, provided that the heterochromatic flicker photometry (HFP) and the tritan line were measured accurately.
D. Procedures
1. Tritan Stimuli
Two rectangular patches (2° × 2°) were superimposed on a 420 nm background (12°) following 5 min adaptation to the 420 nm field alone. The chromaticity of the two patches were complementary around the white point (equal-energy) and were set as far apart in chromaticity space as possible within the gamut of the monitor. The subject’s task was to match the two patches by adjusting the intensity of one of the patches and the angle of the tri-tan line pivoted around the white point (thereby changing the chromaticity of both patches simultaneously). This match was determined five times and the average angle defined the coordinates of the tritan line.
The stimuli used for determining the tritan line were viewed foveally, but the two-pulse thresholds were measured in the perifovea. As a control, additional data were obtained using four small test patches corresponding to the size and locations of the test stimuli used for threshold measurements while fixation was directed to a central cross. It was found that the tritan pairs were not significantly different from those obtained with foveal viewing.
2. Heterochromatic Flicker Photometry
The CRT phosphors were equated by HFP using an annular stimulus (0.64° –2.77°) that encompassed the four possible locations used for measuring two-pulse thresholds. Following practice in free view, testing was carried out using the bite bar. Flicker (15 Hz) settings were obtained for the three phosphor combinations (R–G, G–B, B–R). The accuracy of the settings was checked by comparison of the intensity ratio from one combination measured directly (for example B–R) and the expected ratio calculated for the two other combinations (R–G and G–B). The mean error was 1.5% ±0.67%, although for several observers it was slightly below 10%.
3. Two-Pulse Thresholds
Each session began after 5 min dark adaptation and 5 min adaptation to a 10 cd/m2 equal-energy white background. Subjects were then presented with a stimulus preceded by a high-pitched tone and followed by a low-pitched tone. The task was to indicate in which of four quadrants the stimulus was detected by pressing one of four correspondingly arranged buttons. This four-alternative forced-choice (4AFC) task was combined with a two-down, one-up staircase in which staircases for each interstimulus interval (ISI) were interleaved. Thresholds for each ISI were based on the last four of six reversals corresponding to a 70.7% probability of detection. This was repeated in at least four to six sessions per observer.
The stimulus was a chromaticity change in one Gaussian patch from equal-energy white along the individually determined tritan line. The change was a double pulse (6.7 ms with ISI from 20 to 360 ms) in which the two flashes were modulated equally in chromaticity at constant luminance toward blue, resulting in increased S-cone excitation. Additional frames were sometimes used to define each pulse because of insufficient energy in the blue phosphor in a single frame. Eighteen of 20 subjects over 64 years of age required three frames; one of the 20 who required only one frame was a normal phakic observer and one was an intraocular lens (IOL) control subject. Of subjects younger than 64 years, only eight of 31 used three frames.
3. RESULTS
A. Tritan Metamers
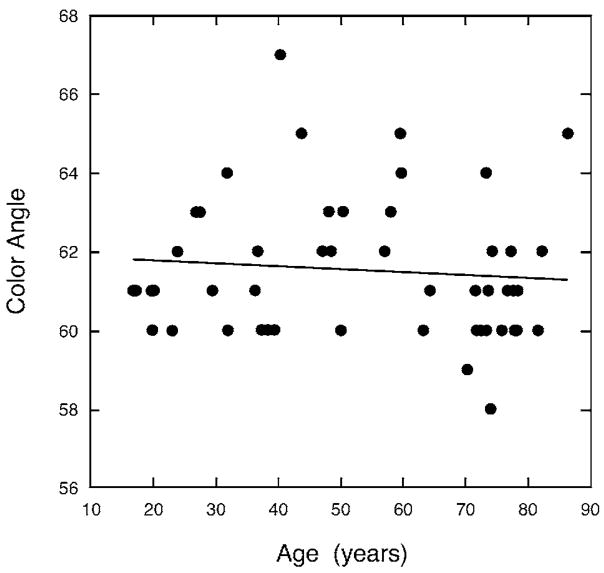
Figure 1 shows the color angle of tritan metamers for all observers plotted as a function of age. The slope of the regression line was not significantly different from zero, a result that parallels our previous study of 30 observers for whom we measured tritan metamers using monochromatic stimuli superimposed on a 420 nm adapting field.34 In the latter study, the spectral location and range of tritan matches was similar to that obtained by Wright with six tritanopic observers.35 These comparisons imply that we successfully suppressed S-cone responses when measuring individual tritan lines. The color angle required to produce tritan metamers varied substantially among observers and it is clear that many observers would not accept the tritan lines of other observers, attesting to the importance of determining individual tritan lines for purposes of this study.
Fig. 1.
Color angle required for a match of complementary colors rotated with respect to a white point (metameric with equal-energy white) when superimposed on a 420 nm adapting field.
B. Double-Pulse Thresholds and Calculation of the Impulse-Response Function
IRFs were calculated from the threshold data using the model of Burr and Morrone6 in which the impulse response follows an exponentially damped frequency-modulated sine wave:
| (1) |
where I(t) is the impulse response as a function of time t and parameters a0–3 are positive with a0 defining the overall gain, a1 the fundamental frequency of oscillation, a2 the modulation frequency over time, and a3 the steepness of the decay. H(t) is the Heaviside function to ensure that I(t) begins with a value of 0 when t<0. Thus,
The four parameters a0–3 were varied using a least-squares criterion; in this way the IRF could be fitted without any assumptions about the number of excitatory or inhibitory phases. This model has the advantage of fewer free parameters than other models of the IRF. It does not require the assumption that the impulse response is derived from a minimum-phase filter,10,11,36 although this assumption may be incorporated by setting a2 =0.
Following the methods described in our previous paper on the IRF for luminance modulation,2 the fitted functions were based on a model of probability summation of visual response,36 R(t,τ):
| (2) |
where τ is the stimulus onset asynchrony {ISI is [τ-(pulse duration)]} and H(t) is the Heaviside function. K is the S-cone excitation level scaled as S-cone luminance of each pulse over the background S-cone luminance and p, proportion correct, is
| (3) |
Parameter r is the probability due to chance (0.25 in this experiment), and parameter β, which determines the steepness of the psychometric function, was set to 4. T is the time to take the integral and must be long enough that the response will be zero within the ISIs tested. We set T to 3.18 s. The proportion correct at threshold, p0, was , which is determined by the two-down, one-up procedure in the 4AFC method that we employed. From Eqs. (2) and (3), we obtained Eqs. (4) and (5) as
| (4) |
| (5) |
where C is and Δt was set to 1.333 ms. n was changed from 0 to 2385 (3.18 s). In Eq. (5), S-cone luminance of the background becomes 10 S-cone cd/m2 because we employed a 10 cd/m2 equal-energy white as the background.
C. Individual Variation in the S-Cone Impulse Response
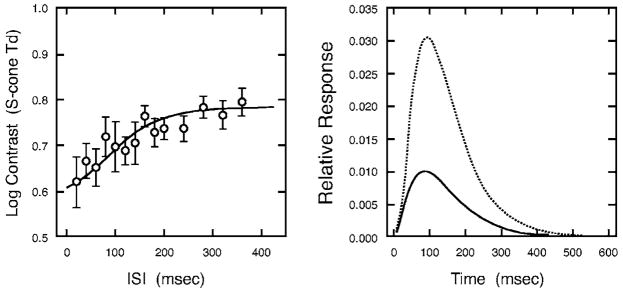
Two-pulse thresholds from a 78-year-old subject are plotted as a function of ISI in the left-hand panel of Fig. 2. The solid curve in the right panel shows the corresponding IRF calculated from the model. The IRF is monophasic and the duration is protracted compared to the biphasic and triphasic IRFs that characterize response to an achromatic double pulse. The time to the peak is ~85.3 ms, compared with 21.3 ms with luminance modulation (shown in Ref. 2, Fig. 7). With luminance modulation, the first excitatory phase is followed by an inhibitory phase making the excitatory duration easy to define. For the S-cone IRF, the duration of the excitatory phase was operationally defined as the value on the descending slope corresponding to 5% of the peak amplitude.
Fig. 2.
Left panel shows contrast threshold in S-cone trolands as a function of ISI for an older observer (78.3 years). Threshold data were double pulses separated by varying ISIs. Error bars denote ±1 SEM (standard error of the means). The solid curve in the right panel illustrates the impulse-response function fitted to the threshold data. The dotted curve denotes the responses based on the sum of 3 successive frames. The summed curve was used for model fitting. The solid curve shows the calculated impulse-response function for a single frame.
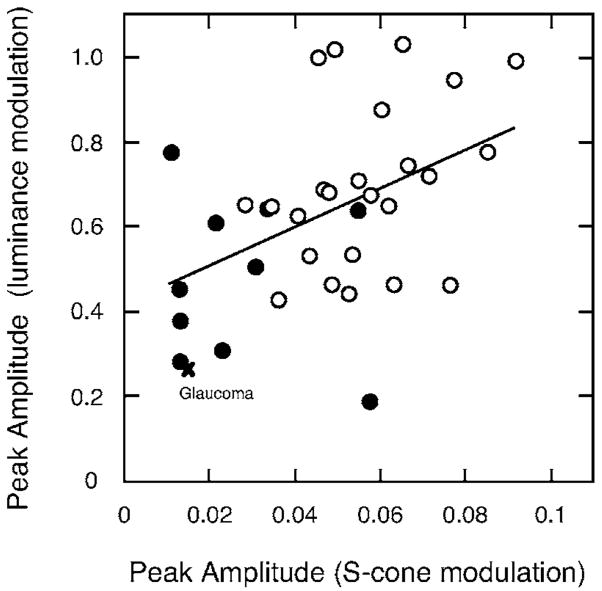
Fig. 7.
Peak amplitude of the impulse response for luminance modulation plotted as a function of peak amplitude for S-cone modulation. Open and closed circles denote observers ≤70 or >70 years, respectively. The solid line denotes the least-squares linear regression line based on all observers except for the × (glaucoma patient).
For some observers, particularly older observers, it was not possible to obtain sufficient S-cone modulation in a double pulse defined by single frames because of the luminance limit of the CRT phosphors. In such cases, we defined each pulse as one series of three successive frames of the IRF calculated as the summation of S-cone IRFs with a time delay equal to each frame (6.67 ms frame rate). This summation IRF is shown by the dotted curve in Fig. 2. This method of measurement and calculation assuming linear summation is justified because the double-pulse method itself has to employ this assumption to obtain the IRFs.
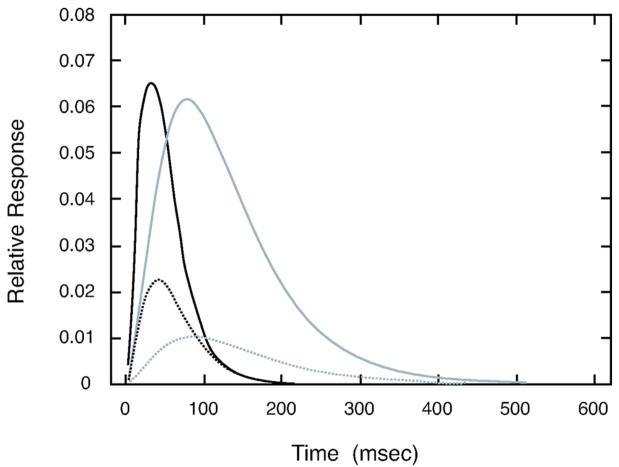
Figure 3 illustrates S-cone IRFs for younger (19.8 and 29.4 years) and older observers (73.3 and 74.3 years). The time to peak amplitude and the duration do not differ much between the younger and older observers, although there are clear differences within groups. The amplitudes are substantially lower in the older observers.
Fig. 3.
S-cone IRFs of typical younger and older observers. Black and gray solid curves denote IRFs of younger observers (29.4 and 19.8 years, respectively). Black and gray dotted curves denote IRFs of older observers (74.3 and 73.3 years, respectively).
D. Age-Related Change in the S-Cone Impulse Response
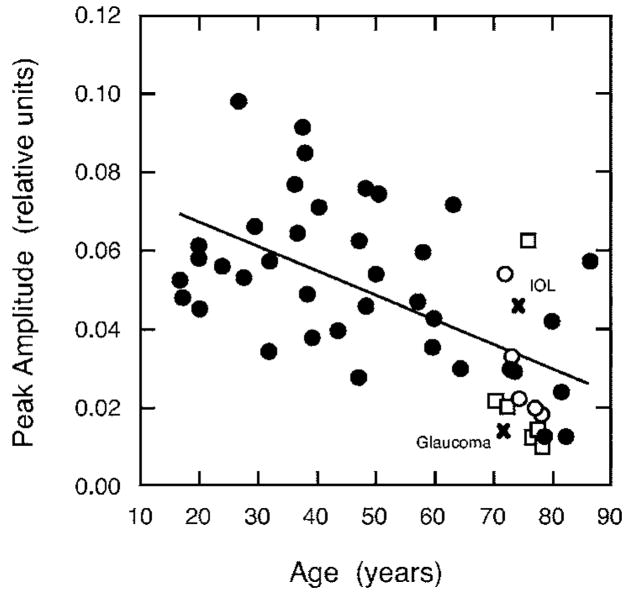
The raw data imply a senescent decrement in IRF amplitude, as there was an age-related increase in thresholds averaged over three of the longest ISIs (280, 320, and 360 ms). The relation between peak IRF amplitude and age is shown in Fig. 4. The regression equation was fitted using all points except for the pseudophake and the glaucoma patient. There was a significant negative correlation between S-cone IRF amplitude and age (r=−0.59, F1,47 =24.90, p<0.001). This was a 44.2% (0.355 log unit) change in amplitude over the age range tested.
Fig. 4.
Peak amplitude of the S-cone impulse response as a function of age. Solid line denotes the least-squares linear regression line for all observers except the two denoted by the × (for IOL or glaucoma patients). Open circles and squares denote those older observers with shorter and longer durations (as illustrated in Fig. 5), respectively.
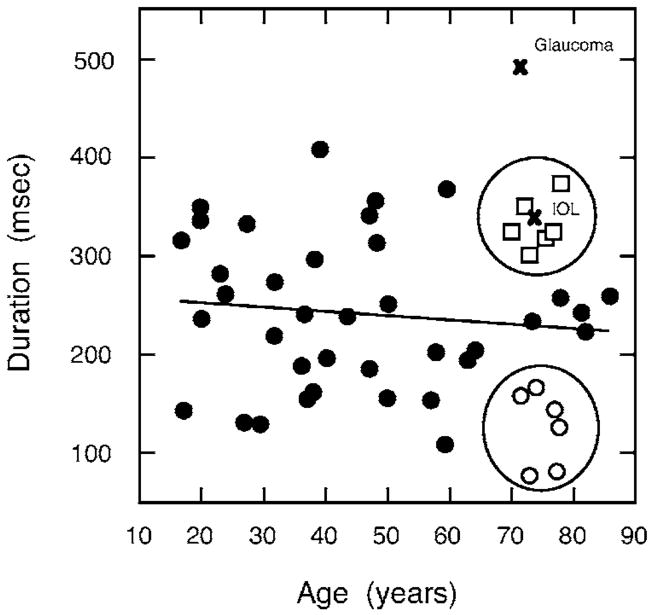
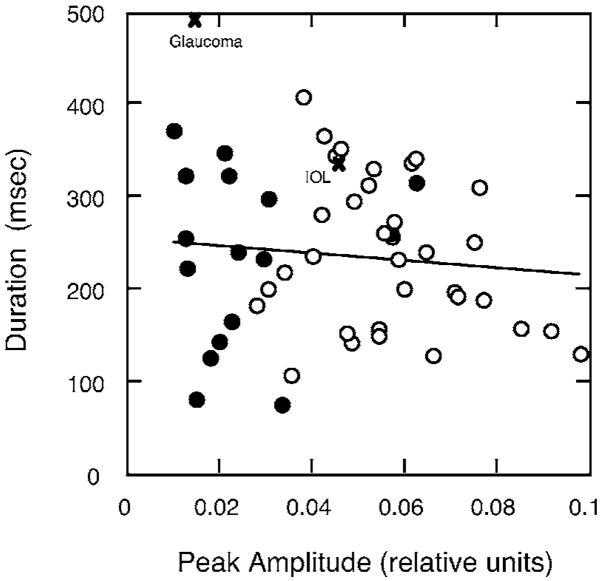
Figures 5 and 6 show that the duration of the S-cone IRF was not correlated with age or with amplitude. In Figs. 4 and 5, observers with shorter and longer IRF durations are denoted by circles and squares, respectively, in order to facilitate comparison of parameters for older observers. Comparison of these older observers is consistent with the conclusion that S-cone IRF amplitude and duration are uncorrelated.
Fig. 5.
Duration of the S-cone impulse response (defined by 5% of the peak) as a function of age. The solid line denotes the least-squares linear regression for all observers except the two denoted by the × (IOL and glaucoma patient). Open circles and squares denote older observers with shorter and longer IRF durations, respectively.
Fig. 6.
S-cone IRF duration plotted as a function of peak amplitude. Open and closed circles denote observers ≤70 or >70 years, respectively. The solid line denotes the least-squares linear regression line based on all observers except the two denoted by the × (IOL and glaucoma patients).
E. Relation between Impulse Response Functions for S-Cone and Luminance Modulation
There were 32 subjects who participated in both this study and our previous study using luminance-modulated stimuli.2 Figures 7 and 8 compare the amplitude and duration, respectively, of the two types of IRF. As can be seen in Fig. 7, there is a positive correlation between S-cone IRF and luminance IRF amplitude, independent of age. The linear regression was statistically significant (r=0.46, F1,30=8.168, p =0.0077).
Fig. 8.
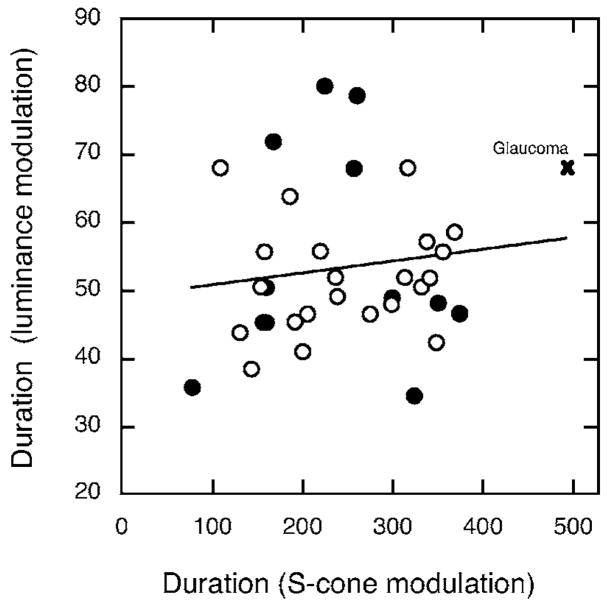
Duration of the impulse response for luminance modulation (first phase) plotted as a function of duration for S-cone modulation (5% of peak). Open and closed circles denote observers ≤70 or >70 years, respectively. The solid line denotes the least-squares linear regression line based on all observers except for the × (glaucoma patient).
Figure 8 shows the duration of the luminance IRF plotted as a function of the duration of the S-cone IRF. All points were included in the regression analysis except for the × representing a glaucoma patient. The correlation was not statistically significant and none of the variance in the duration of the luminance IRF can be accounted for by variation in the S-cone IRF. This is consistent with processing of the two IRFs by separate neural pathways. As we proposed in our previous research,2 the longer integration of a luminance pathway in a subgroup of elderly observers reduces sensitivity loss at a cost to temporal resolution, but this kind of age-related compensation is not observed in the S-cone pathway.
F. Implications for Temporal Contrast Sensitivity
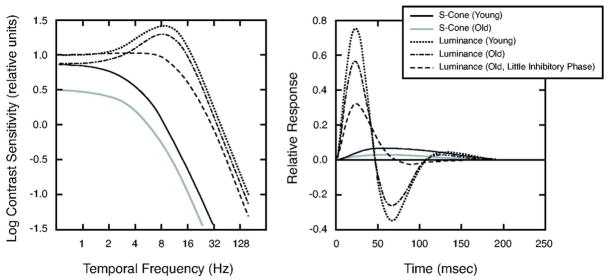
Parameters from the regression equations were used to define S-cone IRFs for theoretical younger and older observers, ages 20 and 80 years, respectively. These IRFs are shown in the right panel of Fig. 9. These functions may be compared with IRFs for luminance modulation as shown in our previous paper. In the latter paper, we found some elderly observers with little inhibitory phase, so this type of observer is shown separately from observers with normal inhibitory phase.
Fig. 9.
Left panel shows contrast sensitivity as a function of temporal frequency for an S-cone pathway of theoretical 20-year-old (black curve) and 80-year-old (gray curve) observers. The same panel shows tCSFs measured with luminance modulation (from Ref. 2): dotted, dotted–dashed, and dashed curves denote the tCSF for theoretical 20-year old and 80 year-old observers with normal and little secondary (inhibitory) phase, respectively. Right panel shows the theoretical IRFs used to generate these tCSFs calculated from the model equation. Curves are plotted as in the left panel.
For a linear system, these IRFs can be transformed to the tCSF by the inverse Fourier transform. These derived tCSFs are shown in the left panel of Fig. 9. The tCSFs for chromatic modulation are lowpass while the tCSF’s for luminance modulation are bandpass except for the elderly observer with little inhibitory phase. For both chromatic and luminance tCSFs, the major difference between younger and older observers is in the amplitude. However, translation of the curves on the amplitude axis also results in shifts in the high-temporal-frequency cutoff. As a result, older observers will have lower cutoffs for both luminance and S-cone modulation.
4. DISCUSSION
The S-cone IRFs were in all cases unimodal. The data are consistent with detection by a slow, lowpass temporal pathway rather than through a more brisk achromatic pathway that S-cones may access under some conditions.22,23 Unlike previous studies with the two-pulse method using short-wave stimuli,11,17 the modulation in this study was restricted to an S-cone pathway because of the use of individual tritan pairs presented at constant luminance. There were significant age-related losses in S-cone IRF amplitude, but no significant correlation between age and S-cone IRF duration.
The S-cone IRFs observed in this study were not compared with M- and L-cone IRFs under conditions of detection through a chromatic pathway. It is known that the chromatic tCSF tends to be lowpass rather than bandpass,13,14 but there is scant evidence for differences among chromatic channels measured with isoluminant stimuli.16–18 As mentioned, however, these studies did not use modulation along a tritan line to isolate an S-cone pathway. Burr and Morrone6 measured IRFs with red–green isoluminant gratings and the time to the peak was 53 ms, substantially faster than our S-cone IRFs with a time to peak of 85 ms. This difference does not appear to be due to differences in methods; indeed, the time to the first peak with achromatic stimuli was 26 ms for Burr and Marrone compared with 21 ms in our previous study.2 The difference between the IRFs of these the two studies is consistent with red–green chromatic signals being carried by a parvocellular pathway and S-cone chromatic signals being carried by a slower koniocellular pathway.
In our previous study, we demonstrated that the amplitude of the first phase of the IRF measured with luminance modulation decreased with age, but the time to the first peak was relatively constant with age. The age-correlated loss in amplitude for both types of IRF is likely due to similar changes in sensitivity of all three cone types.26–29 These losses in amplitude are less likely to be due to age-related changes in retinal illuminance because the pupil area was controlled and luminance relations among the phosphors were compensated by equating them through flicker photometry. Thus, we conclude that the age-related losses in amplitude of the S-cone pathway and luminance IRF are largely receptoral or postreceptoral, but not optical.
The low correlation between the two types of IRF duration is expected because the signals from S-cones and achromatic mechanisms are carried by different neural pathways.15 We previously suggested that our IRF conditions with luminance-modulated stimuli favored detection by a magnocellular pathway, whereas substantial electrophysiological evidence supports the view that S-cone signals are carried by a specialized koniocellular pathway originating in the bistratified ganglion cells.37,38 The small diameter of these fibers, and hence slower conduction velocity, is consistent with the slow time course that we observe in the S-cone IRF.
Acknowledgments
This research was supported by Grant-in-Aid for Scientific Research (C)(C-2, 15500147) to K. Shinomori from the Japan Society for the Promotion of Science, by HiTech Research Center Support to the Kochi University of Technology from the Ministry of Education, Culture, Sports, Science and Technology, and to JSW from the National Institute on Aging (grant AG04058), the National Eye Institute (CORE grant EY12576), and a Jules and Doris Stein Professorship from Research to Prevent Blindness.
Contributor Information
Keizo Shinomori, Department of Information Systems Engineering, Kochi University of Technology, 185 Miyanokuchi, Tosayamada-town, Kami-city, Kochi 782-8502, Japan.
John S. Werner, University of California, Davis, Department of Ophthalmology and Vision Science, 4860 Y Street, Suite 2400, Sacramento, California 95817
References
- 1.Kim CBY, Mayer MJ. Flicker sensitivity in healthy aging eyes. II. Cross-sectional aging trends from 18 through 77 years of age. J Opt Soc Am A. 1994;11:1958–1969. doi: 10.1364/josaa.11.001958. [DOI] [PubMed] [Google Scholar]
- 2.Shinomori K, Werner JS. Senescence of the temporal impulse response to a luminous pulse. Vision Res. 2003;43:617–627. doi: 10.1016/S0042-6989(03)00009-9. [DOI] [PMC free article] [PubMed] [Google Scholar]
- 3.Kline D, Scheiber H. Visual persistence and temporal resolution. In: Sekuler R, Kline D, Dismukes K, Liss AR, editors. Aging and Human Visual Function. 1982. pp. 231–244. [Google Scholar]
- 4.Weale RA. In: A Biography of the Eye. Lewis HK, editor. 1982. [Google Scholar]
- 5.Ikeda M. Temporal summation of positive and negative flashes in the visual system. J Opt Soc Am. 1965;55:1527–1534. [Google Scholar]
- 6.Burr DC, Morrone MC. Impulse-response functions for chromatic and achromatic stimuli. J Opt Soc Am A. 1993;10:1706–1713. [Google Scholar]
- 7.Bowen RW. Two pulses seen as three flashes: a superposition analysis. Vision Res. 1989;29:409–417. doi: 10.1016/0042-6989(89)90005-9. [DOI] [PubMed] [Google Scholar]
- 8.Lee BB, Pokorny J, Smith VC, Kremers J. Responses to pulses and sinusoids in macaque ganglion cells. Vision Res. 1994;34:3081–3096. doi: 10.1016/0042-6989(94)90074-4. [DOI] [PubMed] [Google Scholar]
- 9.Benardete EA. PhD dissertation. The Rockefeller University; 1994. Functional dynamics of primate retinal ganglion cells. [Google Scholar]
- 10.Swanson WH, Ueno T, Smith VC, Pokorny J. Temporal modulation sensitivity and pulse-detection thresholds for chromatic and luminance perturbations. J Opt Soc Am A. 1987;4:1992–2005. doi: 10.1364/josaa.4.001992. [DOI] [PubMed] [Google Scholar]
- 11.Uchikawa K, Yoshizawa T. Temporal responses to chromatic and achromatic change inferred from temporal double-pulse integration. J Opt Soc Am A. 1993;10:1697–1705. [Google Scholar]
- 12.Eskew RT, Stromeyer CF, III, Kronauer RE. Temporal properties of the red-green chromatic mechanism. Vision Res. 1994;34:3127–3137. doi: 10.1016/0042-6989(94)90078-7. [DOI] [PubMed] [Google Scholar]
- 13.Regan D, Tyler CW. Some dynamic features of colour vision. Vision Res. 1971;11:1307–1324. doi: 10.1016/0042-6989(71)90013-7. [DOI] [PubMed] [Google Scholar]
- 14.Kremers J, Lee BB, Kaiser PK. Sensitivity of macaque retinal ganglion cells and human observers to combined luminance and chromatic temporal modulation. J Opt Soc Am A. 1992;9:1477–1485. doi: 10.1364/josaa.9.001477. [DOI] [PubMed] [Google Scholar]
- 15.Kaplan E. The M, P, and K pathways of the primate visual system. In: Chalupa LM, Werner JS, editors. The Visual Neurosciences. MIT Press; 2004. pp. 481–493. [Google Scholar]
- 16.Smith VC, Bowen RW, Pokorny J. Threshold temporal integration of chromatic stimuli. Vision Res. 1984;24:653–660. doi: 10.1016/0042-6989(84)90206-2. [DOI] [PubMed] [Google Scholar]
- 17.Uchikawa K, Ikeda M. Temporal integration of chromatic double pulses for detection of equal-luminance wavelength changes. J Opt Soc Am A. 1986;3:2109–2115. doi: 10.1364/josaa.3.002109. [DOI] [PubMed] [Google Scholar]
- 18.Yoshizawa T, Uchikawa K. Temporal integration characteristics of chromatic response as determined by use of the isoluminant double-pulse method. J Opt Soc Am A. 1997;14:2069–2080. [Google Scholar]
- 19.Schnapf JL, Nunn BJ, Meister M, Baylor DW. Visual transduction in cones of the monkey Macaca Fascicularis. J Physiol (London) 1990;427:681–713. doi: 10.1113/jphysiol.1990.sp018193. [DOI] [PMC free article] [PubMed] [Google Scholar]
- 20.Brindley GS, Du Croz JJ, Rushton WAH. The flicker fusion frequency of the blue-sensitive mechanism of colour vision. J Physiol (London) 1966;183:497–500. doi: 10.1113/jphysiol.1966.sp007879. [DOI] [PMC free article] [PubMed] [Google Scholar]
- 21.Kelly DH. Spatio-temporal frequency characteristics of color-vision mechanisms. J Opt Soc Am. 1974;64:983–990. doi: 10.1364/josa.64.000983. [DOI] [PubMed] [Google Scholar]
- 22.Stockman A, Plummer DJ. Color from invisible flicker: a failure of the Talbot-Plateau law caused by an early ‘hard’ saturating nonlinearity used to partition the human short-wave cone pathway. Vision Res. 1998;38:3703–3728. doi: 10.1016/s0042-6989(98)00049-2. [DOI] [PubMed] [Google Scholar]
- 23.Stockman A, MacLeod DIA, DePriest DD. The temporal properties of the human short-wave photoreceptors and their associated pathways. Vision Res. 1991;31:189–208. doi: 10.1016/0042-6989(91)90111-h. [DOI] [PubMed] [Google Scholar]
- 24.Lee J, Stromeyer CF., III Contribution of human short-wave cones to luminance and motion detection. J Physiol (London) 1989;413:563–593. doi: 10.1113/jphysiol.1989.sp017669. [DOI] [PMC free article] [PubMed] [Google Scholar]
- 25.Wisowaty JJ, Boynton RM. Temporal modulation sensitivity of the blue mechanism: Measurements made without chromatic adaptation. Vision Res. 1980;20:895–909. doi: 10.1016/0042-6989(80)90071-1. [DOI] [PubMed] [Google Scholar]
- 26.Eisner A, Fleming SA, Klein ML, Mauldin WM. Sensitivities in older eyes with good acuity: cross-sectional norms. Invest Ophthalmol Visual Sci. 1987;28:1824–1831. [PubMed] [Google Scholar]
- 27.Werner JS, Steele VG. Sensitivity of human foveal color mechanisms throughout the life span. J Opt Soc Am A. 1988;5:2122–2130. doi: 10.1364/josaa.5.002122. [DOI] [PubMed] [Google Scholar]
- 28.Johnson CA, Adams AJ, Twelker JD, Quigg JM. Age-related changes in the central visual field for short-wavelength-sensitive pathways. J Opt Soc Am A. 1988;5:2131–2139. doi: 10.1364/josaa.5.002131. [DOI] [PubMed] [Google Scholar]
- 29.Werner JS, Bieber ML, Schefrin BE. Senescence of foveal and parafoveal cone sensitivities and their relations to macular pigment density. J Opt Soc Am A. 2000;17:1918–1932. doi: 10.1364/josaa.17.001918. [DOI] [PMC free article] [PubMed] [Google Scholar]
- 30.Westheimer G. The Maxwellian view. Vision Res. 1966;6:669–682. doi: 10.1016/0042-6989(66)90078-2. [DOI] [PubMed] [Google Scholar]
- 31.van Norren D, Vos JJ. Spectral transmission of the ocular media. Vision Res. 1974;15:749–751. doi: 10.1016/0042-6989(74)90222-3. [DOI] [PubMed] [Google Scholar]
- 32.Werner JS. Development of scotopic sensitivity and the absorption spectrum of the human ocular media. J Opt Soc Am. 1982;72:247–258. doi: 10.1364/josa.72.000247. [DOI] [PubMed] [Google Scholar]
- 33.Pokorny J, Smith VC, Lutze M. Aging of the human lens. Appl Opt. 1995;26:1437–1440. doi: 10.1364/AO.26.001437. [DOI] [PubMed] [Google Scholar]
- 34.Schefrin BE, Shinomori K, Werner JS. Contributions of neural pathways to age-related losses in chromatic discrimination. J Opt Soc Am A. 1995;12:1233–1241. doi: 10.1364/josaa.12.001233. [DOI] [PubMed] [Google Scholar]
- 35.Wright WD. The characteristics of tritanopia. J Opt Soc Am. 1952;42:509–521. doi: 10.1364/josa.42.000509. [DOI] [PubMed] [Google Scholar]
- 36.Watson AB. Probability summation over time. Vision Res. 1979;19:515–522. doi: 10.1016/0042-6989(79)90136-6. [DOI] [PubMed] [Google Scholar]
- 37.Dacey DM. Morphology of small-field bistratified ganglion cells type in the macaque and human retina. Visual Neurosci. 1993;10:1081–1098. doi: 10.1017/s0952523800010191. [DOI] [PubMed] [Google Scholar]
- 38.Dacey DM, Lee BB. The ‘blue-on’ opponent pathway in primate retina originates from a distinct bistratified cell type. Nature (London) 1994;367:731–735. doi: 10.1038/367731a0. [DOI] [PubMed] [Google Scholar]


