

Summary
Raman spectroscopy can provide unique information on the evolution of structure in proteins over a wide range of time-scales; the picosecond to millisecond range can be accessed with pump-probe techniques. Specific parts of the molecule are interrogated by tuning the probe laser to a resonant electronic transition, including the UV transitions of aromatic residues and of the peptide bond. Advances in laser technology have enabled the characterization of transient species at an unprecedented level of structural detail. Applications to protein unfolding and allostery are reviewed.
Introduction
The dynamics of protein conformation change are of great current interest. The focus of this review is on the investigation of protein dynamics with UV resonance Raman (UVRR) spectroscopy (see [1–3] for reviews of the technique). Transient structures can be generated on short time-scales, using laser pulses to perturb the protein via photochemistry or temperature jumps (T-jumps). Among the optical techniques that can monitor these transients, including absorption or emission of light in the UV/visible or infrared region, Raman scattering is unique in its structural information content. The molecular vibrations represented in the Raman spectrum are sensitive to conformation and to non-covalent interactions. Additionally, resonance enhancement can select out vibrations arising from different structural elements of the protein. When the Raman laser is tuned to an electronic transition, signals are amplified for vibrations of the chemical groups on which the electronic transition is localized. Figure 1 illustrates the dramatic changes in the Raman spectrum of hemoglobin (Hb) as the laser wavelength is tuned from 419 nm, where the heme prosthetic group absorbs, to 229 nm, where the aromatic residues tyrosine (Tyr) and tryptophan (Trp) dominate, to 197 nm, where the amide backbone and phenylalanine (Phe) residues are dominant contributors. Wavelength tuning provides Raman spectroscopy with both sensitivity and structural selectivity.
Figure 1.

a) Transition diagram for Raman scattering (ν0 is the laser frequency, and νs is the scattered frequency; νv is the frequency of a vibrational transition). When the laser wavelength is tuned to resonance with an electronic transition (S0 − S1), the Raman intensity is enhanced for chromophore vibrations. b) Absorption spectrum of HbCO, highlighting the heme, aromatic residue and amide absorption bands. c) Laser excitation within these bands yields RR spectra dominated by the respective chromophores.
Protein Unfolding
With deep UV excitation, RR spectroscopy becomes a powerful tool for protein folding studies, via enhancement of the amide vibrations of the polypeptide backbone [4–21]. Fast unfolding and refolding processes can be initiated by a laser-induced T-jump [4, 22–26]. Asher and coworkers were the first to apply UVRR spectroscopy to laser T-jump transients of a polypeptide [4].
The enhanced RR bands [5,6] include amide I (~1650 cm−1), which is primarily C=O stretching in character, amide S (~1380 cm−1), which involves bending of the C -H bond, and amide II (~1580 cm−1) and III (~1250 cm−1), which are mixtures of C-N stretching and N-H bending coordinates; amide III and S also contain significant C-C stretching and C-H bending character, and are therefore particularly sensitive to local conformation of the amide links [7,8]. Thus, Mikhonin et al. [9] were able to establish a correlation between the amide III band position and the Ramachandran Ψ angle, using a set of defined peptide structures. Aside from its greater sensitivity (protein concentrations of ~10 μM are suitable for study), UVRR spectroscopy has the particular advantage over IR spectroscopy that the amide III region is accessible, whereas IR spectroscopy is limited to the amide I region, due to overlap with sidechain vibrations and absorption by solvent H2O (or D2O). Secondary structure can be monitored via the intensities of resolved UVRR components of the amide III and S spectral envelopes, or by least squares fitting, over all four amide regions, with secondary structure spectra determined from crystallographically characterized protein sets [7,8].
T-jump/UVRR studies have provided fresh insight into the mechanism of helix melting [4,10,11] and in particular on the issue of activation energy. In T-jump/UVRR spectroscopy, an infrared laser pulse, tuned to a vibrational overtone absorption band of H2O or D2O rapidly heats an aqueous sample, thereby perturbing the structure of dissolved protein. The subsequent evolution of this structure is monitored by a UV probe pulse to obtain the UVRR spectrum. The temperature coefficients of the measured melting rates were small, in contrast to the substantial coefficients reported from T-jump/FTIR studies [10]. However, a prompt melting signal, too fast to resolve (< 40 ns) had a large temperature coefficient, indicating that a fast enthalpic phase preceded the subsequent (~100–200 ns for short α-helical peptides) entropic phase. These two phases were suggested to involve initial inter-residue H-bond breaking and subsequent melting via bond rotation [10]. The FTIR response, relying on amide I, is more temperature sensitive because it is weighted toward H-bond breaking, since the C=O vibrators are coupled by the inter-residue H-bonds. The UVRR response, being more local in character, is able to distinguish the two steps in the mechanism. Additional complexity is revealed when different regions of the peptide are separately monitored using isotopic labels to shift the amide frequencies. Mikhonin et al. found different temperature dependencies of the melting rate for the middle and end peptide bonds, an effect they attributed to incursion of 310-helix and π-bulge structures toward the ends of the helical peptide [11].
UVRR spectroscopy revealed two melting phases, with Tm = 10 and 42 °C, for the nic-GCN4 structure, in which two α-helical peptides are coiled around each other [Figure 2] [12, 27]. Quite different time-constants, 0.2 and 15 μs, were obtained for T-jumps in the two phases. The shorter time is similar to that of short α-helical peptides and was attributed to hydrated regions of the coiled-coil, while the much slower time was attributed to interior, unhydrated regions [12].
Figure 2.
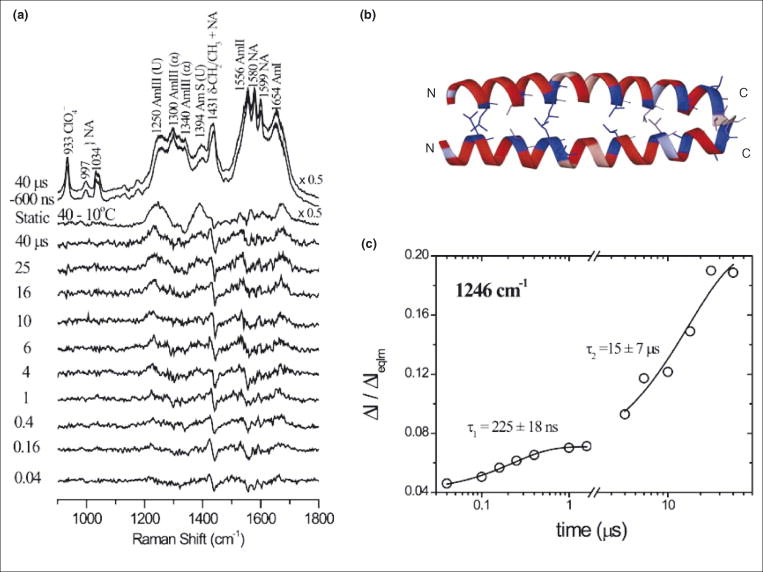
a) Pump – probe 197 nm UVRR difference spectra of nic-GCN4 (nicotinamide derivative of a GCN4 model peptide, nic-GCN4-p23′), at the indicated time delays following a 10 – 38 °C T-jump, showing the evolution of the amide bands (α = α-helix, U = unordered, NA = nicotinamide). b) Ribbon diagram of the GCN4-p1 coiled-coil dimer [27]. c) Time course of the 1246 cm−1 peak intensity (ΔI/ΔIeqlm = intensity change relative to difference in equilibrium intensity between initial and final temperatures) associated with the unordered structure following a 4 – 32 °C (τ1 = 225 ns) or 10 – 38 °C (τ2 = 15 μs) T-jump. The two time constants are assigned to the melting of hydrated and unhydrated helical regions.
Complex behavior was also found for poly-lysine, a model system for α-helix/β-sheet conversion in proteins. At high pH and temperature (>30°C) poly-lysine exhibits this transition, which is slow (minutes) and irreversible. A T-jump through the transition temperature yielded a 0.25 μs melting time constant, as expected for hydrated α-helix. However, only ~2 % of the helix content was lost, out to the 3 μs time limit of the experiment, consistent with irreversible β-sheet formation from a small melted population, well below the true helix melting temperature [13]. In addition, a prompt spectral change suggested a shift in melted structures from the PPII (poly-proline II-like) to a β-strand conformation. A mechanism was proposed in which H-bonding between β-strand conformations nucleates the formation of β-sheet.
UVRR spectroscopy is also useful in characterizing slow protein conformation changes. Lednev and coworkers have evaluated the mechanism of lysozyme fibril formation by applying 2D correlation techniques to UVRR data obtained over many hours as the protein slowly forms fibrillar β-sheets [14].
Globular proteins have also been studied with the T-jump/UVRR methodology. Apomyoglobin exhibits helix melting in the tens of microseconds regime, and the rate increases as the pH is lowered from 5.5 to 4.0, consistent with destabilization of the AGH helical core of the protein via protonation of a pair of buried histidines (Figure 3). Relaxation of the Trp response was twice as fast as helix melting at pH 4.0, suggesting initial displacement of the A helix, which contains one of the two Trp residues [15].
Figure 3.

a) Ribbon diagram of the apoMb structure, showing the AGH helical core, which remains intact at pH 4. b) T-jump/UVRR time courses at pH 4, showing (amide signals) partial melting of the core, and faster relaxation for the Trp signal, suggesting prior motion of the Trp-containing A helix [15].
UVRR analysis of cytochrome c unexpectedly showed initiation of β-sheet formation, at the expense first of turns and then of helices as the protein is heated at pH 3 (Figure 4b). The process is reversible, provided the protein concentration is kept below 100 μM, and a β-sheet rise time of 2.2 μs is observed, following a T-jump [16]. Coincident with β-sheet formation, peroxidase activity is induced, and the heme converts to a high-spin state. The mechanism was proposed to involve extension of a short β-sheet segment that flanks the ‘40s Ω loop’ in the native structure (Figure 4a) into the loop itself, when an anchoring H-bond (His126-Pro44) is disrupted by heating at pH 3. Residues on either end of the 40s Ω loop, Thr49 and Trp59, form H-bonds to the heme propionate substituents, which could exert force on the heme, leading to displacement of the endogenous heme ligand, Met 80, and allowing access to peroxide, when the loop conformation is altered. This process may play a physiological role in apoptosis, since binding to cardiolipin induces peroxidase activity in cytochrome c, producing cardiolipin hydroperoxides that are required for release of pro-apoptotic factors [16].
Figure 4.

a) Ribbon diagram for the cytochrome c structure. A short β-sheet flanking the 40s Ω loop (orange) is suggested to extend into the loop itself, when the H26…P44 H-bond is weakened at pH 3, accounting for the temperature-induced conversion of turn and helix content into β-sheet, b) Temperature profiles were obtained by least squares fitting of the UVRR amide regions to standard secondary structure spectra [16].
Allostery
Allosteric proteins change their shape and thereby modify function in response to a signal, such as light absorption, or binding of ions or molecules. Since changes in secondary structure are often minimal, the amide vibrational modes might not offer useful probes, for either IR or UVRR spectroscopy. However, aromatic residue UVRR signals can monitor tertiary changes, particularly since they are sensitive to solvent exposure. Also Tyr and Trp signals, which are selectively enhanced via excitation near 230 nm can monitor the status of tertiary H-bonds.
Thus Mathies and coworkers applied picosecond pump/probe UVRR spectroscopy to the visual pigment, rhodopsin, finding a prompt Trp signal and a slightly delayed (~5 ps) Tyr signal [28]. These were attributed to the sidechain of Trp265 moving away from a stacking contact with the β-ionone ring of the isomerizing retinal chromophore, and subsequent movement of Tyr268 away from the C10–C12 region. These observations suggest that activation of rhodopsin occurs via steric contacts that push retinal away from helix 6, on which Trp265 and Tyr268 reside, and toward helix 3, on the opposite side, as a result of photo-induced isomerization.
In another study of a photo-activated protein, Chen and Barry applied UVRR spectroscopy to photosystem II, using spatially separated pump (325 nm) and probe (229 or 244 nm) cw lasers focused on a flowing jet of sample [29]. The pump-probe difference spectrum showed bands whose frequencies suggested intermediates involving reduced quinones and tyrosine radicals.
Extensive studies of Hb, the paradigmatic allosteric protein, have been carried out with 20 ns UV probe pulses, electronically delayed from 20 ns visible wavelength pump pulses to photolyze the CO adduct, HbCO, yielding a transient deoxy-heme photoproduct in the R quaternary state, which then relaxes to the equilibrium T state, before bimolecular recombination of the CO to regenerate HbCO [30]. The Tyr and Trp signals (Figure 5a) have been assigned by isotopic substitution [31], and reveal a sequence of structural changes en route to the T state.
Figure 5.

a) Pump-probe 229 nm UVRR difference spectra of the HbCO photoproduct at the indicated time delays, showing the evolution of Tyr and Trp signals. b) Ribbon diagram of the α1 and β2 subunits in deoxyHb, showing Trpβ37 and Tyrα42 quaternary H-bonds at the hinge and switch contacts. These are formed in sequence, after initial deligation-induced rotation of the EF helix ‘clamshells’, breaking A…E and F…G interhelical H-bonds (involving W14 and Y140 in the α subunit, and W15 and Y145 in the β subunit [30].)
In the sub-microsecond regime the UVRR spectra reflect intra-subunit tertiary motions. The first of these (~0.07 μs) has been attributed to a concerted rotation of the proximal F and distal E helices, which hold the heme in a ‘clamshell’ [30] (Figure 5b). Deligation converts the heme to a high-spin state, driving the Fe atom out of the heme plane and exerting downward force on the F helix, while departure of the ligand from the binding pocket permits collapse of the E helix toward the heme. This motion is signaled by negative UVRR signals from both Trp and Tyr, due to breaking of tertiary H-bonds between the A and E helices on the one hand, and the F and G helices on the other (Figure 5b). A similar clamshell rotation can be seen in myoglobin (Mb), when high-resolution crystal structures of deoxyMb and MbCO are compared [32], and has been detected dynamically in a picosecond pump-probe UVRR study of Mb [33]. A QM/MM computational study has confirmed that the EF helix clamshell rotation is a consequence of heme deligation in Mb [34]. In Hb, the clamshell rotation is followed by motion of the A and G helices to re-form the interhelical H-bonds, as signaled by disappearance of the negative signals prior (~0.7 μs) to the formation of quaternary contacts [30]. This motion may initiate the quaternary rotation via electrostatic forces at the N- and C-termini, which form salt-bridges in the T structure.
The T quaternary contacts at the critical α1β2 subunit interface (Figure 5b) are formed in the microsecond regime. First (~2 μs) the subunits rotate into position to form the ‘hinge’ contacts between the β subunit C-helix and the α subunit FG corner, as signaled by H-bond formation from Trpβ37. Later (~20 μs) the ‘switch’ contacts between the α subunit C-helix and the β subunit FG corner close, as signaled by H-bond formation from Tyrα42. Friedman and coworkers have shown that these processes can be monitored on a much slower time scale by encapsulating Hb in sol-gel matrices [35,36].
Recent results with site-mutants add interesting dimensions to this picture. Thus elimination of the A…E interhelical H-bonds, via hydrophobic substitutions of the H-bond acceptors, has no effect on ligand affinity or cooperativity, but accelerates ‘hinge’ contact formation 10-fold, while decelerating ‘switch’ contact formation 2-fold [37]. Thus the energy barriers for intermediate formation are modulated by the interhelical H-bonds, although the energy difference between initial and final states remains unaltered. Remarkably the same rate effects are seen if the H-bond is eliminated in either the α or the β subunits, or in both. This observation suggests tight coupling between the internal motions across the α1β1 dimer interface, consistent with other evidence for cooperativity within αβ dimers in Hb tetramers [38,39]. Elimination of the F…G interhelical H-bonds has more complex effects, but again these are similar for H-bond elimination in either the α or the β subunits, or in both, providing further evidence for intradimer coupling [40].
Conclusions
Because of its sensitivity and structural selectivity, UVRR spectroscopy can provide unique insight into protein dynamics. When the dynamics involve changes in tertiary contacts, primarily, as in allosteric transitions, selective excitation (~230 nm) of Trp and Tyr residues can monitor details of the pathway. Applications to Hb, rhodopsin and photosystem II illustrate the potential of the technique. When secondary structure changes occur, as in protein folding, these can be elucidated via excitation (~200 nm) of the amide backbone. The most promising applications may be to functionally relevant local unfolding events, as exemplified by the reversible β-sheet-associated peroxidase induction discovered recently for cytochrome c [16]. Interest in such applications is continuing to drive the development of new instrumentation [41].
Acknowledgments
The work referenced from this laboratory was supported by National Institutes of Health grant GM 12526.
Footnotes
Publisher's Disclaimer: This is a PDF file of an unedited manuscript that has been accepted for publication. As a service to our customers we are providing this early version of the manuscript. The manuscript will undergo copyediting, typesetting, and review of the resulting proof before it is published in its final citable form. Please note that during the production process errors may be discovered which could affect the content, and all legal disclaimers that apply to the journal pertain.
References
*of special interest
**of outstanding interest
- 1.Austin JC, Jordan T, Spiro TG. Ultraviolet resonance Raman studies of proteins and related model compounds. In: Clark RJH, Hester RE, editors. Biomolecular Spectroscopy, Part A. John Wiley and Sons Ltd; 1993. pp. 55–127. Advances in Spectroscopy, vol 20. [Google Scholar]
- 2.Asher SA. UV resonance Raman studies of molecular structure and dynamics: applications in physical and biophysical chemistry. Ann Rev Phys Chem. 1988;39:537–588. doi: 10.1146/annurev.pc.39.100188.002541. [DOI] [PubMed] [Google Scholar]
- 3.Kitagawa T. Investigation of higher order structures of proteins by ultraviolet resonance Raman spectroscopy. Progr Biophys Molec Biol. 1992;58:1–18. doi: 10.1016/0079-6107(92)90009-u. [DOI] [PubMed] [Google Scholar]
- 4.Lednev IK, Karnoup AS, Sparrow MC, Asher SA. Alpha-helix peptide folding and unfolding activation barriers: A nanosecond UV resonance Raman study. J Am Chem Soc. 1999;121:8074–8086. [Google Scholar]
- 5.Wang Y, Purrello R, Jordan T, Spiro TG. UVRR spectroscopy of the peptide-bond. 1 Amide S, a nonhelical structure marker, is a CαH bending mode. J Am Chem Soc. 1991;113:6359–6368. [Google Scholar]
- 6.Song SH, Asher SA. UV resonance Raman studies of peptide conformation in poly(l-lysine), poly(l-glutamic acid), and model complexes - the basis for protein secondary structure determinations. J Am Chem Soc. 1989;111:4295–4305. [Google Scholar]
- **7.Huang C-Y, Balakrishnan G, Spiro TG. Protein secondary structure from deep-UV resonance Raman spectroscopy. J Raman Spectrosc. 2006;37:277–282. Establishes standard secondary structure contributions to 197 nm UVRR spectra of proteins, similar to those reported in [8] for 206 nm UVRR spectra. [Google Scholar]
- 8.Chi ZH, Chen XG, Holtz JSW, Asher SA. UV resonance Raman-selective amide vibrational enhancement: Quantitative methodology for determining protein secondary structure. Biochemistry. 1998;37:2854–2864. doi: 10.1021/bi971160z. [DOI] [PubMed] [Google Scholar]
- **9.Mikhonin AV, Bykov SV, Myshakina NS, Asher SA. Peptide secondary structure folding reaction coordinate: Correlation between UV Raman amide III frequency, Ψ Ramachandran angle, and hydrogen bonding. J Phys Chem B. 2006;110:1928–1943. doi: 10.1021/jp054593h. Demonstrates a quantitative relationship between the amide III3 frequency and the Ramachandran Ψ angle, and to the strength of the hydrogen bonds to the amide group. [DOI] [PubMed] [Google Scholar]
- *10.Balakrishnan G, Hu Y, Bender GM, Getahun Z, DeGrado WF, Spiro TG. Enthalpic and entropic stages in α-helical peptide unfolding, from laser T-jump/UV Raman spectroscopy. J Am Chem Soc. 2007;129:12801–12808. doi: 10.1021/ja073366l. Detection of a prompt T-dependent and slower T-independent phases leads to a helix-melting model in which H-bond breaking precedes bond rotation. [DOI] [PMC free article] [PubMed] [Google Scholar]
- 11.Mikhonin AV, Asher SA, Bykov SV, Murza A. UV Raman spatially resolved melting dynamics of isotopically labeled polyalanyl peptide: Slow α-helix melting follows 310-helices and π-bulges premelting. J Phys Chem B. 2007;111:3280–3292. doi: 10.1021/jp0654009. [DOI] [PubMed] [Google Scholar]
- 12.Balakrishnan G, Hu Y, Case MA, Spiro TG. Microsecond melting of a folding intermediate in a coiled-coil peptide, monitored by T-jump/UV Raman spectroscopy. J Phys Chem B. 2006;110:19877–19883. doi: 10.1021/jp061987f. [DOI] [PubMed] [Google Scholar]
- 13.JiJi RD, Balakrishnan G, Hu Y, Spiro TG. Intermediacy of poly(L-proline) II and β-strand conformations in poly(L-lysine) β-sheet formation probed by temperature-jump/UV resonance Raman spectroscopy. Biochemistry. 2006;45:34–41. doi: 10.1021/bi051507v. [DOI] [PMC free article] [PubMed] [Google Scholar]
- *14.Shashilov VA, Lednev IK. 2D correlation deep UV resonance Raman spectroscopy of early events of lysozyme fibrillation: kinetic mechanism and potential interpretation pitfalls. J Am Chem Soc. 2008;130:309–317. doi: 10.1021/ja076225s. 2D correlation deep UVRR uses the cross-correlation between amide bands to deconvolute highly overlapped UVRR bands thereby identifying individual secondary structure components and their time evolution. [DOI] [PubMed] [Google Scholar]
- *15.Huang CY, Balakrishnan G, Spiro TG. Early events in apomyoglobin unfolding probed by laser T-jump/UV resonance Raman spectroscopy. Biochemistry. 2005;44:15734–15742. doi: 10.1021/bi051578u. Demonstrates the unique capability of T-jump coupled UVRR spectroscopy to monitor the aromatic sidechains as well as the backbone, providing a more complete picture than has previously been available for the mechanism apomyoglobin unfolding. [DOI] [PubMed] [Google Scholar]
- 16.Balakrishnan G, Hu Y, Oyerinde OF, Su J, Groves JT, Spiro TG. A conformational switch to β-sheet structure in cytochrome c leads to heme exposure. Implications for cardiolipin peroxidation and apoptosis. J Am Chem Soc. 2007;129:504–505. doi: 10.1021/ja0678727. [DOI] [PMC free article] [PubMed] [Google Scholar]
- 17.Balakrishnan G, Hu Y, Nielsen SB, Spiro TG. Tunable kHz deep ultraviolet (193–210 nm) laser for Raman applications. Appl Spectrosc. 2005;59:776–781. doi: 10.1366/0003702054280702. [DOI] [PubMed] [Google Scholar]
- 18.Bykov S, Lednev I, Ianoul A, Mikhonin A, Munro C, Asher SA. Steady-state and transient ultraviolet resonance Raman spectrometer for the 193–270 nm spectral region. Appl Spectrosc. 2005;59:1541–1552. doi: 10.1366/000370205775142511. [DOI] [PubMed] [Google Scholar]
- 19.Mikhonin AV, Asher SA. Direct UV Raman monitoring of 310-helix and π-bulge premelting during α-helix unfolding. J Am Chem Soc. 2006;128:13789–13795. doi: 10.1021/ja062269+. [DOI] [PubMed] [Google Scholar]
- 20.Ma L, Ahmed Z, Mikhonin AV, Asher SA. UV resonance Raman measurements of poly-L-lysine’s conformational energy landscapes: Dependence on perchlorate concentration and temperature. J Phys Chem B. 2007;111:7675–7680. doi: 10.1021/jp0703758. [DOI] [PubMed] [Google Scholar]
- 21.Shashilov V, Xu M, Ermolenkov VV, Fredriksen L, Lednev IK. Probing a fibrillation nucleus directly by deep ultraviolet Raman spectroscopy. J Am Chem Soc. 2007;129:6972–6973. doi: 10.1021/ja070038c. [DOI] [PubMed] [Google Scholar]
- **22.Balakrishnan G, Hu Y, Spiro TG. Temperature-jump apparatus with Raman detection based on a solid-state tunable (1.80–2.05 μm) kHz optical parametric oscillator laser. Appl Spectrosc. 2006;60:347–351. doi: 10.1366/000370206776593799. Describes the implementation of a novel high-repetition (1 kHz) rate T-jump/UVRR apparatus. [DOI] [PubMed] [Google Scholar]
- 23.Gruebele M, Sabelko J, Ballew R, Ervin J. Laser temperature jump induced protein refolding. Acc Chem Res. 1998;31:699–707. [Google Scholar]
- 24.Callender R, Dyer RB. Probing protein dynamics using temperature jump relaxation spectroscopy. Curr Opp Struct Biol. 2002;12:628–633. doi: 10.1016/s0959-440x(02)00370-6. [DOI] [PubMed] [Google Scholar]
- 25.Callender R, Dyer RB. Advances in time-resolved approaches to characterize the dynamical nature of enzymatic catalysis. Chem Rev. 2006;106:3031–3042. doi: 10.1021/cr050284b. [DOI] [PubMed] [Google Scholar]
- 26.Chen EF, Wen YX, Lewis JW, Goldbeck RA, Kliger DS, Strauss CEM. Nanosecond laser temperature-jump optical rotatory dispersion: Application to early events in protein folding/unfolding. Rev Sci Inst. 2005:76. [Google Scholar]
- 27.Oshea EK, Klemm JD, Kim PS, Alber T. X-Ray Structure of the Gcn4 Leucine Zipper, a 2-Stranded, Parallel Coiled Coil. Science. 1991;254:539–544. doi: 10.1126/science.1948029. [DOI] [PubMed] [Google Scholar]
- *28.Kim JE, Pan D, Mathies RA. Picosecond dynamics of G-protein coupled receptor activation in rhodopsin from time-resolved UV resonance Raman spectroscopy. Biochemistry. 2003;42:5169–5175. doi: 10.1021/bi030026d. Describes the first application of picosecond time-resolved UVRR spectroscopy, monitoring the protein response to retinal chromophore isomerization in the visual pigment rhodopsin. [DOI] [PMC free article] [PubMed] [Google Scholar]
- 29.Chen J, Barry BA. Ultraviolet resonance Raman microprobe spectroscopy of photosystem II. Photochem Photobiol. 2008;84:815–818. doi: 10.1111/j.1751-1097.2008.00298.x. [DOI] [PubMed] [Google Scholar]
- **30.Balakrishnan G, Case MA, Pevsner A, Zhao X, Tengroth C, McLendon GL, Spiro TG. Time-resolved absorption and UV resonance Raman spectra reveal stepwise formation of T quaternary contacts in the allosteric pathway of hemoglobin. J Mol Biol. 2004;340:843–856. doi: 10.1016/j.jmb.2004.05.012. Refines the UVRR-derived allosteric reaction coordinate of hemoglobin. Improved spectral and time resolution of the UVRR system with 229 nm excitation allowed identification of a new intermediate in the R-T allosteric pathway of Hb, establishing two well-separated steps on formation of the T-state quaternary contacts. [DOI] [PubMed] [Google Scholar]
- 31.Hu XH, Spiro TG. Tyrosine and tryptophan structure markers in hemoglobin ultraviolet resonance Raman spectra: Mode assignments via subunit-specific isotope labeling of recombinant protein. Biochemistry. 1997;36:15701–15712. doi: 10.1021/bi971136l. [DOI] [PubMed] [Google Scholar]
- 32.Kachalova GS, Popov AN, Bartunik HD. A steric mechanism for inhibition of CO binding to heme proteins. Science. 1999;284:473–476. doi: 10.1126/science.284.5413.473. [DOI] [PubMed] [Google Scholar]
- *33.Sato A, Gao Y, Kitagawa T, Mizutani Y. Primary protein response after ligand photodissociation in carbonmonoxy myoglobin. Proc Natl Acad Sci USA. 2007;104:9627–9632. doi: 10.1073/pnas.0611560104. Describes time-resolved UVRR studies with 3.3 ps time resolution, using site-mutants of myoglobin to show that initial protein structural changes initiated by heme deligation are transmitted through two pathways involving movements of the E and F helices. [DOI] [PMC free article] [PubMed] [Google Scholar]
- 34.Gaullar V, Jarzecki AA, Friesner RA, Spiro TG. Modeling of ligation-induced helix/loop displacements in myoglobin: toward an understanding of hemoglobin allostery. J Am Chem Soc. 2006;128:5427–5435. doi: 10.1021/ja057318h. [DOI] [PubMed] [Google Scholar]
- 35.Samuni U, Dantsker D, Juszczak LJ, Bettati S, Ronda L, Mozzarelli A, Friedman JM. Spectroscopic and functional characterization of T state hemoglobin conformations encapsulated in silica gels. Biochemistry. 2004;43:13674–13682. doi: 10.1021/bi048531d. [DOI] [PubMed] [Google Scholar]
- 36.Samuni U, Roche CJ, Dantsker D, Juszczak LJ, Friedman JM. Modulation of reactivity and conformation within the T-quaternary state of human hemoglobin: the combined use of mutagenesis and sol-gel encapsulation. Biochemistry. 2006;45:2820–2835. doi: 10.1021/bi050010i. [DOI] [PMC free article] [PubMed] [Google Scholar]
- 37.Balakrishnan G, Tsai C-H, Wu Q, Case MA, Pevsner A, McLendon GL, Ho C, Spiro TG. Hemoglobin site-mutants reveal dynamical role of interhelical H-bonds in the allosteric pathway: time-resolved UV resonance Raman evidence for intra-dimer coupling. J Mol Biol. 2004;340:857–868. doi: 10.1016/j.jmb.2004.05.013. [DOI] [PubMed] [Google Scholar]
- 38.Ackers GK, Holt JM, Huang YW, Grinkova Y, Klinger AL, Denisov I. Confirmation of a unique intra-dimer cooperativity in the human hemoglobin α1β1 half-oxygenated intermediate supports the symmetry rule model of allosteric regulation. Protein Struct Funct Genet. 2000:23–43. doi: 10.1002/1097-0134(2000)41:4+<23::aid-prot30>3.0.co;2-d. [DOI] [PubMed] [Google Scholar]
- 39.Ramadas N, Rifkind JM. Molecular dynamics of human methemoglobin: The transmission of conformational information between subunits in an αβ dimer. Biophys J. 1999;76:1796–1811. doi: 10.1016/S0006-3495(99)77340-6. [DOI] [PMC free article] [PubMed] [Google Scholar]
- 40.Kneipp J, Balakrishnan G, Chen R, Shen T-J, Sahu SC, Ho NT, Giovannelli JL, Simplaceanu V, Ho C, Spiro TG. Dynamics of allostery in hemoglobin: roles of the penultimate tyrosine H bonds. J Mol Biol. 2006;356:335–353. doi: 10.1016/j.jmb.2005.11.006. [DOI] [PubMed] [Google Scholar]
- 41.Kubo M, Uchida T, Nakashima S, Kitagawa T. Construction of a subnanosecond time-resolved, high-resolution ultraviolet resonance Raman measurement system and its application to reveal the dynamic structures of proteins. Appl Spectrosc. 2008;62:30–37. doi: 10.1366/000370208783412573. [DOI] [PubMed] [Google Scholar]