Abstract
Purpose
To quantify the type, frequency and magnitude of artifacts in four-dimensional (4D) CT images acquired using a multislice cine method.
Methods and Materials
Fifty consecutive patients, who underwent 4D-CT scanning and radiotherapy for thoracic or abdominal cancers, were included in this study. All the 4D-CT scans were performed on the GE multislice PET/CT scanner with the Varian RPM system in cine mode. The GE Advantage 4D software was used to create 4D-CT data sets. The artifacts were then visually and quantitatively analyzed. We further performed statistical analyses to evaluate the relationships between patient- or breathing pattern-related parameters and the occurrence as well as magnitude of artifacts.
Results
It was found that 45 of 50 patients (90%) had at least one artifact (other than blurring) with a mean magnitude of 11.6 mm (range, 4.4 – 56.0 mm) in the diaphragm or heart. We also observed at least one artifact in 6 of 20 lung or mediastinal tumors (30%). Statistical analysis revealed that there were significant differences between several breathing pattern-related parameters, including abdominal displacement (p < 0.01), for the subgroups of patients with and without artifacts. The magnitude of an artifact was found to be significantly but weakly correlated with the abdominal displacement difference between two adjacent couch positions (R = 0.34, p < 0.01).
Conclusions
This study has identified that the frequency and magnitude of artifacts in 4D-CT is alarmingly high. Significant improvement is needed in 4D-CT imaging.
Keywords: Four-dimensional (4D) CT, Artifact, Respiratory motion, 4D radiotherapy, Radiotherapy
Introduction
It has been well recognized that respiratory motion diminishes the accuracy of radiotherapy in the processes of imaging (1-4), treatment planning (5) and radiation delivery (6-8). If respiratory motion is not taken into account, it leads to artifacts in the images. Many investigators reported significant distortions of moving organs in CT images (1, 3, 4, 9), which can result in a systematic error in subsequent treatment processes, including target definition and dosimetry. Such artifacts can be mitigated by using methods that account for respiratory motion, including respiratory gating, breath-hold, and four-dimensional (4D) CT. With 4D-CT images, one can assess 3D tumor motion and directly incorporate that information into treatment planning. Since the first developments using single slice helical scan (10, 11), 4D-CT scans have been acquired using different methods (12-15) and clinically implemented (16) by many investigators. Two types of approaches have been commonly used to retrospectively sort 4D-CT images: phase-based sorting (10-12, 17) and displacement-based sorting (16, 18-20).
Even with 4D-CT imaging, the current acquisition and reconstruction methods can still lead to artifacts (16, 18-24). For example, Pan et al. (24) showed discontinuities in the diaphragm and heart, which were due to an inaccurate determination of respiratory phases. The current procedures generate a 4D-CT data set by assembling CT slices that have the nearest phase or displacement to the target one for all positions. There are often mismatches in the phase or displacement between adjacent couch positions, which could manifest as artifacts in the images. Several authors have investigated the approaches to reduce the artifacts in 4D-CT images. Rietzel and Chen (23), Mutaf et al.(21) and Pan et al. (24) improved determination of respiratory phases originally assigned by the Varian Real-time Position Management (RPM) system (Varian Medical Systems, Palo Alto, CA) system using in-house software, which then led to 4D-CT images with fewer artifacts. Studies by several investigators (16, 18-20) have shown that displacement-based sorting performed better than phase-based sorting; however, this method could result in insufficient data at some couch positions if there is no corresponding displacement in the respiratory cycle (20). More recently, Schreibmann et al. (25) and Ehrhardt et al. (22) have developed another approach, which deduces a 3D data set at an arbitrary respiratory phase by interpolating the original CT images using deformable models. Ehrhardt et al. (22) compared the 4D-CT image generated using their method with the original one sorted based on tidal volume, and showed reduction of artifacts. Even with these approaches, residual artifacts still remain. Artifacts in 4D-CT images can affect the delineation of target volume and the shape of beam aperture, and subsequently manifest as systematic errors. It is important to understand the characteristics of artifacts and the limitations of the current procedures for future developments of strategies to improve 4D-CT. However, to date there has been insufficient literature on that.
The purpose of this study was to quantify the type, frequency and magnitude of artifacts in 4D thoracic or abdominal CT images acquired using the multislice cine method. We also performed statistical analyses to evaluate the relationships between patient- or breathing pattern-related parameters and the occurrence as well as magnitude of artifacts.
Methods and Materials
Patients
This study was a retrospective analysis that was approved by our institutional review board. Fifty consecutive patients who underwent 4D-CT scanning and radiotherapy for thoracic or abdominal cancers at Stanford between July 2007 and November 2007 were included in this study. No additional selection criteria were used. Patient parameters, including age, gender, tumor site, Karnofsky performance status (KPS) (26) and smoking history, were recorded by reviewing the medical records.
4D-CT data acquisition and reconstruction
The 4D-CT scans were performed on the GE Discovery ST multislice PET/CT scanner (GE Medical Systems, Waukesha, WI) in cine mode. During the CT scan, patient respiratory traces were acquired using the Varian RPM system, with the marker block placed on the upper abdomen. Before the 4D-CT scan, the respiratory period of each patient was estimated by observing the RPM trace. The data were acquired for a cine duration that was set to 1 s longer than the estimated respiratory period for each couch position. Scan parameters were set as follows: 0.5 s gantry rotation, 0.45 s cine interval, and 2.5 or 1.25 mm slice thickness. Each image reconstruction took 360° of data. In our clinic, audio instruction was given to patients who had irregular breathing patterns, using the audio prompting feature of RPM with a custom audio prompt.
The GE Advantage 4D software was used to retrospectively sort raw 4D-CT cine images into respiratory phase-based bins of 3D CT image data. The RPM system calculates a phase at each point of a respiratory trace, where 0% corresponds to end inspiration. Advantage 4D reads raw 4D-CT cine images as well as the corresponding RPM respiration data file, assigns a phase to each CT slice according to the temporal correlation between the RPM trace and CT data acquisition, and sorts them into ten 3D CT data sets each corresponding to a respiratory phase (i.e., from 0% to 90% phase at 10% intervals) More details of the 4D-CT data acquisition on the GE multislice CT scanner with the Advantage 4D software have been described by Rietzel and Chen (16).
Artifact analysis
The artifacts observed in the 4D-CT images were visually and quantitatively analyzed for type, frequency and magnitude using the Advantage 4D software. Artifacts were recorded by consistently following the procedures shown in Fig. 1. First, the 4D-CT image at the 0% phase was carefully reviewed by scrolling through the coronal views. If artifacts were found, we searched for the coronal view where the artifact was most prominent at the same couch position, and then identified the corresponding coronal level. If no artifacts were observed, we labeled such a case as having no artifact. It is possible that artifacts occur at the location or time that was not covered in our method. This is one of the limitations of our procedure and the results here may therefore underestimate the actual frequency. The next step was to scroll through the respiratory phases at the coronal level identified at the previous step, and record the phase(s) where the artifact existed at the corresponding couch position. Finally, we identified the phase where the artifact was most prominent, and the following information was recorded: type, location and magnitude of the artifact. These procedures were applied to every couch position in the 4D-CT image.
Fig. 1.
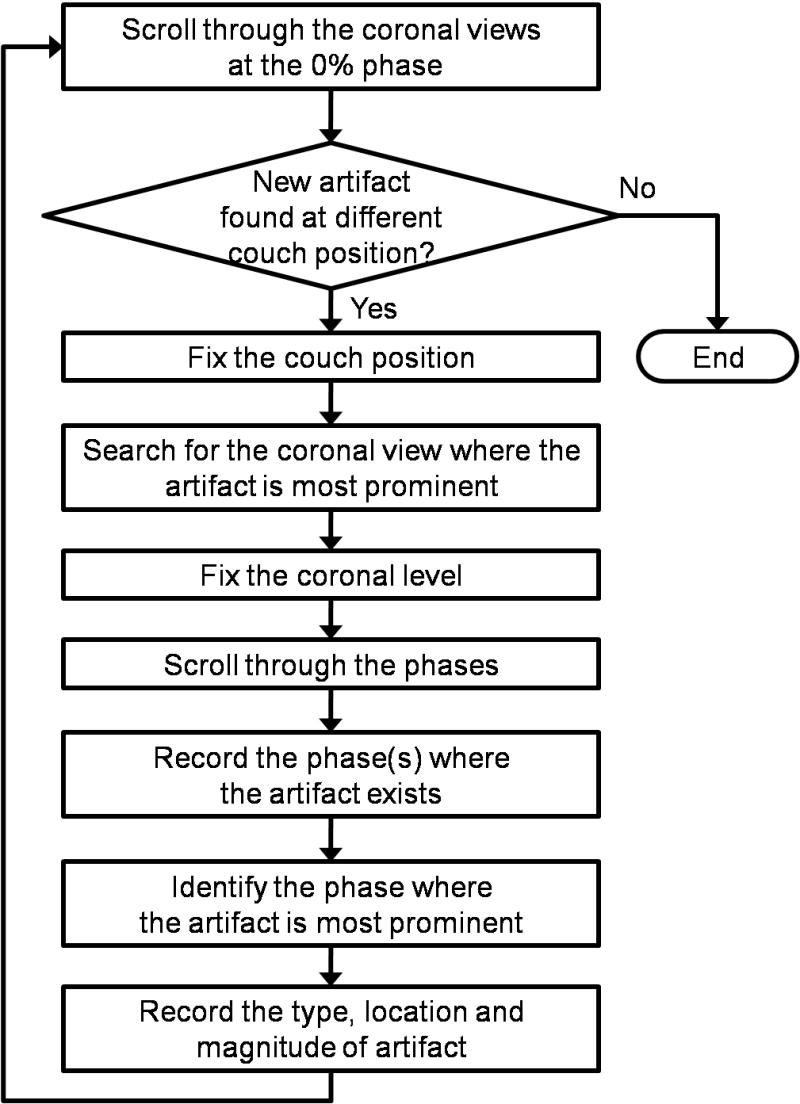
A flow diagram of the method to analyze the artifact in the 4D-CT image.
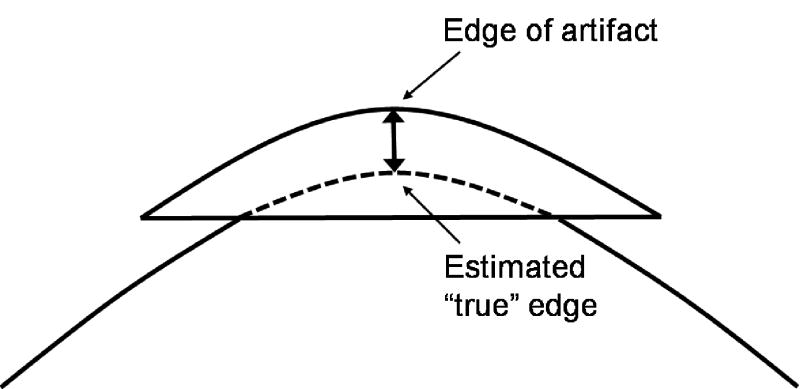
We determined the four types of artifacts through reviewing 4D-CT images: blurring, duplicate structure, overlapping structure, and incomplete structure, which are shown in Fig. 2 with example images and schematic diagrams. The blurring artifact would be due to organ motion faster than the CT gantry rotation speed, and occurs within a couch position unlike other three types of artifacts. All other artifacts occur at an interface between two adjacent couch positions, a possible cause of which is mismatches of respiratory phases or abdominal displacements between them. All the artifacts observed in this study were classified into one of these four types. For the artifacts other than blurring, magnitude was evaluated manually by measuring the distance in the superior-inferior direction between the edge of the artifact and the “true” edge of the organ (Fig. 3). The “true” edge was visually estimated by the observer.
Fig. 2.
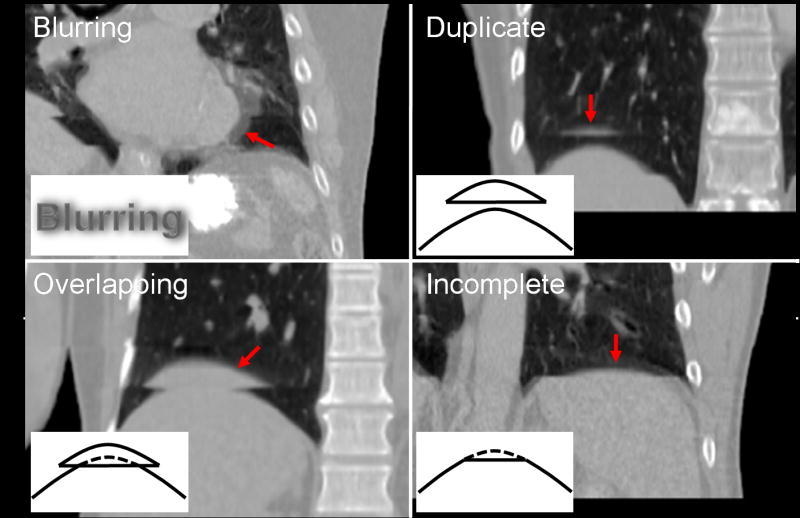
Example 4D-CT images with schematic diagrams for the four types of artifacts: blurring, duplicate structure, overlapping structure and incomplete structure. Corresponding artifacts are indicated by arrows in respective images. Note that other artifacts can also be observed in these images.
Fig. 3.
A schematic diagram of the method to measure the artifact magnitude for the overlapping structure. The “true” edge was visually estimated by the observer. The distance in the superior-inferior direction between the edge of the artifact and the “true” edge of the organ was then measured. Duplicate and incomplete structure artifacts were also measured by the same method.
Statistical analysis
We further performed statistical analyses to evaluate the relationships between the occurrence of artifact and patient- or breathing pattern-related parameters. Note that the blurring artifacts were excluded here since they are not attributed to retrospective sorting methods as described above. The Wilcoxon rank sum test (27) (for numerical parameters, e.g., age) and the chi-square test (27) (for categorical parameters, e.g., gender) were used to compare the parameters for the subgroups of patients with and without artifacts. The Wilcoxon rank sum test essentially tells us whether medians from two independent groups are different (p < 0.05) or not. The chi-square test can be used to test for differences of frequencies in two or more groups. The RPM respiration data file was used to determine the parameters that describe the basic characteristics of the patient's breathing pattern, including abdominal displacement, respiratory period and respiratory irregularity. The respiratory irregularity was defined as the root mean square (RMS) or the maximum difference between the phase-displacement quadratic fit and the actual RPM respiration data. These calculations were directly based on the respiratory trace between the CT scan started and ended, the phases of which were assigned by the RPM system. The diaphragm motion was also evaluated, which was defined as the distance in the superior-inferior direction between the most superior and the most inferior positions of the dome of the diaphragm in the 4D-CT images.
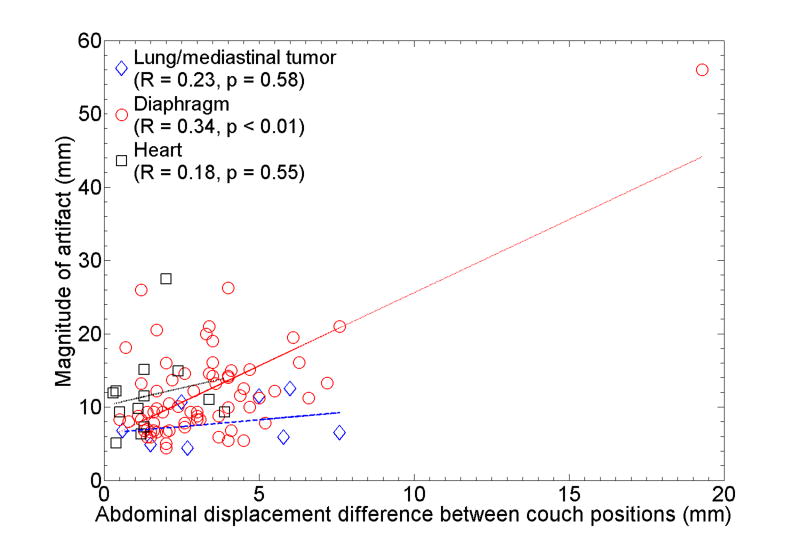
We also investigated the correlations between the magnitude of artifact and difference in abdominal displacement between two adjacent couch positions, in which the corresponding artifact occurred. The Spearman's rank correlation test (27) was used to test the strength of the relationship between two variables and determine whether the correlation between them were different from zero (p < 0.05) or not. We recorded the RPM respiratory information at the moment CT slices were acquired to determine the displacement differences. For both of the magnitude of artifact and the displacement difference, absolute and relative values were investigated. The magnitude of artifact was normalized to the diaphragm motion. The displacement difference was normalized to three types of metrics: maximum, mean and standard deviation (SD) of the abdominal displacement, which were also calculated based on the RPM respiration trace. Through these analyses, we attempted to test the hypothesis that the smaller the abdominal displacement difference the smaller the magnitude of artifact.
Results
Characteristics of patient and breathing pattern
The characteristics of patients and their respiratory motion are described in Table 1. More than half of patients had tumors in the thoracic region. Two of 18 patients with lung or mediastinal cancer had two separate tumors; hence, a total of 20 tumors were included in the artifact analysis. All the 4D-CT images of fifty patients included both the diaphragm and heart. This table shows the diverse nature of the patient breathing patterns observed in this cohort.
Table 1.
The characteristics of the 50-patient cohort and the breathing pattern
| Parameter | Value |
|---|---|
| Age (y/o), median (range) | 66 (25–85) |
| Gender, n (%) | |
| Male | 20 (40.0) |
| Female | 30 (60.0) |
| Tumor site, n (%) | |
| Lung/mediastinum | 18 (36.0) |
| Breast/chest wall | 15 (30.0) |
| Esophagus | 5 (10.0) |
| Pancreas | 4 (8.0) |
| Abdomen | 2 (4.0) |
| Liver | 2 (4.0) |
| Stomach | 2 (4.0) |
| Spleen | 1 (2.0) |
| Multiple sites | 1 (2.0) |
| Karnofsky index, n (%) | |
| >= 80 | 22 (44.0) |
| <= 70 | 9 (18.0) |
| Unspecified | 19 (38.0) |
| Smoker, n (%) | |
| Yes | 26 (52.0) |
| No | 22 (44.0) |
| Unspecified | 2 (4.0) |
| Diaphragm motion (mm), mean (range) | 14.4 (2.4–32.5) |
| Abdominal displacement (mm), mean ± SD (range) | 8.8 ± 4.0 (1.2–38.0) |
| Respiratory period (s), mean ± SD (range) | 4.0 ± 1.7 (1.5–15.5) |
| RMS respiratory irregularity (mm), mean (range) | 1.6 (0.4–3.8) |
| Maximum respiratory irregularity (mm), mean (range) | 7.0 (1.6–16.5) |
Note: The diaphragm motion and other respiratory motion parameters were determined based on the 4D-CT images and the RPM respiration data, respectively. See text for more details of their definitions.
Frequency and magnitude
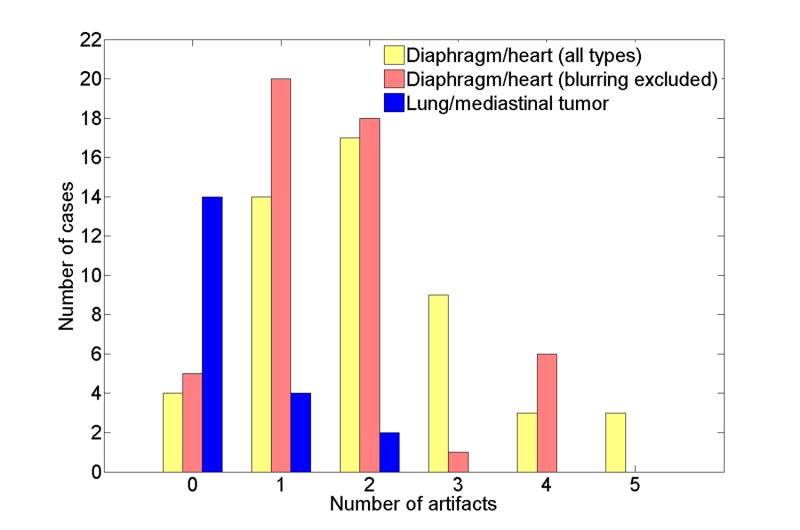
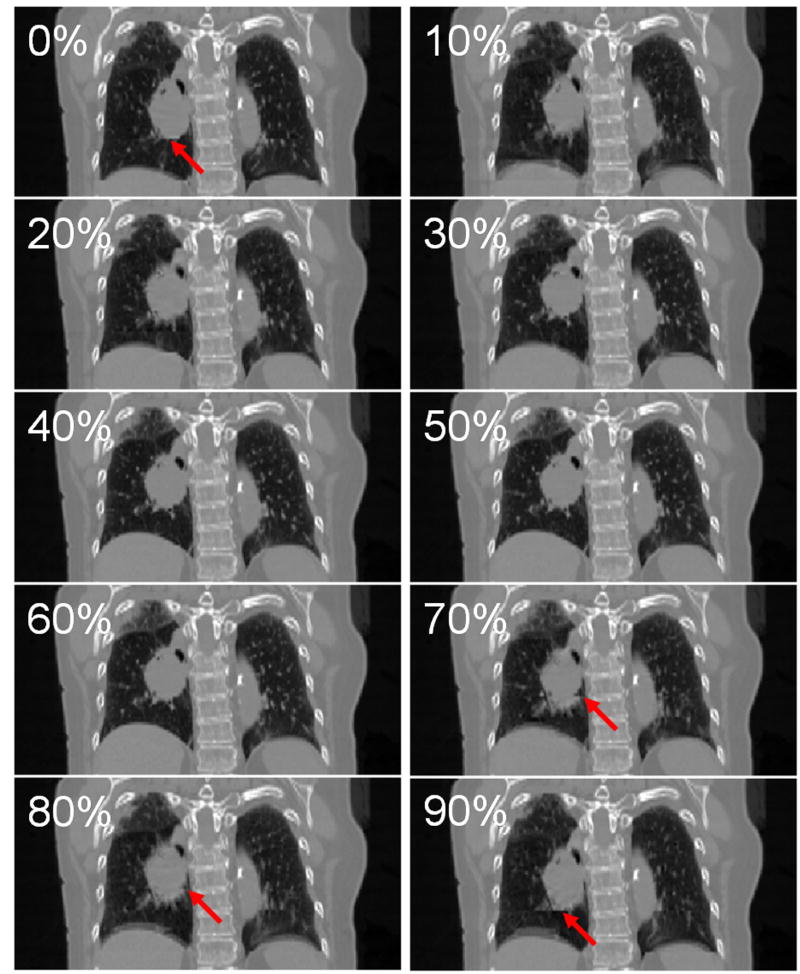
Figure 4 illustrates the frequency distributions of the artifacts in the 4D-CT images. The data are presented with three types of bars: all types of artifacts, those other than blurring observed in the diaphragm or heart for all fifty patients, and all types of tumor artifacts for 18 lung or mediastinal cancer patients (20 tumors). There was no patient with a blurring artifact in the tumor, the bar of which essentially includes only 3 other types of artifacts. Most of patients, i.e., 46 of 50 patients (92%), had at least one artifact in the diaphragm or heart. Even when the blurring artifact was excluded from the frequency, 45 of 50 patients (90%) had at least one of the duplicate structure, overlapping structure, and incomplete structure artifacts. The median number of artifacts was 2 (range, 0-4). We also observed 1 to 2 artifacts in 6 of 20 lung or mediastinal tumors (30%). Figure 5 shows ten 4D-CT coronal views at 0% to 90% respiratory phase for a patient with lung tumor artifacts. It is obvious that both the images at 70% and 80% phases have a discontinuity in the tumor at the interface between two adjacent couch positions. Also, there is insufficient information in the inferior edge of the tumor in the images at 90% and 0% phases.
Fig. 4.
The frequency distributions of all types of artifacts and those other than blurring that were observed in lung (diaphragm) or heart for all 50 patients. The distribution of the artifacts for 20 tumors in 18 patients with lung or mediastinal cancer is also shown.
Fig. 5.
Example 4D-CT images of a patient with lung tumor artifacts: 0%–90% respiratory phase from top to bottom. Images at 0%, 70%, 80% and 90% phases had artifacts as indicated by arrows in respective images. Note that blurring and incomplete structure artifacts can also be observed in the right and left diaphragms, respectively.
Table 2 describes the frequency of artifacts for each anatomical structure in detail. The number of patients with artifacts, other than blurring, in the right diaphragm was significantly larger than that in the left diaphragm (76% vs. 22%, p < 0.01). The difference between the anterior and the posterior regions of diaphragms was also significant (22% vs. 88%, p < 0.01). Note that only the most prominent artifact was recorded for each couch position and there were many cases which had several artifacts at different locations or phases in a particular couch position. On the other hand, no significant difference was found between magnitudes of artifacts for respective anatomical structures, nor for the three types of artifacts (Table 3).
Table 2.
Number of patients with artifacts for respective anatomical structures
| Blurring | Duplicate | Overlapping | Incomplete | >= 1 (other than blurring) | >= 1 (all types) | |
|---|---|---|---|---|---|---|
| Lung/mediastinal tumor | 0/20 (0%) | 2/20 (10%) | 1/20 (5%) | 5/20 (25%) | 6/20 (30%) | 6/20 (30%) |
| Lung (diaphragm) | ||||||
| Right/anterior | 0 (0%) | 3 (6%) | 2 (4%) | 2 (4%) | 7 (14%) | 7 (14%) |
| Right/posterior | 3 (6%) | 5 (10%) | 18 (36%) | 26 (52%) | 36 (72%) | 36 (72%) |
| Right/overall | 3 (6%) | 8 (16%) | 20 (40%) | 28 (56%) | 38 (76%) | 38 (76%) |
| Left/anterior | 1 (2%) | 3 (6%) | 0 (0%) | 1 (2%) | 4 (8%) | 5 (10%) |
| Left/posterior | 0 (0%) | 2 (4%) | 5 (10%) | 3 (6%) | 8 (16%) | 8 (16%) |
| Left/overall | 1 (2%) | 5 (10%) | 5 (10%) | 4 (8%) | 11 (22%) | 12 (24%) |
| Lung (diaphragm)/overall | 4 (8%) | 13 (26%) | 25 (50%) | 32 (64%) | 44 (88%) | 44 (88%) |
| Heart | 15 (30%) | 0 (0%) | 6 (12%) | 7 (14%) | 7 (14%) | 18 (36%) |
| Total | 19 (38%) | 13 (26%) | 25 (50%) | 37 (74%) | 45 (90%) | 46 (92%) |
Note: Percentages relative to the total number of tumors in lung or mediastinum are presented for the tumor artifacts.
Table 3.
Magnitude of artifacts for respective anatomical structures (in millimeters)
| Duplicate | Overlapping | Incomplete | Total | |||||
|---|---|---|---|---|---|---|---|---|
| Mean | Range | Mean | Range | Mean | Range | Mean | Range | |
| Lung/mediastinal tumor | 11.6 | 10.7–12.5 | 6.5 | 6.5–6.5 | 6.7 | 4.4–11.5 | 7.9 | 4.4–12.5 |
| Lung (diaphragm) | ||||||||
| Right | 12.1 | 8.3–16.1 | 17.5 | 6.6–56.0 | 8.1 | 4.4–15.1 | 12.0 | 4.4–56.0 |
| Left | 10.7 | 7.0–15.0 | 14.7 | 8.8–21.0 | 11.8 | 6.6–26.2 | 12.4 | 6.6–26.2 |
| Anterior | 11.4 | 7.0–16.1 | 15.1 | 14.2–16.0 | 9.2 | 5.9–15.1 | 11.4 | 5.9–16.1 |
| Posterior | 11.7 | 8.3–16.1 | 17.1 | 6.6–56.0 | 8.4 | 4.4–26.2 | 12.2 | 4.4–56.0 |
| Overall | 11.5 | 7.0–16.1 | 16.9 | 6.6–56.0 | 8.5 | 4.4–26.2 | 12.1 | 4.4–56.0 |
| Heart | 11.6 | 9.3–15.1 | 11.6 | 5.1–27.5 | 11.6 | 5.1–27.5 | ||
| Total | 11.5 | 7.0–16.1 | 15.6 | 6.5–56.0 | 8.8 | 4.4–27.5 | 11.6 | 4.4–56.0 |
Relationships between the occurrence of artifact and patient- or breathing pattern-related parameters
Table 4 shows patient- and breathing pattern-related parameters for the subgroups of patients with and without artifacts (other than blurring). There were no significant differences in the parameters related to patient characteristics between two subgroups. However, the following breathing pattern-related parameters showed significant differences on univariate analysis: abdominal displacement (p < 0.01), respiratory period (p < 0.01) and RMS respiratory irregularity (p = 0.02). For all these parameters, the subgroup with artifacts had larger values compared to those of the subgroup without artifacts. Several outliers can be found in the breathing pattern-related parameters, including extremely large abdominal displacements or respiratory periods, which is due to incorrect assignments of respiratory phases by the RPM system.
Table 4.
The patient- and breathing pattern-related parameters for the subgroups of patients with and without artifacts (other than blurring)
| Parameter | Patients with artifacts (n = 45) | Patients without artifacts (n = 5) | p |
|---|---|---|---|
| Age (y/o), median (range) | 66 (25–85) | 68 (36–76) | 0.98 |
| Gender, n (%) | 1.00 | ||
| Male | 18/45 (40.0%) | 2/5 (40.0%) | |
| Female | 27/45 (60.0%) | 3/5 (60.0%) | |
| Tumor site, n (%) | 0.30 | ||
| Lung | 17/45 (37.7%) | 1/5 (20.0%) | |
| Breast/chest wall | 12/45 (26.6%) | 3/5 (60.0%) | |
| Others | 16/45 (35.5%) | 1/5 (20.0%) | |
| Karnofsky index, n (%) | 0.48 | ||
| >= 80 | 21/45 (46.6%) | 1/5 (20.0%) | |
| <= 70 | 8/45 (17.7%) | 1/5 (20.0%) | |
| Unspecified | 16/45 (35.5%) | 3/5 (60.0%) | |
| Smoker, n (%) | 0.70 | ||
| Yes | 24/45 (53.3%) | 2/5 (40.0%) | |
| No | 19/45 (42.2%) | 3/5 (60.0%) | |
| Unspecified | 2/45 (4.4%) | 0/5 (0.0%) | |
| Diaphragm motion (mm), mean (range) | 14.9 (2.4–32.5) | 10.0 (5.0–15.0) | 0.06 |
| Abdominal displacement (mm), mean ± SD (range) | 9.0 ± 4.0 (1.2–29.7) | 6.7 ± 1.8 (3.0–12.5) | < 0.01 |
| Respiratory period (s), mean ± SD (range) | 4.1 ± 1.7 (1.5-15.5) | 3.4 ± 0.9 (1.7-7.0) | < 0.01 |
| RMS respiratory irregularity (mm), mean (range) | 1.7 (0.5–3.8) | 0.9 (0.4–1.4) | 0.02 |
| Maximum respiratory irregularity (mm), mean (range) | 7.2 (2.3–16.5) | 5.1 (1.6–9.2) | 0.27 |
Correlations between the magnitude of artifact and the abdominal displacement difference
Table 5 shows the correlations between the magnitude of artifact in the diaphragm and the abdominal displacement difference. Absolute or relative magnitude of artifact was found to have statistically significant correlation with both absolute and relative displacement difference. There were no significant correlations for the artifacts observed in lung tumors and the heart. A scatter plot for the combination that showed the strongest correlation (R = 0.34, p < 0.01), i.e., absolute displacement difference vs. absolute magnitude of artifact in the diaphragm, is shown in Fig. 6. This result suggests that the magnitudes of many artifacts observed in any of anatomical structures did not exactly depend on the corresponding abdominal displacement difference in terms of a simple linear relationship. The artifacts in lung tumors had smaller magnitudes compared to those of diaphragm (p = 0.02) or heart (p = 0.09), which is likely due to the fact that several lung tumors were located in the upper or middle lobe of the lung. It should be noted that the magnitude of minimum artifact was 4.4 mm observed in the lung tumor and diaphragm. We found a case with an extremely severe artifact (56 mm) in which the abdominal displacement was notably large; hence, the displacement difference was much larger than others. Moreover, several cases had considerable magnitudes of artifacts (up to around 26 mm), even though the displacement differences were small. Figure 7 shows example 4D-CT coronal and sagittal views of such a case. While there were apparent discontinuities in both the right and left diaphragms, the abdominal wall at the same level showed good continuity.
Table 5.
Correlations between the magnitude of artifact in the diaphragm and the abdominal displacement difference between two adjacent couch positions
| Artifact magnitude | Difference of abdominal displacement | R | p |
|---|---|---|---|
| Absolute | Absolute | 0.34 | < 0.01 |
| Relative to maximum displacement | 0.19 | 0.10 | |
| Relative to mean displacement | 0.23 | 0.04 | |
| Relative to SD of displacement | 0.09 | 0.41 | |
| Relative to diaphragm motion | Absolute | 0.29 | 0.01 |
| Relative to maximum displacement | 0.16 | 0.16 | |
| Relative to mean displacement | 0.24 | 0.04 | |
| Relative to SD of displacement | 0.12 | 0.29 |
Fig. 6.
The abdominal displacement difference between two adjacent couch positions vs. the absolute magnitude of artifacts in lung or mediastinal tumors, diaphragm and heart. The lines of best fit are also shown. Note that the magnitude of minimum observed artifact was 4.4 mm.
Fig. 7.
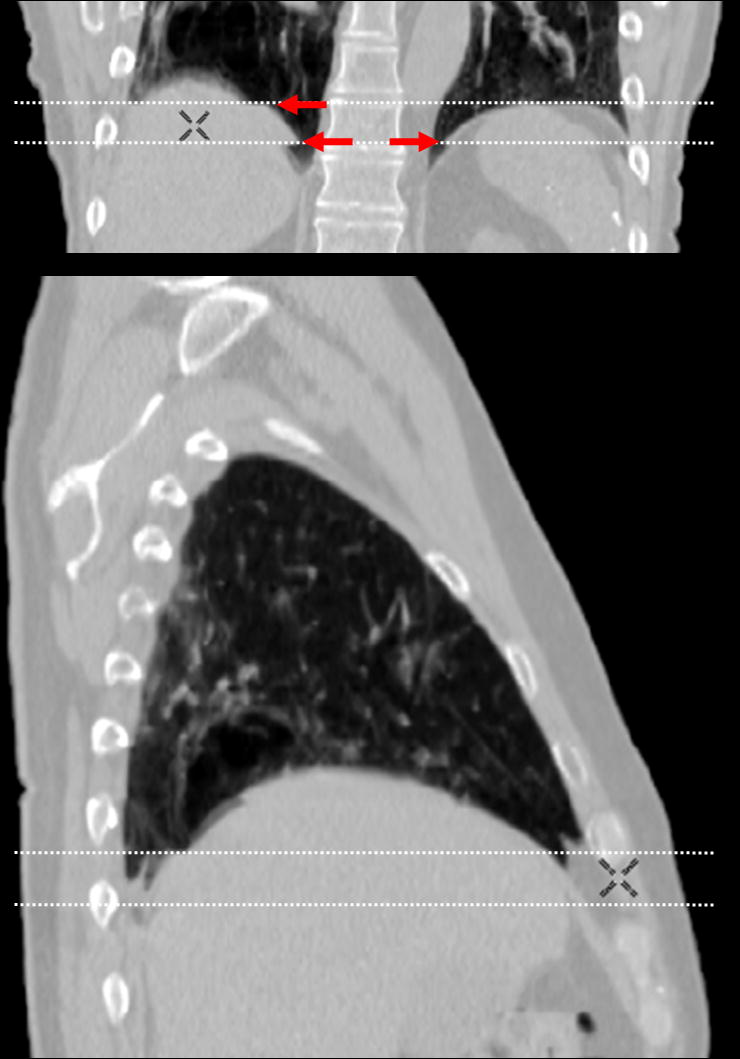
Example 4D-CT coronal and sagittal views of a patient, who had considerable magnitudes of artifacts even though the displacement differences were small. Discontinuities in both right and left diaphragms can be observed as indicated by arrows. Dashed lines show the boundaries of two adjacent couch positions.
Discussion
Frequency of the artifact
Our analysis revealed that most of patients had at least one artifact and the median number of artifacts was two. This result indicates that even this 4D-CT technique cannot remove artifacts due to respiratory motion in many patients. It should be noted that our analysis followed the procedures described in Fig. 1 and only the most prominent artifact was recorded for each couch position; hence, these results probably underestimate the actual frequency of artifacts. Many patients were found to have more than one artifact at different locations or phases in a particular couch position. Our procedure did not cover entire locations and respiratory phases of the 4D-CT images to analyze the artifacts. Also, artifacts of magnitude smaller than the minimum one found in this analysis (i.e., 4.4 mm) almost certainly exist and are present in the image, but were not found by our analysis method. Although an automated method to detect or analyze the artifacts would allow us to evaluate them more objectively and accurately, it is quite challenging. There have been no groups that successfully developed such a method to the best of our knowledge. Ehrhardt et al. (22) have used the mean squared gray value difference (MSD) between two adjacent slices as a metric to describe the magnitude of artifact. They compared MSD values for the 4D-CT images acquired using their approach and the conventional sorting, which were expected to be nearly identical if there are no artifacts. However, it is difficult to use such a metric to detect or measure the artifacts, because MSD can be affected not only by artifacts but also by anatomical changes.
We observed more artifacts in the right and the posterior regions in the diaphragm compared to the left and the anterior regions, respectively. Due to the limitation of our procedure, i.e., only the most prominent artifact was recorded, this finding indicates that the right and the posterior regions had more severe artifacts compared to the other regions. The possible causes include larger motion of the right and the posterior regions in diaphragm.
Parameters related to the occurrence of artifact
It was found that several breathing pattern-related parameters were significantly different between the subgroups of patients with and without artifacts. Patients with artifacts had larger abdominal displacement than those without artifacts. This result is intuitive as there is a correlation between abdominal displacement and diaphragm motion as reported by Vedam et al. (28) and Mageras et al. (29), and could also be attributed to the uncertainty in a respiratory phase bin for retrospective sorting. When assembling CT slices that have the nearest phase to the target one, the breathing pattern with a large displacement can contain larger displacement uncertainty in a particular phase bin compared to that with a small displacement. For such patients, a slight error in the phase determination would lead to a relatively large displacement difference. We revealed the significant relationship between the respiratory period and the respiratory irregularity (p = 0.01), which supports the finding that longer respiratory period was associated with the occurrence of artifacts. It was anticipated that patients with artifacts would have more irregular breathing patterns. Irregular breathing patterns make it difficult for the RPM system to determine the accurate phases as discussed by several investigators (21, 23, 24), which directly causes detrimental effects on the phase-based 4D-CT sorting.
Correlations between the magnitude of artifact and the abdominal displacement difference
Although the correlation was not strong, the magnitude of artifact in the diaphragm is significantly associated with the difference in abdominal displacement. For the artifacts observed in lung tumor and heart, no significant correlations between those magnitudes and the displacement differences have been found. Possible causes for relatively low correlations and observations of outliers include low correlation between abdominal displacement and internal organ motion, change in the breathing type, and limitations of the manual approach used in this study to measure the magnitude of artifact. Several investigators have reported cases which have low correlations between the abdominal displacement and internal organ or tumor motion (29, 30). There are two main types of breathing: abdominal (diaphragmatic) breathing and chest (costal) breathing. It is likely that some patients switch between these different breathing types during the 4D-CT acquisition. For such cases, the abdominal displacement would not be a good metric of respiratory motion for 4D-CT. These facts would also explain the cases with a considerable magnitude of artifact despite the small displacement difference.
Strategies to improve the 4D-CT image quality
There are several strategies being developed to improve the quality of 4D-CT images. The significant relationship between the respiratory irregularity and the occurrence of artifact observed in this study suggests that breathing training (31-33) to improve the respiratory regularity could reduce the artifacts in 4D-CT images. Endo et al. have developed a 256-slice CT scanner with a novel wide-area detector, which is capable of scanning a field of view approximately 100 mm long in the superior-inferior direction (34, 35). This specially-designed scanner would require fewer couch positions to image the entire thoracic region than existing scanners, which could reduce the artifacts. Also, improved sorting methods (16, 18-21, 23, 24) or post-scan image processing (22, 25) can be employed.
Conclusions
In this retrospective analysis of 50 consecutive 4D-CT data sets, we have found that the current 4D-CT acquisition and reconstruction procedures lead to the artifacts with an alarmingly high frequency and magnitude. The results of statistical analyses have suggested breathing pattern-related parameters, including the abdominal displacement, respiratory period and RMS respiratory irregularity, are significantly related to the occurrence of artifacts. Moreover, the magnitude of artifact has been found to be significantly associated with the difference in abdominal displacement between two adjacent couch positions. These findings indicate that significant improvement is needed in 4D-CT imaging.
Acknowledgments
Supported in part by an NCI-NIH grant P01CA116602.
Footnotes
Conflict of Interest Notification: None
Publisher's Disclaimer: This is a PDF file of an unedited manuscript that has been accepted for publication. As a service to our customers we are providing this early version of the manuscript. The manuscript will undergo copyediting, typesetting, and review of the resulting proof before it is published in its final citable form. Please note that during the production process errors may be discovered which could affect the content, and all legal disclaimers that apply to the journal pertain.
References
- 1.Balter JM, Ten Haken RK, Lawrence TS, et al. Uncertainties in CT-based radiation therapy treatment planning associated with patient breathing. Int J Radiat Oncol Biol Phys. 1996;36:167–174. doi: 10.1016/s0360-3016(96)00275-1. [DOI] [PubMed] [Google Scholar]
- 2.Shimizu S, Shirato H, Kagei K, et al. Impact of respiratory movement on the computed tomographic images of small lung tumors in three-dimensional (3D) radiotherapy. Int J Radiat Oncol Biol Phys. 2000;46:1127–1133. doi: 10.1016/s0360-3016(99)00352-1. [DOI] [PubMed] [Google Scholar]
- 3.Keall PJ, Kini VR, Vedam SS, et al. Potential radiotherapy improvements with respiratory gating. Australas Phys Eng Sci Med. 2002;25:1–6. doi: 10.1007/BF03178368. [DOI] [PubMed] [Google Scholar]
- 4.Chen GT, Kung JH, Beaudette KP. Artifacts in computed tomography scanning of moving objects. Semin Radiat Oncol. 2004;14:19–26. doi: 10.1053/j.semradonc.2003.10.004. [DOI] [PubMed] [Google Scholar]
- 5.International Commission on Radiation Units and Measurements. Prescribing, recording, and reporting photon beam therapy (supplement to ICRU report 50) Bethesda, Md.: International Commission on Radiation Units and Measurements; 1999. [Google Scholar]
- 6.Bortfeld T, Jokivarsi K, Goitein M, et al. Effects of intra-fraction motion on IMRT dose delivery: statistical analysis and simulation. Phys Med Biol. 2002;47:2203–2220. doi: 10.1088/0031-9155/47/13/302. [DOI] [PubMed] [Google Scholar]
- 7.George R, Keall PJ, Kini VR, et al. Quantifying the effect of intrafraction motion during breast IMRT planning and dose delivery. Med Phys. 2003;30:552–562. doi: 10.1118/1.1543151. [DOI] [PubMed] [Google Scholar]
- 8.Jiang SB, Pope C, Al Jarrah KM, et al. An experimental investigation on intra-fractional organ motion effects in lung IMRT treatments. Phys Med Biol. 2003;48:1773–1784. doi: 10.1088/0031-9155/48/12/307. [DOI] [PubMed] [Google Scholar]
- 9.Balter JM, Lam KL, McGinn CJ, et al. Improvement of CT-based treatment-planning models of abdominal targets using static exhale imaging. Int J Radiat Oncol Biol Phys. 1998;41:939–943. doi: 10.1016/s0360-3016(98)00130-8. [DOI] [PubMed] [Google Scholar]
- 10.Vedam SS, Keall PJ, Kini VR, et al. Acquiring a four-dimensional computed tomography dataset using an external respiratory signal. Phys Med Biol. 2003;48:45–62. doi: 10.1088/0031-9155/48/1/304. [DOI] [PubMed] [Google Scholar]
- 11.Ford EC, Mageras GS, Yorke E, et al. Respiration-correlated spiral CT: a method of measuring respiratory-induced anatomic motion for radiation treatment planning. Med Phys. 2003;30:88–97. doi: 10.1118/1.1531177. [DOI] [PubMed] [Google Scholar]
- 12.Pan T, Lee TY, Rietzel E, et al. 4D-CT imaging of a volume influenced by respiratory motion on multi-slice CT. Med Phys. 2004;31:333–340. doi: 10.1118/1.1639993. [DOI] [PubMed] [Google Scholar]
- 13.Taguchi K. Temporal resolution and the evaluation of candidate algorithms for four-dimensional CT. Med Phys. 2003;30:640–650. doi: 10.1118/1.1561286. [DOI] [PubMed] [Google Scholar]
- 14.Sonke JJ, Zijp L, Remeijer P, et al. Respiratory correlated cone beam CT. Med Phys. 2005;32:1176–1186. doi: 10.1118/1.1869074. [DOI] [PubMed] [Google Scholar]
- 15.Low DA, Nystrom M, Kalinin E, et al. A method for the reconstruction of four-dimensional synchronized CT scans acquired during free breathing. Med Phys. 2003;30:1254–1263. doi: 10.1118/1.1576230. [DOI] [PubMed] [Google Scholar]
- 16.Rietzel E, Pan T, Chen GT. Four-dimensional computed tomography: image formation and clinical protocol. Med Phys. 2005;32:874–889. doi: 10.1118/1.1869852. [DOI] [PubMed] [Google Scholar]
- 17.Keall PJ, Starkschall G, Shukla H, et al. Acquiring 4D thoracic CT scans using a multislice helical method. Phys Med Biol. 2004;49:2053–2067. doi: 10.1088/0031-9155/49/10/015. [DOI] [PubMed] [Google Scholar]
- 18.Lu W, Parikh PJ, Hubenschmidt JP, et al. A comparison between amplitude sorting and phase-angle sorting using external respiratory measurement for 4D CT. Med Phys. 2006;33:2964–2974. doi: 10.1118/1.2219772. [DOI] [PubMed] [Google Scholar]
- 19.Fitzpatrick MJ, Starkschall G, Antolak JA, et al. Displacement-based binning of time-dependent computed tomography image data sets. Med Phys. 2006;33:235–246. doi: 10.1118/1.2044427. [DOI] [PubMed] [Google Scholar]
- 20.Abdelnour AF, Nehmeh SA, Pan T, et al. Phase and amplitude binning for 4D-CT imaging. Phys Med Biol. 2007;52:3515–3529. doi: 10.1088/0031-9155/52/12/012. [DOI] [PubMed] [Google Scholar]
- 21.Mutaf YD, Antolak JA, Brinkmann DH. The impact of temporal inaccuracies on 4DCT image quality. Med Phys. 2007;34:1615–1622. doi: 10.1118/1.2717404. [DOI] [PubMed] [Google Scholar]
- 22.Ehrhardt J, Werner R, Saring D, et al. An optical flow based method for improved reconstruction of 4D CT data sets acquired during free breathing. Med Phys. 2007;34:711–721. doi: 10.1118/1.2431245. [DOI] [PubMed] [Google Scholar]
- 23.Rietzel E, Chen GT. Improving retrospective sorting of 4D computed tomography data. Med Phys. 2006;33:377–379. doi: 10.1118/1.2150780. [DOI] [PubMed] [Google Scholar]
- 24.Pan T, Sun X, Luo D. Improvement of the cine-CT based 4D-CT imaging. Med Phys. 2007;34:4499–4503. doi: 10.1118/1.2794225. [DOI] [PubMed] [Google Scholar]
- 25.Schreibmann E, Chen GT, Xing L. Image interpolation in 4D CT using a BSpline deformable registration model. Int J Radiat Oncol Biol Phys. 2006;64:1537–1550. doi: 10.1016/j.ijrobp.2005.11.018. [DOI] [PubMed] [Google Scholar]
- 26.Karnofsky DA, Burchenal J. The clinical evaluation of chemotherapeutic agents in cancer. In: MacLeod CM, editor. Evaluation of chemotherapeutic agents. New York: Columbia Univ. Press; 1949. pp. 191–205. [Google Scholar]
- 27.Dawson B, Trapp RG. Basic & clinical biostatistics. 4th. New York: Lange Medical Books/McGraw-Hill; 2004. [Google Scholar]
- 28.Vedam SS, Kini VR, Keall PJ, et al. Quantifying the predictability of diaphragm motion during respiration with a noninvasive external marker. Med Phys. 2003;30:505–513. doi: 10.1118/1.1558675. [DOI] [PubMed] [Google Scholar]
- 29.Mageras GS, Yorke E, Rosenzweig K, et al. Fluoroscopic evaluation of diaphragmatic motion reduction with a respiratory gated radiotherapy system. J Appl Clin Med Phys. 2001;2:191–200. doi: 10.1120/jacmp.v2i4.2596. [DOI] [PMC free article] [PubMed] [Google Scholar]
- 30.Hoisak JD, Sixel KE, Tirona R, et al. Correlation of lung tumor motion with external surrogate indicators of respiration. Int J Radiat Oncol Biol Phys. 2004;60:1298–1306. doi: 10.1016/j.ijrobp.2004.07.681. [DOI] [PubMed] [Google Scholar]
- 31.George R, Chung TD, Vedam SS, et al. Audio-visual biofeedback for respiratory-gated radiotherapy: impact of audio instruction and audio-visual biofeedback on respiratory-gated radiotherapy. Int J Radiat Oncol Biol Phys. 2006;65:924–933. doi: 10.1016/j.ijrobp.2006.02.035. [DOI] [PubMed] [Google Scholar]
- 32.Neicu T, Berbeco R, Wolfgang J, et al. Synchronized moving aperture radiation therapy (SMART): improvement of breathing pattern reproducibility using respiratory coaching. Phys Med Biol. 2006;51:617–636. doi: 10.1088/0031-9155/51/3/010. [DOI] [PubMed] [Google Scholar]
- 33.Venkat RB, Sawant A, Suh Y, et al. Development and preliminary evaluation of a prototype audiovisual biofeedback device incorporating a patient-specific guiding waveform. Phys Med Biol. 2008;53:N197–N208. doi: 10.1088/0031-9155/53/11/N01. [DOI] [PubMed] [Google Scholar]
- 34.Mori S, Endo M, Tsunoo T, et al. Physical performance evaluation of a 256-slice CT-scanner for four-dimensional imaging. Med Phys. 2004;31:1348–1356. doi: 10.1118/1.1747758. [DOI] [PubMed] [Google Scholar]
- 35.Endo M, Mori S, Tsunoo T, et al. Development and performance evaluation of the first model of 4D CT-scanner. IEEE Trans Nucl Sci. 2003;50:1667–1671. [Google Scholar]


