Abstract
It has long been known that rearrangements of chromosomes through breakage-fusion-bridge (BFB) cycles may cause variability of phenotypic and genetic traits within a cell population. Because intercellular heterogeneity is often found in neoplastic tissues, we investigated the occurrence of BFB events in human solid tumors. Evidence of frequent BFB events was found in malignancies that showed unspecific chromosome aberrations, including ring chromosomes, dicentric chromosomes, and telomeric associations, as well as extensive intratumor heterogeneity in the pattern of structural changes but not in tumors with tumor-specific aberrations and low variability. Fluorescence in situ hybridization analysis demonstrated that chromosomes participating in anaphase bridge formation were involved in a significantly higher number of structural aberrations than other chromosomes. Tumors with BFB events showed a decreased elimination rate of unstable chromosome aberrations after irradiation compared with normal cells and other tumor cells. This result suggests that a combination of mitotically unstable chromosomes and an elevated tolerance to chromosomal damage leads to constant genomic reorganization in many malignancies, thereby providing a flexible genetic system for clonal evolution and progression.
Intercellular variability of morphologic and genetic traits is a common feature in neoplastic tissues that may severely confound diagnosis. Extensive intratumor heterogeneity in the pattern of structural chromosome aberrations is a frequent finding in highly malignant neoplasms, such as sarcomas of bone and soft tissue (1) and carcinomas of the pancreas (2–4) and ovary (5–7). However, heterogeneity also occurs in a group of borderline and low malignant tumors, including atypical lipomatous tumors, low-grade malignant fibrous histiocytoma (MFH), and parosteal osteosarcoma (8–10). It has been proposed that such chromosomal variability may be due to an inherent genetic instability in malignant cells (11), caused by the dysfunction of genes controlling genomic integrity (12–16). In addition, nongenetic factors, including hypoxia (17) and radiation (18), have been shown to result in instability of chromosome number and structure in tumor cells. However, the precise chromosomal processes leading to genetic heterogeneity are still poorly understood.
A mechanism that could generate variability in chromosome structure within a clonal cell population is the breakage-fusion-bridge (BFB) cycle (Fig. 1), originally described by McClintock more than 60 years ago (19, 20). In this study, we investigated the occurrence of BFB events in primary cell cultures and continuous cell lines from 56 tumors from epithelium, bone, and soft tissue. Our results show that BFB events contribute to genetic heterogeneity in a number of aggressive tumors and that this type of instability results in specific alterations in nuclear chromatin structure and a certain pattern of chromosome abnormalities.
Figure 1.
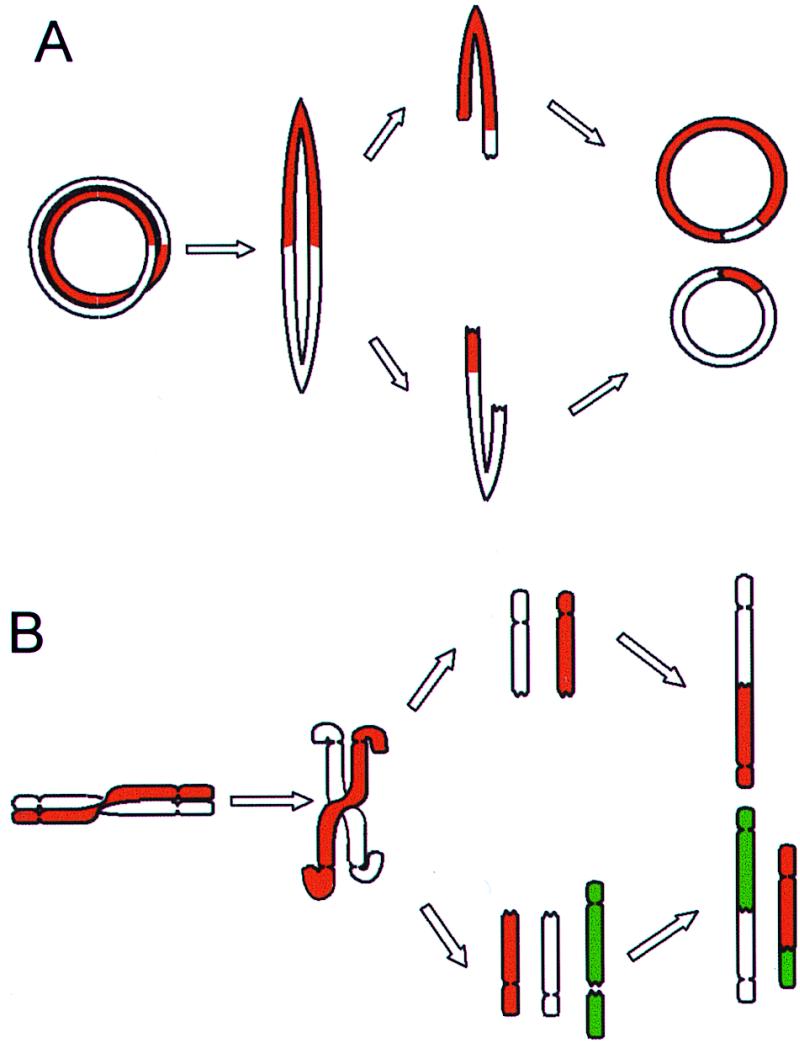
BFB cycles. (A) Ring chromosomes that have undergone a sister chromatid exchange or a torsion may form bridges at anaphase that subsequently break and rejoin into new rings. As bridges may break at any point between the centromeres, the rings in the daughter cells can be different from each other and from the ring in the mother cell. (B) Dicentric chromosomes and chromosomes involved in telomeric associations can also form bridges at anaphase. The broken ends may rejoin subsequently or rearrange with other broken chromosomes, forming new variants of dicentric chromosomes.
Materials and Methods
Patients and Cell Lines.
Material from 40 tumors was obtained within 24 h after resection (Table 1). Except for an osteosarcoma and a sarcoma not otherwise specified, none of the tumors were obtained from patients that had been treated by radiotherapy or chemotherapy. Three of the lipomatous tumors have been described previously (21). The Ewing sarcoma and the ovarian carcinoma cell lines HTB166 and HTB161 were from the American Type Culture Collection. The pancreatic carcinoma (4) and the malignant melanoma (MM) cell lines were established at the Department of Clinical Genetics, University Hospital, Lund, Sweden. The myxoid liposarcoma (MLS) and osteosarcoma (OSA) cell lines have been described (22, 23). The uterine leiomyoma cells GM10964B and the normal fibroblasts GM498B and GM3349B were obtained from NIGMS, Human Cell Repository, Camden, NJ.
Table 1.
Distribution of bridge-breakage instability* in solid tumors
| Diagnosis | Karotypic features† |
Bridge-breakage instability in low-passage cultures | Bridge-breakage instability in cell lines |
|---|---|---|---|
| High intercellular heterogeneity | 30 /31 | 11 /14 | |
| Low/borderline malignant | 19 /19 | — | |
| Atypical lipomatous tumor | r | 17 /17 | — |
| MFH | r and tas | 1 /1 | — |
| Desmoid tumor | tas | 1 /1 | — |
| Highly malignant | 11 /12 | 11 /14 | |
| Leiomyosarcoma | Complex | 2 /2 | — |
| MFH | Complex | 3 /3 | — |
| Malignant melanoma | Complex | — | 1 /1 |
| Osteosarcoma | Complex | 2 /2 | 2 /2 |
| Ovarian carcinoma | Complex | — | 1 /1 |
| Pancreatic carcinoma | Complex | — | 7 /10 |
| Sarcoma, NOS | Complex | 4 /5 | — |
| Low intercellular heterogeneity | 0 /9 | 0 /2 | |
| Benign | 0 /5 | — | |
| Hibernoma | t(6;14;11) | 0 /1 | — |
| Leiomyoma | t(12;14) | 0 /1 | — |
| Lipoma | t(1;6;5) | 0 /3 | — |
| t(2;6) | |||
| del(14q) | |||
| Low malignant | 0 /1 | — | |
| Dermatofibrosarcoma protuberans | r(17;22) | 0 /1 | — |
| Highly malignant | 0 /3 | 0 /2 | |
| Myxoid liposarcoma | t(12;16) | 0 /2 | 0 /1 |
| Synovial sarcoma | t(X;18) | 0 /1 | — |
| Ewing sarcoma | Complex with t(11;22) | — | 0 /1 |
More than 2% of anaphase figures with bridges and more than 4% of metaphase cells containing at least one ring chromosome, dicentric chromosome, or telomeric association.
† t, translocation; del, deletion; r, ring chromosome; tas, telomeric association; a complex karyotype contains more than five structural aberrations.
Chromosome Banding and Fluorescence in Situ Hybridization (FISH).
Culturing and harvesting of cells have been described elsewhere (24). Cultures from resected tumors were harvested within 10 days and not subcultured more than twice. G banding, obtained by Wright stain, and FISH analysis were performed as described (10), and karyotypic changes were described according to the International System for Human Cytogenetic Nomenclature (25). Ring chromosomes, dicentric chromosomes, and telomeric associations were detected by G banding in tumors with less than six structural aberrations and by FISH with a probe for all human centromeres (pan-α satellite probe; Cambio, Cambridge, U.K.) in tumors with more than five structural aberrations. At least 25 cells were evaluated per case. Multicolor analysis was performed by spectral karyotyping (26) and the combined binary and ratio labeling technique (27). In each case, 11–40 metaphase cells were analyzed. Biotinylated and digoxigenin-labeled whole-chromosome-painting probes were from Cambio and Oncor. The yeast artificial chromosome clones 2g11 and 751a4 were provided by E. Schoenmakers (University of Leuven) and by the Centre d'Étude du Polymorphisme Humain (Paris), respectively. Human DNA was amplified by inter-Alu PCR and labeled with biotin or digoxigenin by randomly priming hexanucleotides (MegaPrime, Amersham Pharmacia). Analysis was performed with an Axioplan2 epifluorescence microscope (Zeiss), coupled to a cooled charge-coupled device camera. Images were acquired and analyzed on a ChromoFluor system (Applied Imaging International, Newcastle, U.K.). For analysis of anaphase cells, cultures were harvested without colcemid by fixation in methanol:acetic acid (3:1). The slides were stained with Giemsa, and 30 or more anaphase figures were evaluated per case. For FISH, anaphase preparations were pretreated with 10 mg/ml pepsin for 10 min.
Irradiation of Cell Cultures.
Cell cultures were grown to confluence and then exposed to 6 Gy from 137Cs at 0.54 Gy/min. The culture medium was changed immediately after irradiation, and the first passage was made after 24 h. Subsequent passages were performed after two population doublings as evaluated by ocular inspection. For each case, one irradiated and one unexposed set of cultures were grown in parallel. At least 50 metaphase cells per passage were analyzed by G banding and FISH with the centromere probe. In parallel cultures, at least 50 anaphase figures were analyzed by Giemsa staining.
Mutation and Expression Analysis.
The COL1A1/PDGFB, EWS/FLI1, SYT/SSX, and FUS/CHOP fusion transcripts were detected by reverse transcriptase–PCR according to standard methods (28). Mutation analysis of TP53 was performed by direct sequencing of the complete coding region of PCR-amplified TP53 cDNA on an ABI Prism 310 Genetic Sequencing System (Perkin–Elmer). Expression analysis of MDM2 was performed by semiquantitative PCR (T. Jonson and M. Höglund, unpublished work) with an InstantImager (Packard).
Results
BFB Events Are Frequent in Malignant Tumors with Unspecific Chromosome Aberrations.
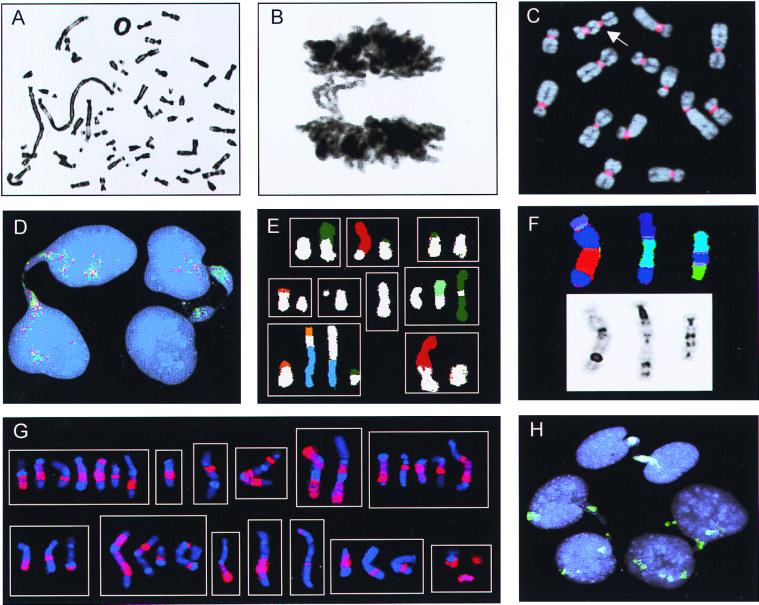
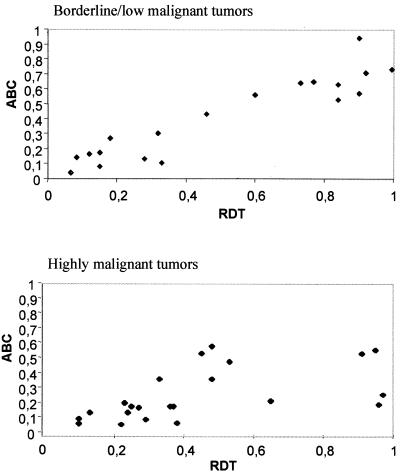
The occurrence of BFB events was monitored by assessing the frequencies of anaphase bridge configurations (ABC) and metaphase cells containing at least one mitotically unstable chromosome aberration, i.e., ring chromosome, dicentric chromosome, or telomeric association (RDT). To determine baseline values, 20 fibroblast cultures from two healthy individuals were analyzed. Here, the ABC and RDT frequencies were 0–2% and 0–4%, respectively. Cells from 45 borderline, low, and highly malignant neoplasms containing unspecific chromosome changes (2–30 structural changes per tumor) with extensive intratumor variation in structural aberrations (more than five different karyotypic clonal or nonclonal variants) were analyzed subsequently (Table 1). All 19 borderline/low malignant and 22 of the 26 highly malignant tumors showed elevated frequencies of ABC (4–94% and 7–52%) and RDT (7–100% and 10–97%; Fig. 2 A–C). The ABC and RDT frequencies showed a positive correlation in both groups (Fig. 3). Chromatin strings between interphase nuclei were observed in all cases, at frequencies ranging from 1% to 5%, as were nuclear protrusions, most likely representing bridges that had broken after anaphase (Fig. 2D).
Figure 2.
Chromosome banding, FISH, and Giemsa stain analyses. (A) Ring chromosome and telomeric associations in a low-grade MFH. (B) Anaphase bridge in the same case. (C) A dicentric chromosome (arrow) visualized by FISH with a probe for all human centromeres (red) in the pancreatic carcinoma cell line LPC5. (D) Chromatin bridges between interphase nuclei in an atypical lipomatous tumor with ring chromosomes containing amplified sequences from 12q; the bridges are positive with the 12q probes 751a4 (red) and 2 g11 (green). (E) Combinations (n = 9) of structural rearrangements involving chromosome 9 material (white classification color), found by spectral karyotyping of MFH1. (F) Dicentric chromosomes containing material from chromosome 3 (dark blue) shown by combined binary and ratio labeling FISH (Upper) and inverted 4′,6-diamidino-2-phenylindole staining (Lower) in MFH2. (G) Combinations (n = 13) of structural rearrangements involving material from chromosome 1 detected by whole-chromosome painting (red) in MM. (H) Complete (at the top and right) and broken (on the left) internuclear chromatin bridges positive for whole-chromosome-9 paint (green) in MFH1.
Figure 3.
The relationship between anaphase bridging and mitotically unstable chromosomes. ABC frequency is proportional to RDT frequency in borderline/low and highly malignant tumors. The correlation coefficients are 0.88 and 0.72, respectively (Spearman rank order correlation).
Cells from five benign and six malignant soft tissue tumors that had little karyotypic heterogeneity (less than six different karyotypic variants) were also analyzed (Table 1). Except for a Ewing sarcoma cell line (>10 structural aberrations), these all had simple karyotypes (<6 structural aberrations). The malignant tumors had simple, tumor-specific aberrations, including the translocations t(12;16)(q13;p11), t(X;18)(p11;q11), and t(11;22)(q24;q12), and a stable ring chromosome r(17;22)(q22;q13), resulting in the chimeric genes FUS/CHOP, SYT/SSX, EWS/FLI1, and COL1A1/PDGFB, respectively. Elevated ABC and RDT frequencies were not observed in any of these cases.
BFB Events Generate Heterogeneity by Preferential Remodeling of Certain Chromosomes.
In the borderline/low malignant tumors, the variability observed in metaphase cells was restricted to ring chromosomes of variable structure or chromosomes involved in telomeric associations. Rings in these neoplasms frequently contain amplified sequences from central parts of 12q (29, 30), and when three atypical lipomatous tumors and one MFH were subjected to FISH analysis with yeast artificial chromosome probes localized to 12q14–15, rings in all cases had positive signals. The signals varied in number between 10 and 20 among rings in different cells. In all four cases, the vast majority of bridges between interphase nuclei also contained amplified material from 12q14-15, demonstrating that ring chromosomes indeed participated in bridge formation (Fig. 2D).
The highly malignant tumors all had complex karyotypes (more than five structural aberrations). A large proportion (mean 36%) of the cells contained dicentric chromosomes, whereas cells with rings and telomeric associations were less frequent (mean 7% and <1%, respectively). The structural heterogeneity was difficult to evaluate by G banding, because many aberrant chromosomes could not be identified completely. Multicolor karyotyping was therefore performed on two MFHs (MFH1 and MFH2) and the MM cell line, all with elevated levels of ABC and RDT. The degree of heterogeneity for a given chromosome was measured by the number of different structural rearrangements in which material from this chromosome was present. In all three tumors, the participation of chromosomes in structural variability was nonrandom (P < 0.001; χ2 test; calculated exactly). In MFH1 and MFH2, chromosomes 9 and 3 were involved in 9 and 12 different rearrangements, respectively, most of which (19 of 21) included material from other chromosomes (Fig. 2 E and F). The other chromosomes evaluated (1–8 and 10 in MFH1; 2, 7, 8, 12, and X in MFH2) participated in three or fewer rearrangements, none of which included the hypervariable chromosomes. In MM, where the cytogenetic complexity was extremely high (>20 structural aberrations), multicolor karyotyping indicated that chromosome 1 was involved in a higher number of rearrangements than other chromosomes. This finding was corroborated by chromosome-painting analysis, showing 0.65 unique chromosome 1 rearrangements per cell (Fig. 2G), compared with 0.18–0.28 per cell for the other chromosomes (3, 5–7, 12, and 14) evaluated. Interphase bridges in these cases were analyzed subsequently with whole-chromosome paint: in MFH1 and MFH2, 88% and 74% of the bridges stained positive for chromosomes 9 (Fig. 2H) and 3, respectively, and in MM, 66% of bridges were positive for chromosome 1. When anaphase cells from MFH1 were hybridized with whole-chromosome-9 paint, bridges stained positive in 10 of 10 cells.
The Occurrence of BFB Events Is Associated with a Decreased Elimination Rate of Cells Carrying Mitotically Unstable Chromosomes.
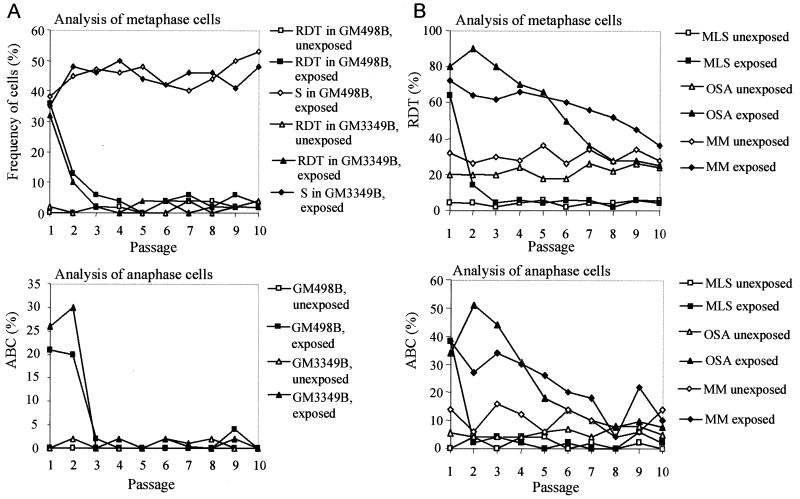
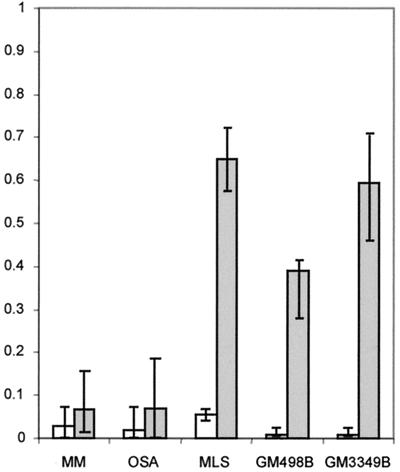
To compare the de novo formation and the elimination rates of cells with mitotically unstable chromosomes in cultures from different tumors, irradiation was used to induce chromosome aberrations. The OSA and MM cell lines, both from highly malignant tumors with complex karyotypes, were exposed to γ-irradiation, and the ABC and RDT frequencies were monitored during at least 10 passages. As a reference material, two normal fibroblast lines and the myxoid liposarcoma cell line MLS, with monosomy 13 and t(12;16), were used. Unexposed cells of OSA and MM had elevated levels of RDT and ABC, whereas the MLS had normal baseline ABC and RDT frequencies. All cultures showed increased levels of ABC and RDT at the first passage after irradiation (Fig. 4). The fibroblasts and MLS cells reached normal levels already at passages 2–3, whereas ABC and RDT remained elevated, compared with unexposed cells, until passage 8 in OSA and passages 10–12 in MM. When RDT values were used to estimate the elimination and formation rates of cells with mitotically unstable chromosomes, the elimination rates were significantly lower in OSA and MM (7% per generation in both; Fig. 5) than in MLS and the fibroblasts (65% and 40% per generation). The formation rates (0.2–5%) did not differ significantly.
Figure 4.
Elimination of chromosomal instability after irradiation. (A) In fibroblasts (GM498B and GM3349B), the RDT and ABC frequencies reached normal levels three passages after irradiation, whereas the frequency of cells containing stable chromosome aberrations (S), i.e., translocations, additions, deletions, and inversions increased slightly during 10 passages; S ≤ 6% before irradiation. (B) In MLS, the RDT and ABC frequencies reached normal levels at passages 3 and 2. The OSA and MM cell lines have elevated RDT and ABC levels inherently. Irradiated OSA cells did not return to their base level until passage 8. MM reached the ABC and RDT base levels at passages 10 and 12 (not shown), respectively. The RDT values were corroborated by FISH with a probe for all human centromeres in the fibroblasts and OSA (data not shown).
Figure 5.
Formation (white) and elimination rates (gray) of cells carrying mitotically unstable chromosomes in tumor and fibroblast cultures, estimated by the model ΔRDT = F × (1 − RDT) − E × RDT, where ΔRDT is the difference in RDT frequency between two generations, RDT is the RDT frequency at the lower generation number, F is the newly formed fraction/generation, and E is the eliminated fraction/generation. ΔRDT was assumed to be equal to 0 at the average baseline RDT value. E and F values were calculated for each interval between passages during the elimination phase. Median values are indicated by column height, and ranges by vertical bars. The elimination rates were significantly lower in OSA and MM compared with MLS and the fibroblast lines GM498B and GM3349B (P ≤ 0.002; two-tailed Mann–Whitney U test), whereas the formation rates did not differ significantly.
Is Remodeling of the Tumor Cell Genome Through BFB Events Associated with Disruption of Normal TP53 Function?
Mutation analysis of TP53 and evaluation of the expression level of the TP53 inhibitor MDM2 were performed in 10 low-passage pancreatic adenocarcinoma cell lines—the largest tumor group of the present study in which BFB instability was not present in all cases. Six of seven tumors with BFB instability had TP53 mutations. Of the three cases not showing BFB instability, two had only wild-type alleles, whereas a third contained an inactivating mutation in the absence of a normal TP53 transcript. Overexpression of MDM2 was not found in any case.
Discussion
Genomic instability is a characteristic feature of many tumor types. However, the resulting genetic heterogeneity has been presented mostly in descriptive terms, and only recently have potential mechanisms been investigated (31, 32). Obviously, genomic instability may depend on a number of cellular processes. Replicative errors and incomplete repair capacity may lead to an increased generation of genetic changes (33), whereas malfunction of checkpoint systems that normally cause cell-cycle arrest and apoptosis when recognizing DNA damage or mitotic dysfunction will result in a decreased elimination of cells that have sustained genetic alterations (12, 14, 34, 35). The tuning of these opposing mechanisms may determine the rate of genomic reorganization. Little attention has been paid to the role of mitotically unstable chromosomes as a generator of genetic variability. The present study shows that repeated rearrangements of such chromosomes through BFB cycles may create a heterogeneous pattern of structural chromosome aberrations in a number of tumor types. Our findings show that a positive correlation exists between the frequency of cells carrying mitotically unstable chromosomes and the frequency of anaphase bridge formation and provide evidence that BFB events occur frequently in malignancies with an unspecific and variable pattern of chromosome abnormalities but not in tumors with recurrent and highly specific aberrations. The absence of BFB events in tumors that contained pathognomonic aberrations in an otherwise complex karyotype, as in the Ewing sarcoma cell line, or together with a potentially unstable chromosome, as in the dermatofibrosarcoma protuberans, indicates that the difference between these tumor groups cannot be explained by karyotypic complexity only. Instead, our data may reflect the presence of at least two different modes for the development of chromosome rearrangements in solid tumors: one that results in few, potent, and stable aberrations and another that is characterized by a continuous disruption of chromosomal integrity.
In the borderline/low malignant tumors, BFB events gave rise to a heterogeneity that was limited to ring chromosomes of variable size and structure as well as telomeric associations between different chromosomes. A different scenario was observed in the highly malignant tumors. Here, the BFB events led to a more generalized instability of the chromosome complement: the chromosome material that most frequently participated in anaphase bridges was also involved preferentially in a variety of structural rearrangements, providing further evidence for a strong correlation between mitotic disturbances and reorganization of chromosomes. In contrast to most previously described types of structural chromosome instability, which depend on increased de novo generation of chromosome aberrations (33), BFB instability is based on the mitotic transfiguration of chromosomes that are inherently unstable. The occasional formation of one or more mitotically unstable aberrations may thereby trigger an endless chain of BFB events, constantly generating novel chromosomal variants and genomic imbalances (Fig. 1).
Normally, cells that suffer chromosomal damage are prevented from further proliferation by cell-cycle arrest or apoptosis (36), and cells carrying mitotically unstable chromosomes are eliminated rapidly (37). A prerequisite for continuous BFB cycling thus might be the leakiness of one or more of the cell-cycle checkpoint systems. Our data show that BFB instability in malignant cells is indeed associated with a decreased elimination rate of cells carrying unstable chromosome aberrations. A large number of genes are known to contribute to the maintenance of genomic integrity by participation in cell-cycle checkpoint systems, and many of these genes, such as TP53, have also been implicated in tumorigenesis (32, 38, 39). Mutations in TP53 were found in six of seven pancreatic carcinomas with BFB instability in this study. However, the fact that TP53 mutation was absent in one case with BFB events indicates that one or several other genetic or environmental factors are involved in this type of instability. Nonetheless, the BFB cycle seems to be a common instrument for generating chromosomal variation in neoplastic tissue, because it occurs in a number of different histopathological tumor types, independently of karyotypic complexity. The repeated rearrangement of unstable chromosomes by anaphase bridge formation provides a direct mechanistic link between chromosome rearrangements, disturbances of the mitotic apparatus, and aberrations in nuclear chromatin structure—all classical hallmarks of malignancy (40, 41).
Acknowledgments
We are grateful to P. Gustafson, I. Samson, and K. O'Brien for providing clinical data, to U. Strömberg for advice on statistical calculations, and to C.-H. Shah and R. Kalman for technical assistance. This work was supported by the Swedish Cancer Society, the Children's Cancer Fund of Sweden, the Inga Britt and Arne Lundberg Research Foundation, the John and Augusta Persson Foundation for Scientific Medical Research, and the Erik Philip-Sörensen Foundation.
Abbreviations
- BFB
breakage-fusion-bridge
- ABC
anaphase bridge configuration
- RDT
ring chromosome, dicentric chromosome, and telomeric association
- FISH
fluorescence in situ hybridization
- MFH
malignant fibrous histiocytoma
Footnotes
This paper was submitted directly (Track II) to the PNAS office.
Article published online before print: Proc. Natl. Acad. Sci. USA, 10.1073/pnas.090013497.
Article and publication date are at www.pnas.org/cgi/doi/10.1073/pnas.090013497
References
- 1.Örndal C, Rydholm A, Willén H, Mitelman F, Mandahl N. Cancer Genet Cytogenet. 1994;78:127–137. doi: 10.1016/0165-4608(94)90080-9. [DOI] [PubMed] [Google Scholar]
- 2.Griffin C A, Hruban R H, Morsberger L A, Ellingham T, Long P P, Jaffee E M, Hauda K M, Bohlander S K, Yeo C J. Cancer Res. 1995;55:2394–2399. [PubMed] [Google Scholar]
- 3.Gorunova L, Johansson B, Dawiskiba S, Andrén-Sandberg A, Jin Y, Mandahl N, Heim S, Mitelman F. Genes Chromosomes Cancer. 1995;14:259–266. doi: 10.1002/gcc.2870140404. [DOI] [PubMed] [Google Scholar]
- 4.Gorunova L, Höglund M, Andrén-Sandberg A, Dawiskiba S, Jin Y, Mitelman F, Johansson B. Genes Chromosomes Cancer. 1998;23:81–99. doi: 10.1002/(sici)1098-2264(199810)23:2<81::aid-gcc1>3.0.co;2-0. [DOI] [PubMed] [Google Scholar]
- 5.Roberts C G, Tattersall M H. Cancer Genet Cytogenet. 1990;48:243–253. doi: 10.1016/0165-4608(90)90127-v. [DOI] [PubMed] [Google Scholar]
- 6.Pejovic T, Heim S, Mandahl N, Baldetorp B, Elmfors B, Flodérus U M, Furgyik S, Helm G, Himmelmann A, Willén H, et al. Genes Chromosomes Cancer. 1992;4:58–68. doi: 10.1002/gcc.2870040108. [DOI] [PubMed] [Google Scholar]
- 7.Kiechle-Schwarz M, Bauknecht T, Schmidt J, Walz L, Pfleiderer A. Cancer Detect Prev. 1995;19:234–243. [PubMed] [Google Scholar]
- 8.Heim S, Mandahl N, Kristoffersson U, Mitelman F, Rööser B, Rydholm A, Willén H. Cancer Genet Cytogenet. 1987;24:319–326. doi: 10.1016/0165-4608(87)90114-2. [DOI] [PubMed] [Google Scholar]
- 9.Örndal C, Mandahl N, Rydholm A, Willén H, Brosjö O, Heim S, Mitelman F. Cancer Genet Cytogenet. 1992;60:170–175. doi: 10.1016/0165-4608(92)90011-v. [DOI] [PubMed] [Google Scholar]
- 10.Gisselsson D, Höglund M, Mertens F, Mitelman F, Mandahl N. Genes Chromosomes Cancer. 1998;23:203–212. doi: 10.1002/(sici)1098-2264(199811)23:3<203::aid-gcc1>3.0.co;2-5. [DOI] [PubMed] [Google Scholar]
- 11.Nowell P C. Science. 1976;194:23–28. doi: 10.1126/science.959840. [DOI] [PubMed] [Google Scholar]
- 12.Cahill D P, Lengauer C, Yu J, Riggins G J, Willson J K, Markowitz S D, Kinzler K W, Vogelstein B. Nature (London) 1998;392:300–303. doi: 10.1038/32688. [DOI] [PubMed] [Google Scholar]
- 13.Smith L, Liu S J, Goodrich L, Jacobson D, Degnin C, Bentley N, Carr A, Flaggs G, Keegan K, Hoekstra M, et al. Nat Genet. 1998;19:39–46. doi: 10.1038/ng0598-39. [DOI] [PubMed] [Google Scholar]
- 14.Hollander M C, Sheikh M S, Bulavin D V, Lundgren K, Augeri-Henmueller L, Shehee R, Molinaro T A, Kim K E, Tolosa E, Ashwell J D, et al. Nat Genet. 1999;23:176–184. doi: 10.1038/13802. [DOI] [PubMed] [Google Scholar]
- 15.Agapova L S, Ivanov A V, Sablina A A, Kopnin P B, Sokova O I, Chumakov P M, Kopnin B P. Oncogene. 1999;18:3135–3142. doi: 10.1038/sj.onc.1202386. [DOI] [PubMed] [Google Scholar]
- 16.Spruck C H, Won K A, Reed S I. Nature (London) 1999;401:297–300. doi: 10.1038/45836. [DOI] [PubMed] [Google Scholar]
- 17.Reynolds T Y, Rockwell S, Glazer P M. Cancer Res. 1996;56:5754–5757. [PubMed] [Google Scholar]
- 18.Kadhim M A, Macdonald D A, Goodhead D T, Lorimore S A, Marsden S J, Wright E G. Nature (London) 1992;355:738–740. doi: 10.1038/355738a0. [DOI] [PubMed] [Google Scholar]
- 19.McClintock B. Genetics. 1938;23:215–376. doi: 10.1093/genetics/23.4.315. [DOI] [PMC free article] [PubMed] [Google Scholar]
- 20.McClintock B. Genetics. 1940;26:234–282. doi: 10.1093/genetics/26.2.234. [DOI] [PMC free article] [PubMed] [Google Scholar]
- 21.Gisselsson D, Höglund M, Mertens F, Johansson B, Dal Cin P, Van den Berghe H, Earnshaw W C, Mitelman F, Mandahl N. Hum Genet. 1999;104:315–325. doi: 10.1007/s004390050960. [DOI] [PubMed] [Google Scholar]
- 22.Knight J C, Renwick P J, Dal Cin P, Van den Berghe H, Fletcher C D M. Cancer Res. 1995;55:24–27. [PubMed] [Google Scholar]
- 23.Roberts W M, Douglass E C, Peiper S C, Houghton P J, Look A T. Cancer Res. 1989;49:5407–5413. [PubMed] [Google Scholar]
- 24.Mandahl N, Heim S, Arheden K, Rydholm A, Willén H, Mitelman F. Hum Genet. 1988;79:203–208. doi: 10.1007/BF00366238. [DOI] [PubMed] [Google Scholar]
- 25.ISCN. An International System for Human Cytogenetic Nomenclature. Basel: Karger; 1995. [Google Scholar]
- 26.Schröck E, du Manoir S, Veldman T, Schoell B, Wienberg J, Ferguson-Smith M A, Ning Y, Ledbetter D H, Bar-Am I, Soenksen D, et al. Science. 1996;273:494–497. doi: 10.1126/science.273.5274.494. [DOI] [PubMed] [Google Scholar]
- 27.Tanke H J, Wiegant J, van Gijlswijk R P, Bezrookove V, Pattenier H, Heetebrij R J, Talman E G, Raap A K, Vrolijk J. Eur J Hum Genet. 1999;7:2–11. doi: 10.1038/sj.ejhg.5200265. [DOI] [PubMed] [Google Scholar]
- 28.Panagopoulos I, Mandahl N, Ron D, Höglund M, Nilbert M, Mertens F, Mitelman F, Åman P. Cancer Res. 1994;54:6500–6503. [PubMed] [Google Scholar]
- 29.Dal Cin P, Kools P, Sciot R, De Wever I, Van Damme B, Van de Ven W, Van den Berghe H. Cancer Genet Cytogenet. 1993;68:85–90. doi: 10.1016/0165-4608(93)90001-3. [DOI] [PubMed] [Google Scholar]
- 30.Pedeutour F, Suijkerbuijk R F, Van Gaal J, Van de Klundert W, Coindre J M, Van Haelst A, Collin F, Huffermann K, Turc-Carel C. Cancer Genet Cytogenet. 1993;66:133–134. doi: 10.1016/0165-4608(93)90245-h. [DOI] [PubMed] [Google Scholar]
- 31.Denko N, Stringer J, Wani M, Stambrook P. Somat Cell Mol Genet. 1995;21:241–253. doi: 10.1007/BF02255779. [DOI] [PubMed] [Google Scholar]
- 32.Lengauer C, Kinzler K W, Vogelstein B. Nature (London) 1998;396:643–649. doi: 10.1038/25292. [DOI] [PubMed] [Google Scholar]
- 33.Meyn M S. Curr Top Microbiol Immunol. 1997;221:71–148. doi: 10.1007/978-3-642-60505-5_6. [DOI] [PubMed] [Google Scholar]
- 34.Agapova L S, Ilyinskaya G V, Turovets N A, Ivanov A V, Chumakov P M, Kopnin B P. Mutat Res. 1996;354:129–138. doi: 10.1016/0027-5107(96)00062-0. [DOI] [PubMed] [Google Scholar]
- 35.Rotman G, Shiloh Y. Oncogene. 1999;18:6135–6144. doi: 10.1038/sj.onc.1203124. [DOI] [PubMed] [Google Scholar]
- 36.Cohen-Jonathan E, Bernhard E J, McKenna W G. Curr Opin Chem Biol. 1999;3:77–83. doi: 10.1016/s1367-5931(99)80014-3. [DOI] [PubMed] [Google Scholar]
- 37.Al-Achkar W, Sabatier L, Dutrillaux B. Mutat Res. 1988;198:191–198. doi: 10.1016/0027-5107(88)90054-1. [DOI] [PubMed] [Google Scholar]
- 38.Bunz F, Dutriaux A, Lengauer C, Waldman T, Zhou S, Brown J P, Sedivy J M, Kinzler K W, Vogelstein B. Science. 1998;282:1497–1501. doi: 10.1126/science.282.5393.1497. [DOI] [PubMed] [Google Scholar]
- 39.Kastan M B, Onyekwere O, Sidransky D, Vogelstein B, Craig R W. Cancer Res. 1991;51:6304–6311. [PubMed] [Google Scholar]
- 40.Hansemann D. Arch Pathol Anat Phys Klin Med. 1891;119:299–326. [Google Scholar]
- 41.Boveri T. Zur Frage der Entstehung maligner Tumoren. Jena: von Gustav Fischer; 1914. [Google Scholar]


