

Abstract
A real or artificial scotoma within a dynamic noise field fills in within a few seconds. When the dynamic noise is replaced with a homogenous field, a twinkling after effect (TwAE) is induced exclusively in the location of the former scotoma. We are employing the appearance of the TwAE to perform rapid perimetry in patients with retinal scotomas. To analyze the loci within the visual system and the mechanisms of filling-in and the TwAE, we examined their orientation tuning, inter-ocular transfer, and threshold versus contrast functions by measuring contrast detection thresholds for stimuli presented in areas that were filled-in or contained the TwAE. For filling-in, detection thresholds were narrowly tuned for orientation, transferred interocularly, and rose monotonically with the contrast of a surround pattern. These results indicate that surround suppression and filling-in involve inhibitory processes originating at cortical stages of visual processing. Threshold versus contrast functions were weakly dipper-shaped for the TwAE, did not transfer inter-ocularly, and were not tuned for orientation. These results indicate that the TwAE involves additive noise that is pre-cortical in origin and that it is distinct from filling-in.
Keywords: filling-in, scotoma, aftereffect, orientation
Introduction
Under steady fixation, a highly visible uniform gray patch (referred to as an artificial scotoma) embedded in a colored, textured, or dynamic noise field (the surround) will, over the course of a few seconds, fill in with structure that is indistinguishable from the surround (Gyoba, 1997; Ramachandran & Gregory, 1991; Ramachandran, Gregory, & Aiken, 1993; Spillmann & Kurtenbach, 1992).
If a homogenous field is viewed after filling-in of a dynamic field, the area formerly occupied by the artificial scotoma often appears to contain “twinkling” noise, which resembles to the “snow” seen on an untuned television, whereas the area formerly occupied by dynamic noise appears uniform. This phenomenon is known as the induced twinkle aftereffect (TwAE; see Figure 1) (Crossland, Dakin, & Bex, 2007; Hardage & Tyler, 1995; Morgan, McEwan, & Solomon, 2007; Ramachandran et al., 1993; Tyler & Hardage, 1998).
Figure 1.

Appearance of filling-in and the twinkle aftereffect. Note that the stimuli are dynamic in reality, and that the observer fixates the center of the screen.
Filling-in is faster in the peripheral visual field and slower for larger patches (De Weerd, Desimone, & Ungerleider, 1998), and these two competing factors produce a roughly constant rate of filling-in for patches of equal cortical projection. Filling-in takes longer when there is a large difference between the target and surround (Sakaguchi, 2001; Welchman & Harris, 2001) and this has been taken as evidence that filling-in may be a failure of image segmentation (De Weerd et al., 1998), possibly due to contrast adaptation at the patch edges (Ramachandran & Gregory, 1991). This would predict that factors that improve segmentation (e.g., surround visibility) should reduce filling-in, but this simple relationship does not hold (Sakaguchi, 2001). Others have argued that filling-in is due to changes in the relative activity of inhibitory and excitatory connections of units responding to the area around (Kapadia, Gilbert, & Westheimer, 1994; Tailby & Metha, 2004) or within (De Weerd, Gattass, Desimone, & Ungerleider, 1995) the artificial scotoma. For example, the apparent locations of line segments around an artificial scotoma are shifted towards the interior of the scotoma, consistent with a shift or an expansion of receptive fields (RFs) that detect structure within the scotoma (Kapadia et al., 1994). This effect is greater for elements of similar orientation (Tailby & Metha, 2004) implying a cortical (rather than retinal or subcortical) locus for remapping.
Human functional imaging finds increased activity in regions of visual areas V3A and V4v corresponding to an artificial scotoma during filling-in of that scotoma (Mendola, Conner, Sharma, Bahekar, & Lemieux, 2006). However, for scotomas arising from retinal insult, brain imaging studies are equivocal. One recent human fMRI study reported no remapping—the scotoma was detectable on retinotopic maps by cortical inactivity (Sunness, Liu, & Yantis, 2004), a result that has been demonstrated in the adult macaque (Smirnakis et al., 2005). However, another study found that the foveal confluence (the region of the brain dedicated to processing foveal vision, corresponding to the retinal lesion) was responsive to objects and faces (Baker, Peli, Knouf, & Kanwisher, 2005). The absence of a “gap” in visual retinotopic maps (filling-in) is consistent with the activity of remapped RFs whose shifted retinal connections would account for these perceptual completions.
In the first description of the TwAE, Ramachandran and colleagues assumed that this phenomenon was due to persistence of filling-in. Hardage and Tyler (1995) identified several key differences between filling-in and the TwAE including the larger area over which the TwAE can be induced (at least 20°, compared to 1.5° for filling-in), the absence of any chromatic component to the TwAE, and the absence of the TwAE when the temporal frequency of the dynamic noise is below 10 Hz (Tyler & Hardage, 1998). One functional imaging study has been performed during the presence of this illusory twinkling, which found increased BOLD activity in the region of the aftereffect in all retinotopic regions of cortex (Chen, Tyler, Liu, & Wang, 2005). However, such results cannot identify whether these response differences are cortical in origin, are inherited from earlier stages of visual processing, or are the result of feedback from late stages of visual processing.
Recently, Morgan et al. (2007) examined this proposal and measured the effects of the TwAE on contrast detection and discrimination. They first confirmed that a real noise pedestal generated dipper-shaped threshold versus contrast functions (TvC), in line with many previous studies (Legge & Foley, 1980). The shape of this TvC function was qualitatively changed by the presence of both the TwAE and the pedestal. The results showed an overall loss in sensitivity that abolished the dipper part of the function and a vertical shift of the function, indicating that the illusory contrast of the TwAE summed with the real contrast of the pedestal at an early stage of visual processing. Morgan and colleagues also found that these results showed almost complete interocular transfer, so that TvC functions were similar whether the inducing pattern was presented in the same or opposite eye from the test pattern. In the dichoptic condition, the dipper was clearly present, which was attributed to the lower effective contrast of the adapting pattern in dichoptic conditions (where one eye receives a uniform screen of mean luminance). Morgan et al. concluded from these results that filling-in (as measured by the TwAE) occurs at an early stage of visual processing.
We have recently used the TwAE as a probe of scotoma characteristics in people with retinal lesions caused by macular disease (Crossland et al., 2007). We found that 75% (six out of eight) observers reported that a dynamic white noise pattern was filled in over their central scotoma and six observers (not exclusively the same observers) experienced a TwAE whose location closely matched the area of the scotoma determined by microperimetry. Interestingly, 2 of the patients who experienced filling-in did not experience a TwAE and two of the patients experiencing a TwAE did not experience filling-in. The observation that the TwAE can occur in the absence of perceptual completion and vice versa strongly suggests that, at least in people with visual impairment, the two phenomena involve distinct mechanisms.
Here we use two psychophysical methods to investigate where in the visual system filling-in and the TwAE originate in normally sighted observers. First, we measure orientation tuning for these phenomena. Orientation selectivity is first observed in the responses of neurons in primary visual cortex of mammalian brains (Blakemore & Campbell, 1969; Movshon & Blakemore, 1973). We therefore hypothesized that an absence of orientation tuning for filling-in or the TwAE would indicate that the effect originates at a pre-cortical level, whereas the presence of orientation tuning would indicate a cortical locus for either phenomenon. Similarly, binocular neurons are first observed in primary visual cortex (Hubel & Wiesel, 1962). Therefore, we attempted to induce interocular transfer of these effects, to determine whether these phenomena originate within regions of the visual system with monocular or binocular receptive fields. Finally, we measure threshold versus contrast (TvC, “dipper”) functions (Legge & Foley, 1980) to examine the interaction between the real noise of the target and the illusory noise of filled in structure or the illusory noise of the TwAE.
Methods
Five observers with normal or corrected-to-normal vision were recruited from colleagues and friends. Both authors acted as subjects in Experiment 1, and MDC observed in both experiments. Subjects gave their informed consent prior to data collection and the study followed the tenets of the Declaration of Helsinki. S2 did not participate in Experiment 2 due to his mild amblyopia.
Stimuli were generated in Matlab (v.7.4.0, MathWorks Inc., Natick, MA) using elements of the Psychophysics toolbox (Brainard, 1997; Pelli, 1997) and were viewed on a 22-in. CRT monitor (ElectronBlue II; Lacie, Massy, France) with a 75-Hz refresh rate from a distance of 115 cm. The luminance gamma functions for the R, G, and B guns were measured separately with a Minolta CS100 photometer and were corrected directly in the graphics card’s control panel to produce linear 8 bit resolution per color. The monitor settings were adjusted so that the luminance of green was twice that of red, which in turn was twice that of blue. This shifted the white-point of the monitor to 0.31, 0.28 (x, y) at the 50 cd/m2 mean luminance. A “bit-stealing” algorithm (Tyler, 1997) was used to obtain 10.8 bits (1785 unique levels) of luminance resolution under the constraint that no RGB value could differ from the others by more than one look up table level.
Orientation tuning
Contrast detection thresholds were measured in Experiment 1 for an oriented band-pass filtered white noise target. Target noise was presented within a circular window of diameter 0.5° (32 pixels) whose edges were smoothed over 0.125° (8 pixels) with a raised cosine. The spatial frequency spectrum of the noise was digitally filtered in the Fourier domain with log exponential filters:
| (1) |
where the peak spatial frequency, Ωp, was 4 c/deg and the half bandwidth, b0.5, was 0.5 octaves. Orientation narrow-band filters were Gaussian:
| (2) |
where peak orientation, Θp, was varied from 0° (vertical) to 90° (horizontal) in 22.5° steps and the orientation bandwidth, σΘ, was 11.25°. Stimuli were presented for 500 msec 2° to the left or the right of fixation, in a spatial 2AFC task.
Inducing/surround noise was also band-pass filtered in orientation and spatial frequency with Equations 1 and 2. The peak spatial frequency of the inducing noise was 4 c/deg, its peak orientation was fixed at 0° (vertical), so that the same inducing noise could be used in a single run in which the five orientations of the target pattern were randomly interleaved. Inducing surround noise was presented within an outer circular window subtending 4° (256 pixels) and contained an inner circular featureless “hole” of mean luminance subtending 0.5°. The edges of the outer and inner windows were smoothed with a raised cosine over 0.125°. Alpha blending functions from OpenGL were used to smooth the transition between the center and surround patterns over 0.125° when both were present simultaneously, so that there was no gap between them. The RMS contrast of each noise frame was fixed at 25%. A minimum of 250 unique surround patterns were pre-computed before each run and during the run, a different surround pattern was selected at random every 2 video frames (37.5 Hz) to generate dynamic inducing/surround noise pattern with a white temporal spectrum.
Detection thresholds were measured for each target orientation using multiple interleaved 1-up 3-down adaptive staircases, converging on 79.4% correct (Wetherill & Levitt, 1965). Feedback was given by means of changing the isoluminant color of a central fixation target.
Detection thresholds were measured under four conditions (Figure 2). The baseline condition (Figure 2a) consisted of the target presented alone. Second (Figure 2b), surround suppression (Wilson, McFarlane, & Phillips,1983) without filling-in was assessed by presenting the surround noise only during the test phase. At all other times in the run, the background was a blank field of mean luminance. In the third condition (Figure 2c), filling-in was induced by presenting the surround dynamic noise throughout the entire run. To ensure that filling-in had occurred, observers initiated each trial with a button press only when they were experiencing filling-in. Before the first trial, the surround was presented for a minimum of 10 seconds, while before subsequent trials, it was presented for a minimum of 4 seconds. The test interval (signaled by turning the fixation target to isoluminant blue) contained the target and surround together. Prior to stimulus presentation, the hole within the surround appeared filled-in and had disappeared from view, such that the judgment made by the observer was to compare “target + filling-in” vs. “filling-in” alone. Note that the presence of filling-in this condition distinguishes it from the surround suppression condition, Figure 2b. In the final condition (Figure 2d), the TwAE was induced by presenting the surround alone between test intervals (a minimum of 10 seconds before the 1st trial and a minimum of 4 seconds before subsequent trials). During test intervals, the target was presented on a mean luminance gray background. In this condition, subjects perceived a TwAE in both positions and were asked to report which contained the target (i.e., to compare “TwAE + target” vs. “TwAE” alone). For two observers (S2 and S3), the contrast of the inducing surround stimulus was increased to 50% RMS to produce a robust TwAE.
Figure 2.

Illustration of stimuli for Experiment 1. Subjects fixated the central square and indicated whether a test pattern appeared on the left or right of fixation. (a) Baseline condition (detection threshold). (b) Surround condition. (c) Filling-in condition—note that both surrounds appear completed when the test stimulus is presented. (d) Twinkle aftereffect condition—note that a TwAE appears to be present in both positions.
Raw data from a minimum of four runs per condition were collected in random order and were combined and fit with cumulative Gaussian functions using a bootstrap process (Foster & Bischof, 1987) with 1000 resamples. Detection threshold was expressed for each condition as a multiple of the baseline threshold for each orientation and a Monte Carlo process based on 10,000 iterations was used to estimate 95% confidence intervals on threshold elevations employing the fiducial limits of both baseline and test conditions.
Interocular transfer
Interocular transfer (IOT) of surround suppression, filling-in, and the TwAE were assessed in Experiment 2 with dichoptic stimuli using LCD shutter glasses (NuVision 60GX, MacNaughton Inc., Beaverton, OR). Stimulus presentation was similar to the orientation tuning condition, with the exception that the surround and target consisted of band-pass spatial frequency filtered isotropic white noise, as defined in Equation 1. We elected to use isotropic noise rather than orientation-filtered noise as in Experiment 1 because in pilot trials, we noticed that the TwAE had a non-oriented “blob-like” appearance that more closely resembled isotropic noise than oriented noise. If an oriented surround had been used, observers may have been able to determine which target contained the TwAE by identifying which target center contained blob-like rather than oriented structure, even if the oriented (filled-in) region were more salient. If an oriented surround (and central target) were used in the IOT experiment, it may have differentially affected filling in (which is orientation tuned) and the TwAE (which is not).
Baseline contrast detection thresholds were measured by presenting the target to each eye individually. For each trial, the eye receiving the target was selected at random without the subject’s awareness. IOT of surround suppression was assessed by presenting the target to one eye (selected at random each trial) while the surround was randomly presented to the same or the other eye. To determine transfer of filling-in and the TwAE, the adapting stimulus was presented to one eye throughout each experimental block (at random across blocks) and the target was presented to either eye at random across trials (Figure 3). In filling-in conditions, the inducing pattern was present throughout the entire run. The occurrence of filling-in was verified by waiting for the subject to report its presence before each trial, as in Experiment 1. For TwAE conditions, the inducing pattern was extinguished only during test intervals. The minimum durations of each inducing period were the same as Experiment 1. Detection thresholds were measured for each condition and the data were combined across runs and fit as in Experiment 1.
Figure 3.

Stimulus presentation under dichoptic conditions. Top: Procedure to determine interocular transfer of filling-in. Bottom: Procedure to determine interocular transfer of the TwAE.
Threshold versus contrast
In Experiment 3, contrast detection thresholds were measured as a function of the contrast of the inducing/surround pattern for three conditions: surround suppression, filling-in, and TwAE. The stimuli and presentation conditions were the same as Experiment 1, with the exception that the surround and target consisted of band-pass spatial frequency filtered isotropic white noise, as defined in Equation 1, for the reasons described in Experiment 2. The RMS contrast of the surround pattern was fixed at one of seven levels, 0% and six levels between 1.565% and 50% in log steps. The RMS contrast of the target was under the control of a staircase (Wetherill & Levitt, 1965) designed to find the target contrast that was detected on 79.4% trials. The data were combined across runs and fit as in Experiment 1 to estimate contrast detection thresholds at each inducer/surround contrast for each condition.
Results
Orientation tuning
Orientation tuning results are shown for three observers in Figure 4. These data have been fit with a Gaussian with a peak orientation at 0°. For surround only conditions (blue circles), detection thresholds were elevated at all test orientations and the magnitude of elevation decreased as the orientation difference between the center and surround pattern increased. Thus, for surround conditions, threshold elevation was narrowly tuned for orientation consistent with previous electrophysiological and psychophysical observations (see e.g., Cannon & Fullenkamp, 1991; Sengpiel, Sen, & Blakemore, 1997; Wilson et al., 1983; Xing & Heeger, 2000).
Figure 4.
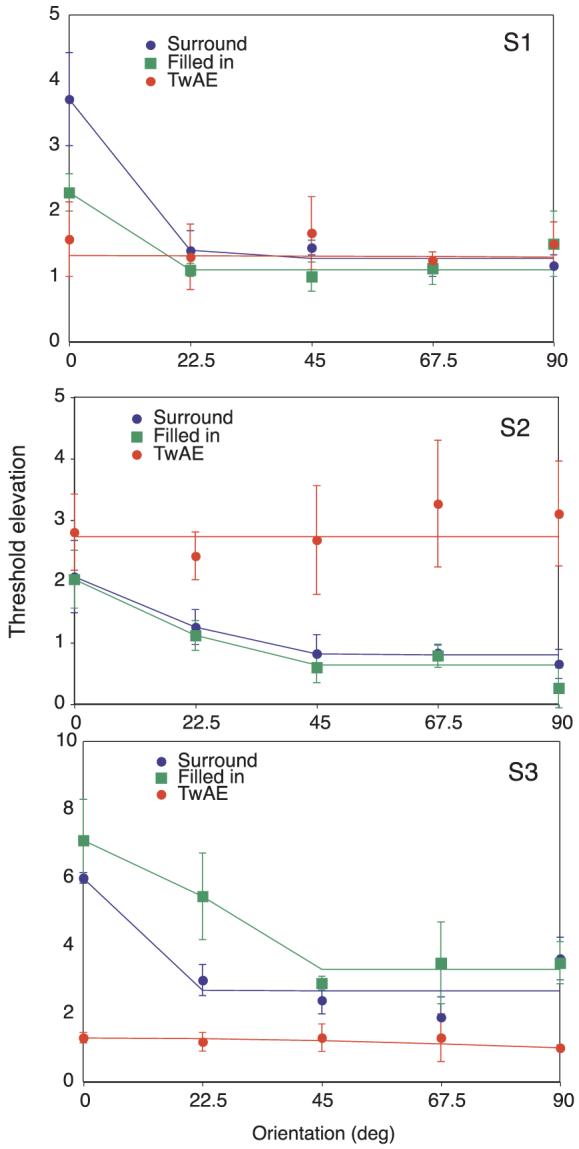
Threshold elevation as a function of orientation for three observers under the surround condition (blue circles, blue line), the filled-in condition (green squares, green line) and during the twinkle aftereffect (red circles, red line). Error bars show ±95% confidence intervals.
For filling-in conditions (green data), threshold elevation was also narrowly tuned for orientation. While all subjects showed orientation tuning and elevated thresholds for iso-oriented inducer and test combinations, the magnitude of threshold elevation was highly variable across subjects. Subjects 1 and 3 showed threshold elevation at all test orientations. Subject 2 shows some evidence of facilitation when the orientation difference between inducer and test pattern was large, even though this subject showed clear elevations at all center-surround combinations for surround conditions. This variability and the possibility of facilitation could arise from the effects of TvC functions in the different observers (see Experiment 3 and Morgan et al.,2007). Thresholds for the TwAE condition (red data) were also elevated but, unlike surround and filling-in conditions, there was no evidence for orientation tuning.
Interocular transfer
Results for the IOT experiment are shown in Figure 5. For each condition, detection thresholds are expressed as a multiple of baseline contrast detection threshold for both the adapted (Ad) and the non-adapted (NonAd) eye. Reading the figure from left to right, it can be seen that (i) the presence of a surround in either eye generally increases detection thresholds in both eyes; (ii) the filling-in increases detection thresholds in both the eye in which filling-in was induced and in the fellow eye; and (iii) the presence of the TwAE has no reliable effect on detection thresholds in either the eye in which the TwAE was induced or the fellow eye. Once again the magnitude of threshold elevation was highly variable across subjects and conditions.
Figure 5.

Contrast threshold elevation for four observers and six conditions. Ad: Adapted eye. NonAd: Nonadapted eye. +Surround: Condition with surround present during target presentation. +Filling-in: Condition with filling in induced (surround present for adaptation and with target). +TwAE: Condition with twinkle aftereffect induced (surround present for adaptation and absent with target). Error bars show 95% confidence intervals.
Threshold versus contrast
Results for the TvC experiment are shown for two observers (S1 and S2) in Figure 6. Blue triangles and green squares show data for the surround only and the filling in condition, respectively. These data have been fit with a Weber fraction:
| (3) |
where c is RMS contrast of the inducer/surround pattern, θ is threshold contrast, and w is the Weber fraction. It can be seen that RMS contrast thresholds rise monotonically with the contrast of a surround pattern (blue triangles) with no evidence of any “dipper,” in line with previous studies (Kontsevich & Tyler, 1999; Solomon, Lavie, & Morgan, 1997). Thresholds are further elevated when filling in is present as well as a surround pattern (green squares), indicating that the illusory noise of filling in raises contrast detection threshold for target noise presented within it, but with no evidence for a “dipper.” Red circles show data for the TwAE condition and show that contrast thresholds are lower following a period of adaptation to a low contrast-inducing pattern. The data have been fit with a dipper function derived from the best-fitting Naka-Rushton contrast response function:
| (4) |
where r is contrast response, c is the RMS contrast of the inducer/surround, z is a constant, and p and q control the slope of the accelerating and decelerating parts of the function. The presence of a weak dipper is in agreement with previous studies (Morgan et al., 2007) and indicates that the illusory noise of filling in modulates the contrast detection threshold for target noise presented within it. However, here we show a (weak) dipper function with an illusory “pedestal” whose effective contrast is modulated by the inducer contrast compared with a real noise pedestal as used in previous studies (Morgan et al., 2007).
Figure 6.
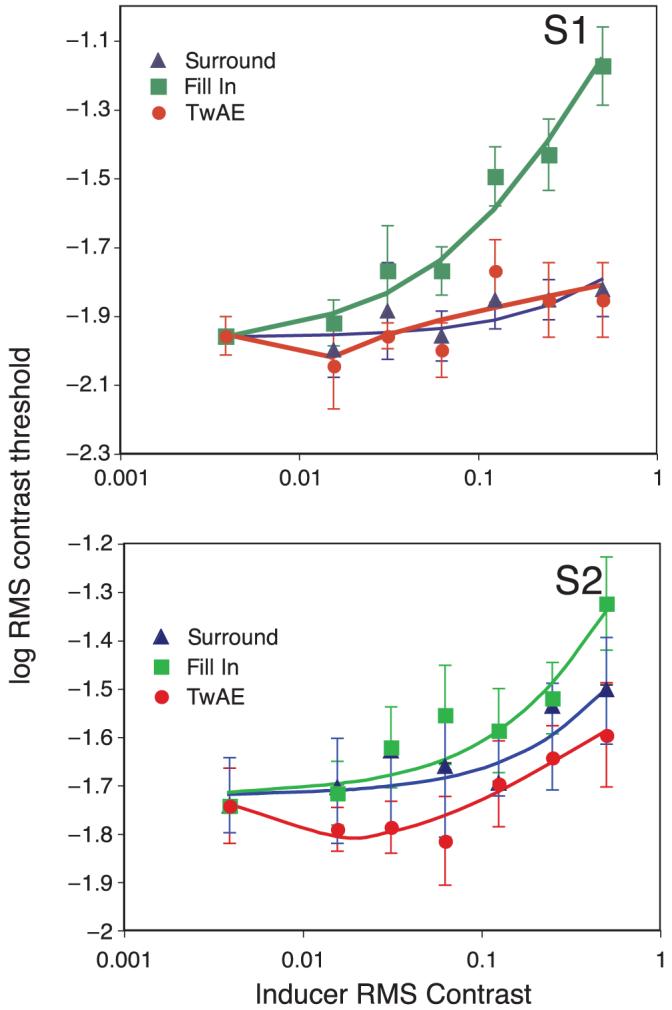
Threshold versus contrast functions for two observers and three conditions. The x axis shows the RMS contrast of the inducing/surround noise pattern, the y axis shows the RMS contrast of the target noise that produced correct detection on 75% trials. Blue triangles and green squares show data for the surround only and the filling in condition respectively. These data have been fit with a simple Weber fraction (see text). Red circles show data for the TwAE condition, which have been fit with a dipper function that is the derivative of a sigmoidal contrast response function. Error bars show 95% confidence intervals.
Discussion
The local interruption of spatial vision by the presence of a real (Crossland et al., 2007) or an artificial (Ramachandran & Gregory, 1991) scotoma in a surrounding pattern is associated with two sensory phenomena: first, the scotoma may appear “filled in” with surrounding texture, and second, a twinkling afterimage may be appear in the locus of the scotoma when the surrounding texture is extinguished. A key observation in our recent study of these phenomena in patients with real scotomas is that some patients who experience filing in may not experience a TwAE and other patients who experience a TwAE may not experience filling in (Crossland et al., 2007). We also noted informally in the present studies that inducing patterns sometimes gave rise to strong TwAEs without having generated filling in during the inducing phase. Our present data examine the functional relationship between these phenomena for artificial scotomas in normally sighted observers and highlight important differences between them. We identify three properties which suggest that these phenomena originate at different levels of visual processing. These observations have important implications for the use of the two phenomena in clinical vision applications.
Filling-in
Experiment 1 used orientation and spatial frequency narrow-band noise to induce filling-in in a central artificial scotoma (a textureless patch of mean luminance). When the artificial scotoma was surrounded by an inducing pattern and appeared filled-in, detection thresholds were elevated for an orientation and spatial frequency narrow-band noise target presented within the scotoma. This effect was narrowly tuned for orientation, in that the threshold was raised considerably more for a target which was parallel to the inducing pattern (and to its filled-in percept) than for a target that was orthogonal to it. It is well established that orientation tuning is first observed in the primary visual cortex of primate brains, our data therefore suggest that surround effects and filling-in originate at a cortical level. Note that it is possible that surround effects and filling-in could be present at earlier stages of visual processing, by the numerous cortical feedback projections to lateral geniculate nucleus (Andolina, Jones, Wang, & Sillito, 2007; Murphy, Duckett, & Sillito, 1999), but the orientation tuning suggests that such feedback is cortical in origin.
The minimal difference between the blue and green curves in Figure 4, particularly for S2, implies that that the threshold elevation we notice for the filled-in condition mostly reflects a suppressive effect from the surround, with little or no effect of filling in. However, Experiments 2 and 3 identify differences between these two conditions. Experiment 2 examined the interocular transfer of surround suppression and filling-in. The results (Figure 5) showed complete IOT of filling-in and the effect was greater (on average across observers) than for a surround pattern alone. This implies that the locus at which surround suppression and filling-in occur in the visual system involves neurons with binocular rather than monocular receptive fields. Although cells within the early visual system can be modulated by input to the contra-lateral eye (e.g., Rodieck & Dreher, 1979), it is generally accepted that the earliest region of the primate visual system with binocular receptive fields is V1. Our results suggest that the locus of surround suppression and filling-in must be at, or later than, primary visual cortex.
In Experiment 3, we measured TvC functions for inducer/surround RMS contrasts from 0% up to 50%. The results showed that overall thresholds were greater for the filling in condition than for the surround only condition, indicating that the presence of illusory filled in structure in the locus of the artificial scotoma modulated the visibility of real structure at that location. However, the differences were very small in some cases, notably at 25% RMS contrast where we collected the data in Experiments 1 and 2. This may explain why the results for surround suppression and filling in were not significantly different across observers in of Experiments 1 and 2. The absence of a dipper means that there is no evidence for subthreshold summation between the illusory noise of filling in and the real noise of the target. We speculate that low level internal noise should be indistinguishable from externally driven noise and should therefore show subthreshold summation and a dipper-shaped TvC function. Alternatively, higher-level pattern completion might not show the same summation and this might account for the lack of a dipper function. We acknowledge that this speculation cannot be taken as evidence for any particular cortical loci, but it does suggest that filling in and the TwAE originate at different loci.
These results and conclusions are consistent with electrophysiological evidence (De Weerd et al., 1995) and recent functional imaging studies (Mendola et al., 2006; Weil, Kilner, Haynes, & Rees, 2007) pointing to a cortical locus for filling in. In a study of perceptual rivalry, He and Davis (2001) showed that illusory filled-in structure at the physiological blind spot could rival real structure at the corresponding location in the fellow eye. This demonstrates that filling-in takes place before the level of binocular rivalry (at least in the case of the physiological blind spot). It is therefore possible that rivalry could exist between the target and the filled-in percept in our IOT experiment. However, the physical location of our non-target, filled-in pattern was spatially homogenous and would not be expected to elicit rivalry with the oriented target stimulus. Further, none of our subjects reported any alternation or switching of the percept between the target and a filled-in region.
The twinkle aftereffect
The presence of the twinkle aftereffect also increased the threshold for target detection in a similar way to the presence of real noise, confirming the recent results of Morgan and colleagues (2007). In the present study, we find that this threshold elevation is independent of the orientations of the inducing pattern and the target. This absence of orientation tuning implies that the TwAE is pre-cortical in origin. In their detailed analysis of the locus of the TwAE, Hardage and Tyler (1995) considered several locations in the visual system where this effect may originate, including retinal ganglion cells, the lateral geniculate nucleus, V1, and MT. In their report, they postulated that the TwAE “appears to arise from orientation-selective cortical neurons,” based on observation and personal communication. Here we show that the TwAE does not show such orientation selectivity.
In Experiment 2, IOT of threshold elevation was found for the surround-only and filling-in conditions, but not when the TwAE was induced monocularly in either the adapted or non-adapted eye. It should be noted that less threshold elevation is seen for the surround only and filling-in conditions in the adapted eye in Experiment 2 than in Experiment 1. There are two possible explanations for this: first, subjects have both eyes open in Experiment 2 while the stimulus is only presented to one eye, reducing the overall contrast of the target. Secondly, the inducing pattern was isotropic, as opposed to oriented, noise, which also decreases the effective contrast within a detector that is not tuned for orientation, as we establish in Experiment 1 is the case for the TwAE.
It is surprising that thresholds were not elevated for the TwAE in the adapted eye in this experiment. Our observers experienced the TwAE throughout the experiment and were asked to report any disappearance of the twinkling throughout data collection, but no subjects reported that the TwAE ever disappeared. These results reinforce the observation of Hardage and Tyler (1995) that the TwAE does not transfer interocularly. We speculate that the reason for this result could depend on the effective magnitude of the TwAE. In Experiment 3, we confirmed Morgan’s observation that the TwAE can produce inhibition, facilitation, or no change of detection thresholds, following a classic dipper function paradigm (Legge & Foley, 1980). The results of Experiment 3 show that at our testing conditions (12.5% binocular RMS contrast) coincided with the contrast at which the inducer produced minimal change in contrast detection threshold. The presence of the dipper in Experiment 3 shows that there is subthreshold summation between the illusory noise of the TwAE and the real noise of the target. Although the TwAE data in Figure 6 do not strongly support the presence of a dipper, the dipper function provides a better fit for these data than a Weber function (S1: Weber function r2 = 0.64; Dipper function r2 = 0.79; S2: Weber function r2 = 0.82; Dipper function r2 = 0.84).
Based on the lack of orientation tuning and the subthreshold summation between the TwAE and real noise, we tentatively suggest that the most likely locus for the TwAE is within monocular magnocellular retinal ganglion cells and/or lateral geniculate nucleus cells with relatively small receptive fields and which respond preferentially to dynamic stimuli (Allman, Miezin, & McGuinness, 1985; Cleland, Dubin, & Levick, 1971; Kaplan & Shapley, 1982; Rodieck, 1965) and whose responses are attenuated following adaptation, unlike those of parvocellular cells (Solomon, Peirce, Dhruv, & Lennie, 2004). We speculate that the TwAE occurs because of an imbalance in the relative activity of such low-level neurons following adaptation. Those with receptive fields falling within the artificial scotoma are less adapted than those with receptive fields falling within the noise. Upon extinction of the inducing pattern, the baseline activity of unadapted detectors within the scotoma exceeds that of those adapted neurons with receptive fields falling within the noise. This imbalance is not distinguishable from the presence of real dynamic structure in the unadapted areas.
Our finding of a separate mechanism for filling-in and the TwAE is consistent with the conclusions of several other groups (Hardage & Tyler, 1995; Reich, Levi, & Frishman, 2000; Tyler & Hardage, 1998). Although our suggestion of an early monocular locus for the TwAE is novel, it does not contradict previous work: Hardage and Tyler (1995) supposed that this effect occurred within cortex on the (false) assumption that it was orientation tuned but suggested several early visual areas where the TwAE could feasibly originate. Using functional imaging, Chen and colleagues (2005) found a post-stimulation BOLD rebound in all retinotopic areas of cortex, which would be consistent with an early locus for this effect.
The different characteristics of filling-in and the TwAE lead us to support the view expressed by Tyler and colleagues that the TwAE is not caused by a persistence of filling-in. It has been suggested that filling-in and the TwAE can occur simultaneously (Reich et al., 2000). If this were true, it may mean that Morgan and colleagues (2007) reported properties of filling-in as well as the “phantasm” (TwAE) alone. This may explain the apparent contradiction between our suggested early locus for the TwAE and the interocular transfer of the phantasms reported by Morgan.
We have recently shown that the TwAE can be used to determine the presence and extent of scotomas in people with retinal disease, and that this effect can be observed in those who do and those who do not experience filling-in (Crossland et al., 2007). The psychophysical results reported here add weight to our earlier conclusion that these phenomena are independent of each other and support our endeavor to use the TwAE to identify scotomas in the early stages of visual processing.
Conclusions
We have shown that dynamic surround suppression and filling-in show narrow orientation tuning, high levels of interocular transfer, and no subthreshold summation between the real noise of the stimulus and illusory noise of filling in. These properties suggest that these phenomena originate in the visual cortex. Conversely, the twinkle aftereffect shows subthreshold summation between the stimulus and illusory noise and broad orientation tuning, which is characteristic of a pre-cortical process. Our data support the consensus opinion that the TwAE is caused by a post-inhibitory hyperpolarization of early monocular cells and that it is independent of filling-in. We speculate that the TwAE originates in y-type retinal ganglion cells or magnocellular cells in lateral geniculate nucleus.
Acknowledgments
This research was supported by the Wellcome Trust, UK and by the United States Department of Defense, Military Vision Research Program, W81XWH-07-0038. Some elements of this work were presented at the European Conference on Vision Perception, Arezzo, Italy, September 2007.
Footnotes
Commercial relationships: none.
Contributor Information
Michael D. Crossland, UCL Institute of Ophthalmology, London, UK
Peter J. Bex, Schepens Eye Research Institute, Harvard Medical School, Boston, MA, USA, & UCL Institute of Ophthalmology, London, UK
References
- Allman J, Miezin F, McGuinness E. Stimulus specific responses from beyond the classical receptive field: Neurophysiological mechanisms for local-global comparisons in visual neurons. Annual Review of Neuroscience. 1985;8:407–430. doi: 10.1146/annurev.ne.08.030185.002203. [DOI] [PubMed] [Google Scholar]
- Andolina IM, Jones HE, Wang W, Sillito AM. Corticothalamic feedback enhances stimulus response precision in the visual system. Proceedings of the National Academy of Sciences of the United States of America. 2007;104:1685–1690. doi: 10.1073/pnas.0609318104. [DOI] [PMC free article] [PubMed] [Google Scholar]
- Baker CI, Peli E, Knouf N, Kanwisher NG. Reorganization of visual processing in macular degeneration. Journal of Neuroscience. 2005;25:614–618. doi: 10.1523/JNEUROSCI.3476-04.2005. [DOI] [PMC free article] [PubMed] [Google Scholar]
- Blakemore C, Campbell FW. On the existence of neurones in the human visual system selectively sensitive to the orientation and size of retinal images. The Journal of Physiology. 1969;203:237–260. doi: 10.1113/jphysiol.1969.sp008862. [DOI] [PMC free article] [PubMed] [Google Scholar]
- Brainard DH. The Psychophysics Toolbox. Spatial Vision. 1997;10:433–436. [PubMed] [Google Scholar]
- Cannon MW, Fullenkamp SC. Spatial interactions in apparent contrast: Inhibitory effects among grating patterns of different spatial frequencies, spatial positions and orientations. Vision Research. 1991;31:1985–1998. doi: 10.1016/0042-6989(91)90193-9. [DOI] [PubMed] [Google Scholar]
- Chen CC, Tyler CW, Liu CL, Wang YH. Lateral modulation of BOLD activation in unstimulated regions of the human visual cortex. Neuroimage. 2005;24:802–809. doi: 10.1016/j.neuroimage.2004.09.021. [DOI] [PubMed] [Google Scholar]
- Cleland BG, Dubin MW, Levick WR. Sustained and transient neurones in the cat’s retina and lateral geniculate nucleus. The Journal of Physiology. 1971;217:473–496. doi: 10.1113/jphysiol.1971.sp009581. [DOI] [PMC free article] [PubMed] [Google Scholar]
- Crossland MD, Dakin SC, Bex PJ. Illusory stimuli can be used to identify retinal blind spots. PLoS ONE. 2007;2:e1060. doi: 10.1371/journal.pone.0001060. [DOI] [PMC free article] [PubMed] [Google Scholar]
- De Weerd P, Desimone R, Ungerleider LG. Perceptual filling-in: A parametric study. Vision Research. 1998;38:2721–2734. doi: 10.1016/s0042-6989(97)00432-x. [DOI] [PubMed] [Google Scholar]
- De Weerd P, Gattass R, Desimone R, Ungerleider LG. Responses of cells in monkey visual cortex during perceptual filling-in of an artificial scotoma. Nature. 1995;377:731–734. doi: 10.1038/377731a0. [DOI] [PubMed] [Google Scholar]
- Foster DH, Bischof WF. Bootstrap variance estimators for the parameters of small-sample sensory-performance functions. Biological Cybernetics. 1987;57:341–347. doi: 10.1007/BF00338826. [DOI] [PubMed] [Google Scholar]
- Gyoba J. Loss of a forest: Perceptual fading and filling-in of static texture patterns. Perception. 1997;26:1317–1320. doi: 10.1068/p261317. [DOI] [PubMed] [Google Scholar]
- Hardage L, Tyler CW. Induced twinkle aftereffect as a probe of dynamic visual processing mechanisms. Vision Research. 1995;35:757–766. doi: 10.1016/0042-6989(94)00167-k. [DOI] [PubMed] [Google Scholar]
- He S, Davis WL. Filling-in at the natural blind spot contributes to binocular rivalry. Vision Research. 2001;41:835–840. doi: 10.1016/s0042-6989(00)00315-1. [DOI] [PubMed] [Google Scholar]
- Hubel DH, Wiesel TN. Receptive fields, binocular interaction and functional architecture in the cat’s visual cortex. The Journal of Physiology. 1962;160:106–154. doi: 10.1113/jphysiol.1962.sp006837. [DOI] [PMC free article] [PubMed] [Google Scholar]
- Kapadia MK, Gilbert CD, Westheimer G. A quantitative measure for short-term cortical plasticity in human vision. Journal of Neuroscience. 1994;14:451–457. doi: 10.1523/JNEUROSCI.14-01-00451.1994. [DOI] [PMC free article] [PubMed] [Google Scholar]
- Kaplan E, Shapley RM. X and Y cells in the lateral geniculate nucleus of macaque monkeys. The Journal of Physiology. 1982;330:125–143. doi: 10.1113/jphysiol.1982.sp014333. [DOI] [PMC free article] [PubMed] [Google Scholar]
- Kontsevich LL, Tyler CW. Nonlinearities of near-threshold contrast transduction. Vision Research. 1999;39:1869–1880. doi: 10.1016/s0042-6989(98)00286-7. [DOI] [PubMed] [Google Scholar]
- Legge GE, Foley JM. Contrast masking in human vision. Journal of the Optical Society of America. 1980;70:1458–1471. doi: 10.1364/josa.70.001458. [DOI] [PubMed] [Google Scholar]
- Mendola JD, Conner IP, Sharma S, Bahekar A, Lemieux S. fMRI measures of perceptual filling-in in the human visual cortex. Journal of Cognitive Neuroscience. 2006;18:363–375. doi: 10.1162/089892906775990624. [DOI] [PubMed] [Google Scholar]
- Morgan MJ, McEwan W, Solomon J. The lingering effects of an artificial blind spot. PLoS ONE. 2007;2:e256. doi: 10.1371/journal.pone.0000256. [DOI] [PMC free article] [PubMed] [Google Scholar]
- Movshon JA, Blakemore C. Orientation specificity and spatial selectivity in human vision. Perception. 1973;2:53–60. doi: 10.1068/p020053. [DOI] [PubMed] [Google Scholar]
- Murphy PC, Duckett SG, Sillito AM. Feedback connections to the lateral geniculate nucleus and cortical response properties. Science. 1999;286:1552–1554. doi: 10.1126/science.286.5444.1552. [DOI] [PubMed] [Google Scholar]
- Pelli DG. The VideoToolbox software for visual psychophysics: Transforming numbers into movies. Spatial Vision. 1997;10:437–442. [PubMed] [Google Scholar]
- Ramachandran VS, Gregory RL. Perceptual filling-in of artificially induced scotomas in human vision. Nature. 1991;350:699–702. doi: 10.1038/350699a0. [DOI] [PubMed] [Google Scholar]
- Ramachandran VS, Gregory RL, Aiken W. Perceptual fading of visual texture borders. Vision Research. 1993;33:717–721. doi: 10.1016/0042-6989(93)90191-x. [DOI] [PubMed] [Google Scholar]
- Reich LN, Levi DM, Frishman LJ. Dynamic random noise shrinks the twinkling aftereffect induced by artificial scotomas. Vision Research. 2000;40:805–816. doi: 10.1016/s0042-6989(99)00215-1. [DOI] [PubMed] [Google Scholar]
- Rodieck RW. Quantitative analysis of cat retinal ganglion cell response to visual stimuli. Vision Research. 1965;5:583–601. doi: 10.1016/0042-6989(65)90033-7. [DOI] [PubMed] [Google Scholar]
- Rodieck RW, Dreher B. Visual suppression from nondominant eye in the lateral geniculate nucleus: A comparison of cat and monkey. Experimental Brain Research. 1979;35:465–477. doi: 10.1007/BF00236765. [DOI] [PubMed] [Google Scholar]
- Sakaguchi Y. Target/surround asymmetry in perceptual filling-in. Vision Research. 2001;41:2065–2077. doi: 10.1016/s0042-6989(01)00095-5. [DOI] [PubMed] [Google Scholar]
- Sengpiel F, Sen A, Blakemore C. Characteristics of surround inhibition in cat area 17. Experimental Brain Research. 1997;116:216–228. doi: 10.1007/pl00005751. [DOI] [PubMed] [Google Scholar]
- Smirnakis SM, Brewer AA, Schmid MC, Tolias AS, Schüz A, Augath M, et al. Lack of long-term cortical reorganization after macaque retinal lesions. Nature. 2005;435:300–307. doi: 10.1038/nature03495. [DOI] [PubMed] [Google Scholar]
- Solomon JA, Lavie N, Morgan MJ. Contrast discrimination function: Spatial cuing effects. Journal of the Optical Society of America A, Optics, Image Science, and Vision. 1997;14:2443–2448. doi: 10.1364/josaa.14.002443. [DOI] [PubMed] [Google Scholar]
- Solomon SG, Peirce JW, Dhruv NT, Lennie P. Profound contrast adaptation early in the visual pathway. Neuron. 2004;42:155–162. doi: 10.1016/s0896-6273(04)00178-3. [DOI] [PubMed] [Google Scholar]
- Spillmann L, Kurtenbach A. Dynamic noise backgrounds facilitate target fading. Vision Research. 1992;32:1941–1946. doi: 10.1016/0042-6989(92)90053-l. [DOI] [PubMed] [Google Scholar]
- Sunness JS, Liu T, Yantis S. Retinotopic mapping of the visual cortex using functional magnetic resonance imaging in a patient with central scotomas from atrophic macular degeneration. Ophthalmology. 2004;111:1595–1598. doi: 10.1016/j.ophtha.2003.12.050. [DOI] [PubMed] [Google Scholar]
- Tailby C, Metha A. Artificial scotoma-induced perceptual distortions are orientation dependent and short lived. Visual Neuroscience. 2004;21:79–87. doi: 10.1017/s0952523804041082. [DOI] [PubMed] [Google Scholar]
- Tyler CW. Colour bit-stealing to enhance the luminance resolution of digital displays on a single pixel basis. Spatial Vision. 1997;10:369–377. doi: 10.1163/156856897x00294. [DOI] [PubMed] [Google Scholar]
- Tyler CW, Hardage L. Long-range twinkle induction: An achromatic rebound effect in the magnocellular processing system? Perception. 1998;27:203–214. doi: 10.1068/p270203. [DOI] [PubMed] [Google Scholar]
- Weil RS, Kilner JM, Haynes JD, Rees G. Neural correlates of perceptual filling-in of an artificial scotoma in humans. Proceedings of the National Academy of Sciences of the United States of America. 2007;104:5211–5216. doi: 10.1073/pnas.0609294104. [DOI] [PMC free article] [PubMed] [Google Scholar]
- Welchman AE, Harris JM. Filling-in the details on perceptual fading. Vision Research. 2001;41:2107–2117. doi: 10.1016/s0042-6989(01)00087-6. [DOI] [PubMed] [Google Scholar]
- Wetherill GB, Levitt H. Sequential estimation of points on a psychometric function. British Journal of Mathematical and Statistical Psychology. 1965;18:1–10. doi: 10.1111/j.2044-8317.1965.tb00689.x. [DOI] [PubMed] [Google Scholar]
- Wilson HR, McFarlane DK, Phillips GC. Spatial frequency tuning of orientation selective units estimated by oblique masking. Vision Research. 1983;23:873–882. doi: 10.1016/0042-6989(83)90055-x. [DOI] [PubMed] [Google Scholar]
- Xing J, Heeger DJ. Center-surround interactions in foveal and peripheral vision. Vision Research. 2000;40:3065–3072. doi: 10.1016/s0042-6989(00)00152-8. [DOI] [PubMed] [Google Scholar]