

Abstract
The fungus Stagonospora nodorum is a causal agent of leaf and glume blotch disease of wheat. It has been previously shown that inactivation of heterotrimeric G protein signaling in Stagonospora nodorum caused development defects and reduced pathogenicity [P. S. Solomon et al., Mol. Plant-Microbe Interact. 17:456-466, 2004]. In this study, we sought to identify targets of the signaling pathway that may have contributed to phenotypic defects of the signaling mutants. A comparative analysis of Stagonospora nodorum wild-type and Gα-defective mutant (gna1) intracellular proteomes was performed via two-dimensional polyacrylamide gel electrophoresis. Several proteins showed significantly altered abundances when comparing the two strains. One such protein, the short-chain dehydrogenase Sch1, was 18-fold less abundant in the gna1 strain, implying that it is positively regulated by Gα signaling. Gene expression and transcriptional enhanced green fluorescent protein fusion analyses of Sch1 indicates strong expression during asexual development. Mutant strains of Stagonospora nodorum lacking Sch1 demonstrated poor growth on minimal media and exhibited a significant reduction in asexual sporulation on all growth media examined. Detailed histological experiments on sch1 pycnidia revealed that the gene is required for the differentiation of the subparietal layers of asexual pycnidia resulting in a significant reduction in both pycnidiospore size and numbers.
The heterotrimeric G protein family is a universal eukaryotic signaling component. The heterotrimer consists of α, β, and γ subunits that are coupled to the cytoplasmic side of a membrane-bound G protein-coupled receptor. The binding of a ligand to the G protein-coupled receptor causes the exchange of GDP for GTP on the Gα subunit resulting in its dissociation from the Gβ-Gγ complex. The released Gα subunit can then activate downstream cellular effectors (4, 51). Four different classes of mammalian Gα proteins have been proposed based on the amino acid sequence relationships (39). The Gαs and Gαi classes function to stimulate and inhibit cyclic AMP production, respectively, whereas Gαq subunits function within the phosphatidylinositol pathway and Gα12/13 activates signaling through the small Rho GTPase (27, 39).
The roles of heterotrimeric G proteins in plant pathogenic fungi have been extensively studied (3, 28). At least 23 Gα genes of plant pathogenic fungi have been reported in the literature thus far. These 23 genes can be subdivided into two groups related to the mammalian Gαs and Gαi proteins based on the amino acid sequences (3). Mutants that are impaired in Gαi subunits often possess significant phenotypic defects that can affect the fitness of the pathogen (11, 14, 16, 21, 22, 31, 32, 46, 56, 66), implying that this signal transduction system controls processes vital for pathogenicity (Table 1). Transcriptomics has been used to elucidate targets of Gαi subunit signaling in the gray mold Botrytis cinerea and the chestnut blight fungus Cryphonectria parasitica. These studies have shown signaling regulation of the botrydial toxin gene bot1 in B. cinerea (17, 50) and hypovirus-responsive genes in C. parasitica (8), respectively.
TABLE 1.
Phenotypes of plant pathogenic fungi defective in Gαi protein signaling
| Organism | Gαi gene | Functions |
|---|---|---|
| Stagonospora nodorum | Gna1 | Pycnidiation, extracellular protease secretion, DOPA metabolism, and virulence |
| Alternaria alternata | Aga1 | Conidial germ tube formation and virulence |
| Botrytis cinerea | Bcg1 | Vegetative growth, conidiation, extracellular protease secretion, and virulence |
| Cochliobolus heterostrophus | Cga1 | Appressorium formation and female fertility |
| Colletotrichum trifolii | Ctg1 | Vegetative growth, conidial germination, and virulence |
| Cryphonectria parasitica | Cpg1 | Colony morphology, female fertility, pigmentation, hydrophobin expression, and virulence |
| Fusarium oxysporum | Fga1 | Conidiation, heat resistance, and virulence |
| Magnaporthe grisea | MagB | Vegetative growth, conidiation, appressorium formation, female fertility, and virulence |
Proteomic approaches provide a complementary means of identifying targets of G protein signaling. Previously, such approaches have been used to study phytopathogenic fungi through protein profiling (2, 5, 12, 42, 44) and to identify host- (45) and morphogenesis-responsive (25) proteins. Recent sequencing of the genomes of the phytopathogenic fungi Magnaporthe grisea, Ustilago maydis, Fusarium graminearum, and Stagonospora nodorum (7, 9, 19, 24) provides an opportunity for more thorough mass spectrometry (MS)-based proteomic analyses (2, 42).
Stagonospora nodorum is a major fungal pathogen of wheat (53). The role of signal transduction in the pathogenicity of S. nodorum has been recently scrutinized (54, 56, 59). Of particular interest were strains harboring an impaired Gα gene, Gna1. Mutants were reduced in their ability to colonize the host, and they failed to sporulate, showed an albino phenotype, and reduced extracellular depolymerase activities. It was hypothesized that these impairments were a result of changes in the state or abundance of heterotrimeric G protein signaling targets. The aim of this experiment was to identify and functionally characterize proteins regulated by the Gna1 protein by using two-dimensional polyacrylamide gel electrophoresis (2D-PAGE). This proteomic approach has led to the identification of several proteins regulated by Gna1 signaling, including Sch1, a short-chain dehydrogenase that is positively regulated. Subsequent genetic dissection of Sch1 revealed it has a required role in asexual development, a critical facet of disease for this polycyclic pathogen.
MATERIALS AND METHODS
Gene nomenclature.
The nomenclature of all S. nodorum genes mentioned in this study are denoted by the prefix “SNOG” used in conjunction with the designated gene number. Details of the version 2 annotated sequenced genome can be found at NCBI (http://www.ncbi.nlm.nih.gov/entrez/viewer.fcgi?db=nuccore&id=62183523).
Growth and maintenance of Stagonospora nodorum.
S. nodorum wild-type strain SN15 (Department of Agriculture, Western Australia) and the gna1-35 strain carrying a disruption in Gna1 (GenBank accession number EAT82421) were used in this study and were maintained on complex media as described previously (56). For the analysis of the intracellular proteome, 150 mg of fungal mycelia were grown in minimal medium (MM) broth (pH 6.0), which consisted of 30 g liter−1 glucose as a carbon source. The fungus was grown to a vegetative phase by incubation at 22°C with shaking at 150 rpm for 3 days. Mycelia were harvested and freeze-dried overnight.
Growth and maintenance of wheat.
Growth of Triticum aestivum (cv. Amery) and wheat infections were performed as previously described (56).
Protein extraction.
For intracellular proteins, freeze-dried mycelia were homogenized with a cooled mortar and pestle with 10 mM Tris (pH 7.6) and 1 mM phenylmethylsulfonyl fluoride. Glass beads (106 μm) of equal volume to the mycelia were used to assist with tissue grinding. The crude homogenate was collected and centrifuged at 20,000 × g for 1 h at 4°C. The resulting supernatant was retained and incubated with 20 units of DNase and 20 units of RNase for 1 h at 25°C. Following this, proteins were precipitated with 9 volumes of ice-cold acetone. Precipitated proteins were collected by centrifugation at 4,000 × g for 15 min at 4°C and washed with 90% ice-cold acetone. Precipitated proteins were solubilized with multiple surfactant solution, which consisted of 40 mM Tris, 2% (wt/vol) 3-[(3-cholamidoprophyl)-dimethylammonio]-1-propanesulfonate (CHAPS), 2% (wt/vol) sulfobetaine 3-10, 5 M urea, 2 M thiourea, 2 mM tributylphosphine (Bio-Rad), 0.2% (vol/vol) Bio-Lyte 3-10 (Bio-Rad), and 0.002% (wt/vol) bromophenol blue (Bio-Rad). A probe tip Misonix XL2015 sonicator set to an output of 95 W and a 25% s−1 pulsar duty cycle was used to assist in protein solubilization. Unless denoted otherwise, all chemicals used were purchased from Sigma-Aldrich.
2D-PAGE.
Protein concentration was estimated with a Bio-Rad RC DC protein assay kit. For isoelectric focusing, Bio-Rad 7-cm immobilized pH gradient strips were rehydrated with multiple-surfactant solution containing the protein sample (200 μg to 300 μg) in a Bio-Rad Protean isoelectric focusing cell (50 V for 16 h) prior to focusing at 250 V for 15 min and 14,000 V-h (rapid ramping). The proteins in the immobilized pH gradient strip were equilibrated for 20 min with 6 M urea, 0.38 M Tris (pH 8.8), 4% (wt/vol) sodium dodecyl sulfate, 20% (vol/vol) glycerol, and 2% (wt/vol) DTT and a further 20 min in the same buffer that consisted of 2.5% (wt/vol) iodoacetamide substituted for DTT. Equilibrated proteins were separated in a second dimension in manually cast 12% sodium dodecyl sulfate polyacrylamide gels. Gels were visualized via colloidal Coomassie G250 staining (38).
Gel image acquisition and densitometry analysis.
Gel images were captured using the ProXpress scanner (Perkin Elmer). Spot detection and gel analyses were performed with the ProGenesis Workstation 2005 software (Linear Dynamics) under default settings. Biological triplicate 2D gels were used to create average gels of the SN15 and gna1-35 strains for comparisons. Protein spots were considered differentially abundant if the P value was <0.05 (unpaired t test) and there was a ≥2-fold difference in the normalized densitometry value of matching spots between the average gels (see Table S1 in the supplemental material). These spots were excised from gels and the proteins trypsin digested (63).
LC-MS/MS analysis and database searching.
Trypsin-digested peptides were analyzed on an Agilent 1100 series capillary LC system coupled to an Applied Biosystems QStar Pulsar i liquid chromatography-tandem MS (LC-MS/MS) system equipped with the IonSpray source in positive ion mode (63). Mass spectrum searches were performed with the Mascot search engine, version 2.1.04 (Matrix Science), against the S. nodorum predicted protein set at NCBI (http://www.ncbi.nlm.nih.gov/entrez/viewer.fcgi?db=nuccorefid=62183523), utilizing error tolerances of ±1.2 for MS and ±0.6 for MS/MS, “max missed cleavages” set to 1, and the “oxidation (M)” variable modification and peptide charge set at 2+ and 3+. Results were filtered using “standard scoring,” “max number of hits” set to 20, “significance threshold” at a P value of <0.05, and “ion score cutoff” at 15. Protein matches were considered positive with identifications that contained at least four matching peptides and MOWSE scores of >100. A putative function was assigned to the matched protein by a BlastP homology search of the NCBI nonredundant protein database (minimum expected value cutoff score of 10−8).
RNA isolation and reverse transcription-PCR (RT-PCR).
RNA isolation and gene transcript abundance were analyzed as previously described (57). SN15 genomic DNA, prepared with a Retsch MM301 autolyzer and a Qiagen BioSprint 15 workstation, was used as a quantitative standard. Intron-spanning primers (Actin F/R) designed to amplify actin (Act1 [GenBank accession number EAT90788]) were used to check all cDNA samples and were free of genomic DNA via PCR (data not shown). All primer sequences from this study can be found in Table S2 in the supplemental material.
Gene expression analyses were performed using in vitro-grown fungal tissue and infected wheat leaves. In vitro gene expression analysis of SN15 and the gna1-35 strain was performed with transcripts extracted under the same growth conditions as those used for the 2D-PAGE analysis. Gene expression was normalized against Act1 transcript abundance. Ef1α is more strongly expressed than Act1 and was easier to detect on infected wheat leaves where fungal mRNA are limiting, particularly during early infection. Consequently, Ef1α was used as the housekeeping gene for the in planta expression studies.
Gene expression between SN15 and the gna1-35 strain were deemed differentially abundant under the criteria that the P value is <0.05 in an unpaired t test and there is a ≥2-fold difference in the normalized transcript abundances. The expression of putative signaling target genes during SN15 infection on wheat was analyzed with an analysis of variance set for the Tukey-Kramer test in conjunction with a Dunnett's test control. Gene expression was deemed significantly different if the P value is <0.05 and there is a ≥2-fold difference in the normalized transcript abundances relative to the Dunnett's test control.
Construction of the Sch1 gene knockout vector.
Sch1 was deleted by gene replacement with a phleomycin resistance selectable marker construct as previously described (54). The 5′ and 3′ untranslated regions (UTRs) of Sch1 were PCR amplified with the primer pairs 5′FwdXhoI-R567/5′RevHindIII-R567 and 3′FwdPstI-R567/3′RevNotI-R567, respectively. Restriction sites were introduced into the primer sequences to facilitate cloning with the phleomycin resistance selectable marker plasmid vector pBSK-phleo (54). The 5′ Sch1 UTR amplicon (562 bp) was cloned into XhoI and HindIII sites of pBSK-phleo to produce pBSK-phleo-5′Sch1. The 3′ Sch1 UTR amplicon (850 bp) was cloned into PstI and NotI sites of pBSK-phleo-5′Sch1 to produce the knockout vector pBSK-Sch1KO. A 3.52-kb gene deletion (knockout [KO]) construct was PCR amplified from pBSK-Sch1KO by using the primer pair R567FwdKO and R567RevKO.
Construction of the Sch1 promoter-eGFP gene expression construct.
The tissue expression pattern of Sch1 was examined with transcriptional fusion of the putative Sch1 promoter sequence and an enhanced green fluorescent protein (eGFP) gene. A 1.8-kb 5′ UTR of Sch1 containing two putative “TATA” Goldberg-Hogness box core promoter sites (30, 52) was PCR amplified with Sch1GFPtransF and Sch1GFPtransR. A partial fragment of pGPD-GFP (49) that consisted of eGFP, a hygromycin resistance cassette, and a TrpC terminator was also amplified with GFP-PCRf and GFP-PCRr. Both PCR fragments were fused using the Sch1GFPtransF and GFP-PCRr primers via overlapping PCR (54), with the resulting amplicon used for the subsequent transformation of SN15. PCR was used to test transformants for appropriate ectopic insertions.
Transformation of S. nodorum.
The protocol for generating protoplasts and genetic transformation of S. nodorum SN15 was as previously described (56).
Southern analysis.
The PCR amplicon of the primer pair 5′FwdXhoI-R567 and 5′FwdXhoI-R567 was used for random labeling to develop a probe for Southern analysis. This was performed as described elsewhere (56).
Infection assays.
Detached leaf and whole plant spray assays were performed as described by Solomon et al. (55).
Histological techniques.
Tissues for longitudinal-section histological examination were fixed and degassed overnight in formal acetic alcohol solution in glass vials (48). For embedding in paraffin, tissues were dehydrated in an ascending series of ethanol (70%, 90%, and 100% ethanol; 3 h for each step), then cleared in chloroform prior to infiltration with molten paraffin wax (Paraplast). The embedded tissues were sectioned at 10 μm using Shandon MX35 knives on a Leica RM2235 microtome.
For embedding in Spurr's resin, the fixed tissues were washed in several changes of 0.025 M phosphate buffer and dehydrated in an ascending series of acetone (30%, 50%, 70%, 90%, and 100% acetone; two changes of each solution and 15 min for each change). The tissues were then infiltrated with an ascending series of Spurr's resin (5% to 90%) (62) and then transferred to 100% Spurr's resin for 2 h, and again overnight at room temperature, before being polymerized at 60°C. The embedded tissues were sectioned at 1 μm on a Reichert Jung 2050 microtome.
The double-stranded-DNA-specific stain 4′,6-diamidino-2-phenylindole dilactate (DAPI) was used to stain paraffin tissue sections according to the manufacturer (Invitrogen). A mixture of 1% methylene blue and 1% azur II in 1% sodium tetraborate solution was used as a general stain as described elsewhere (47).
For transmission electron microscope (TEM) analysis, tissues embedded in Spurr's resin were sectioned at 80 nm using a diamond knife on a Reichart Ultracut E ultramicrotome. The sections were mounted onto 200-mesh copper grids (ProSciTech), stained for 20 min in a saturated aqueous solution of uranyl acetate, washed twice in distilled water, then stained in lead citrate for 4 min and washed again with several changes of distilled water (65). The stained sections were examined at 80 kV on a Philips CM100 biotransmission electron microscope.
For eGFP analysis, mycelia containing pycnidia of the Sch1-eGFP transformant grown on CzV8CS agar were excised and longitudinally hand-sliced with a double-edge stainless-steel razor blade. Sections were viewed under differential interference contrast (DIC) and blue-light excitation (460 to 490 nm) for eGFP fluorescence. Composite images were constructed with the DPManager software (Olympus).
GenBank accession numbers.
Broad-annotated genes analyzed in this study are available in the GenBank/EMBL databases under the accession numbers EAT82552 (Sch1/SNOG_10217), EAT85007 (SNOG_07541), EAT85070 (SNOG_07604), EAT79369 (SNOG_13042), EAT81580 (SNOG_11081), EAT81149 (SNOG_11441), and EAT84551 (SNOG_08275).
RESULTS
Comparative proteomic analysis and identification of genes that correspond to the differentially abundant proteins.
The intracellular proteomes of SN15 and the gna1-35 strain were separated by 2D-PAGE (Fig. 1A and B). A total of 475 unique protein spots were identified in the SN15 and gna1-35 strain samples. Of these, six spots were identified as being >2-fold different in abundance (P < 0.05). Five spots (C1 to C5) were significantly less abundant, and one spot (C6) showed an increase in abundance in the gna1-35 strain. LC-MS/MS analysis was used to obtain spectra of peptides derived from these protein spots, and the resulting data were matched against those of the S. nodorum predicted protein set to find the matching genes (Table 2). Seven genes were identified from the six differentially abundant protein spots. Proteins identified from spots C1 to C5 matched to genes that code for a putative concanamycin-induced protein C (CipC; SNOG_11081), a glutathione S-transferase (SNOG_07604), short-chain dehydrogenases (SNOG_10217 and SNOG_13042), and a proteasome subunit (SNOG_07541). Two proteins (C6-1 and C6-2) were identified from spot C6 and matched to genes that code for 3-dehydroquinate dehydratase (SNOG_11441) and a protein of unknown function (SNOG_08275).
FIG. 1.

(A) Representative 2D-PAGE gels of the SN15 and gna1-35 strains showing differentially abundant proteins in the intracellular proteomes. (B) Subpanels of the regions marked in panel A for each of the biological triplicate samples. Gels representing each of the biological triplicates are available in Fig. S4 in the supplemental material.
TABLE 2.
Identification of differentially abundant proteins with LC-MS/MS and Mascot
| Spot | Differencea | SNOG | Putative identity | Observed pI; predicted pI | Observed pI; predicted Mr (kDa) | MOWSE score; peptide no. (% coverage) | Signal peptideb | Transcript correlationc |
|---|---|---|---|---|---|---|---|---|
| C1 | −2.7 | 13042 | Short-chain dehydrogenase | 5.81; 5.41 | 27.1; 28.9 | 748; 20 (52) | N | Y |
| C2 | −17.5 | 10217 | Short-chain dehydrogenase | 5.94; 5.46 | 28.5; 31.8 | 696; 16 (55) | N | Y |
| C3 | −7.2 | 07541 | Proteasome component | 6.06; 6.20 | 29.2; 27.9 | 256; 7 (37) | N | N |
| C4 | −3.5 | 07604 | Glutathione transferase | 7.43; 6.53 | 23.3; 24.4 | 128; 4 (24) | N | N |
| C5 | −19.2 | 11081 | Concanamycin-induced protein C (CipC) | 5.70; 5.21 | <15.0; 15.1 | 386; 10 (60) | N | Y |
| C6-1 | +4.7 | 11441 | 3-dehydroquinate dehydratase | 7.43; 6.49 | <15.0; 16.5 | 223; 6 (37) | N | Y |
| C6-2 | +4.7 | 08275 | Unknown | 7.43; 6.13 | <15.0; 14.7 | 205; 6 (44) | N | N |
Differences of matching protein spots are calculated from the normalized spot value of SN15 relative to that of the gna1-35 strain.
N, no.
Refer to Fig. 2. Y, yes; N, no.
Transcriptional analysis of putative heterotrimeric G protein signaling target genes.
The expression of genes encoding putative heterotrimeric G protein signaling target proteins was examined with RT-PCR. This was performed to determine whether protein abundance was regulated at the transcriptional or posttranscriptional level. The normalized expression of each gene was compared with protein abundance data to identify relative correlations of protein and transcript abundances. Of the seven genes examined, four showed a positive correlation between protein and transcript abundances, implying that these genes are regulated at the transcriptional level (Fig. 2). Three of these genes (SNOG_13042, SNOG_10217, and SNOG_11081) showed transcriptional downregulation, whereas one (SNOG_11441) was upregulated in the gna1-35 strain. The other three genes (SNOG_07541, SNOG_07604, and SNOG_08275) showed no correlation between protein and transcript abundances.
FIG. 2.

Protein/transcript abundance graphs for each of the targets identified via 2D-PAGE. The transcript profiling of each gene is comprised of two panels. The panels on the left are a comparison of relative protein (white bars) and transcript (black bars) levels for each of the targets in vitro. Asterisks located on top of bar graphs signify significant differences in protein and transcript abundances. “S” and “G” on the x axis denote the SN15 and gna1-35 strains, respectively. The panels on the right (line graphs) depict gene expression in planta for each target gene. Numbers on the x axis are the number of days postinfection, and asterisks denote differential gene expression relative to the Dunnett's test control group. The y axis represents relative gene expression levels normalized to Act1 (in vitro) or Ef1α (in planta). Standard error bars are shown.
Quantitative RT-PCR was also used to determine the expression profiles of these genes in S. nodorum during infection of wheat. Sampling time points were 1, 3, 5, and 8 days postinfection, which coincided with host penetration, proliferation, onset, and late pycnidiation, respectively (61). Six of the genes identified from the proteomic analysis showed significantly differential expression during infection of detached wheat leaves by S. nodorum (Fig. 2). Five of these (SNOG_07541, SNOG_07604, SNOG_10217, SNOG_11441, and SNOG_13042) showed increased expression during late infection coinciding with asexual sporulation. One gene (SNOG_11081) was significantly more expressed during germination and penetration of the host at 1 day postinfection. No expression was detected for SNOG_08275 during in planta growth.
SNOG_10217 encodes a putative short-chain dehydrogenase.
The focus of this study was to identify and functionally characterize targets of Gna1-dependent regulation. SNOG_10217 was chosen for further analysis based on its strong downregulation in the gna1 strains. The open reading frame of SNOG_10217 consists of two introns and encodes a polypeptide of 299 amino acids with a predicted molecular mass and pI of 31.8 kDa and 5.5, respectively. These predicted figures closely match the experimental molecular mass and pI as described above. SNOG_10217 contained a Pfam domain of the short-chain dehydrogenase family, thus the gene was subsequently named Sch1. Sch1 also possesses signature short-chain dehydrogenase motifs with inferred function in coenzyme binding (T-G-V-S-G-G-I-G [residues 44 to 51]) and structural stabilization sequences (N-N-A-G [residues 125 to 128]) (41). BlastP (1) analysis of Sch1 revealed significant matches to hypothetical fungal short-chain dehydrogenases (40% to 50% amino acid identities).
Sch1 is highly expressed in pycnidia.
Examination of gene expression by quantitative PCR showed that Sch1 transcript abundance was maximal during the latter stages of infection, implying a role for Sch1 in asexual sporulation. To gain a more detailed understanding of expression during asexual development, a transcriptional fusion consisting of the Sch1 5′ putative promoter region fused to the eGFP gene was constructed and transformed into SN15. Subsequent transformants were screened with those demonstrating phenotype and pathogenicity comparable to those of the S. nodorum wild type, chosen for further analysis (data not shown). eGFP expression was examined in vitro by excising hyphae and pycnidia from the transformed strain growing on complex CzV8CS agar (Fig. 3). Images collected by DIC microscopy showed asexual sporulation occurring at various stages of development on the agar. Examination of these samples for eGFP expression highlighted that fluorescence was localized strictly to within mature pycnidia or differentiating asexual structures, known as mycelial knots. Fluorescence was not observed in vegetative mycelia. Higher-magnification data revealed that eGFP expression was observed in the pycnidial cavity that consisted of the subparietal tissue layer and asexual pycnidiospores but not the melanized pycnidial wall. These results confirm the strong expression of Sch1 during asexual development and demonstrate the specificity of the expression in the sporulation structures.
FIG. 3.

Expression of the Sch1 promoter-eGFP fusion construct in SN15. Longitudinal section images taken with DIC microscopy showing hyphae and mature and immature pycnidia (mycelial knots). Panels A, B, and C represent increasing magnifications. C, conidiogenous cell; Cv, pycnidial cavity; H, hyphae; MK, mycelial knot; P, pycnidium; S, spore; SL, subparietal layer; W, pycnidial wall.
Targeted gene deletion of Sch1.
The eGFP expression analysis highlighted a potential role for Sch1 in asexual development. Mutants of S. nodorum lacking Sch1 were created by homologous recombination with an Sch1 gene deletion construct conferring phleomycin resistance (Fig. 4A). Initial PCR screening enabled the recovery of two independently derived gene deletion mutants designated as S. nodorum sch1-11 and sch1-42 mutants and an ectopic strain designated as the Sch1-30 mutant. Southern analysis confirmed the presence of Sch1 in the Sch1-30 mutant and successful gene deletion in the sch1-11 and sch1-42 mutants (Fig. 4B). 2D-PAGE of the transformants confirmed that the protein spot corresponding to Sch1 was present in the SN15 and Sch1-30 strains but not in the sch1 mutants (Fig. 4C). This indicates a correct protein-to-gene assignment via MS identification and unequivocal evidence of gene deletion.
FIG. 4.

Construction of the sch1 mutants. (A) (i) The Sch1 knockout vector was constructed by ligating PCR-amplified 5′ and 3′ UTRs of Sch1 to the XhoI/HindIII and PstI/NotI restriction sites of pBSK-phleo, respectively. (ii) The knockout vector was PCR amplified and transformed into SN15 to facilitate homologous gene replacement, as shown in panel iii. Restriction sites are as follows: X, XhoI; H, HindIII; P, PstI; and N, NotI. Primers are as follows: 1, 5′FwdXhoI-R567; 2, 5′RevHindIII-R567; 3, 3′FwdPstI-R567; 4, 3′RevNotI-R567; 5, R567FwdKO; and 6, R567RevKO. Primer sequences are listed in Table S2 of the supplemental material. The probe used for Southern analysis is indicated. (B) Southern analysis of the S. nodorum SN15 (i), Sch1-30 (ii), sch1-11 (iii), and sch1-42 (iv) strains. Bands corresponding to 4.2 and 5.5 kb were predicted for strains carrying an intact or deleted gene, respectively. Genomic DNA was digested with XhoI prior to blotting. (C) Detection of Sch1 (arrows) via 2D-PAGE.
Sch1 deletion affects vegetative growth.
Vegetative growth of the sch1 strains was compared with those of the SN15 and Sch1-30 strains on solid agar media. All strains examined demonstrated a similar radial growth rate on complex CzV8CS agar as that of the sch1 mutants, producing a green pigment in older mycelia (Fig. 5A). When grown on defined MM agar, the sch1 mutants showed a significant reduction in radial growth compared to both the SN15 and Sch1-30 strains. The inclusion of components from the complex media in the MM agar failed to complement the growth defect, implying that the phenotype is more than a simple auxotrophic response. The vegetative phenotype of the sch1 mutants was also investigated when grown as submerged cultures in shaking flasks consisting of MM broth. At 24 h postinoculation, the mycelia of both SN15 and the ectopic mutant were dispersed throughout the media as is typically observed. The mycelia of the sch1 strains were not dispersed but appeared to aggregate into a single mass (data not shown).
FIG. 5.

Vegetative morphology of the sch1 mutants. (A) Colony morphology after 2 weeks of growth on CzV8CS and MM agars. (B) Light microscope images of pycnidiospores (arrows) harvested from the S. nodorum SN15, Sch1-30, sch1-11, and sch1-42 strains. Notice the mycelial debris associated with the spores of the sch1 mutants. (C) Spores per plate from strains grown on CzV8CS agar for 2 weeks. Mean values were calculated from three spore counts of biological pooled plate replicates of the SN15 (n = 3), Sch1-30 (n = 3), sch1-11 (n = 11), and sch1-42 (n = 12) strains. (D) In planta sporulation assay results. Mean values were calculated from three spore counts of pooled spores derived from biological infected replicates of the SN15 (n = 10), Sch1-30 (n = 10), sch1-11 (n = 5), and sch1-42 (n = 5) strains. (E) A comparison of the average spore length of the SN15, Sch1-30, and sch1-42 strains (n = 34). Note that asterisks denote a significant difference to SN15 (P < 0.05).
Based on the phenotypic variation apparent from these simple in vitro growth assays, we attempted to complement the mutation by reintroducing the Sch1 gene into the sch1 strain background. Attempts to generate the required number of sch1 protoplasts proved difficult, most likely due to the clumping phenotype observed in the shaking flasks. Assays in multiple flasks were attempted to generate sufficient protoplasts, but this, too, was unsuccessful. Consequently, genetic complementation of the sch1 strains was not possible.
Sch1 is dispensable for proliferation on wheat.
The sch1 mutants were examined for their ability to cause lesions on wheat. A detached-leaf assay was used to measure the progress of lesion development from a single point inoculation over a 14-day period. Lesion sizes caused by all fungal strains on detached wheat leaves were not significantly differently (data not shown). A whole plant spray assay was also used to simulate a field infection by spraying spore suspensions onto 2-week-old wheat plants. The disease scores for all strains were comparable indicating that Sch1 is dispensable for lesion development on wheat (data not shown).
Sch1 deletion affects asexual sporulation in vitro and in planta.
The eGFP-fusion experiments revealed the localized nature of Sch1 expression during asexual development. Also apparent from the subculturing and harvesting of the sch1 strains was the very low numbers of spores recovered. To analyze the sporulation phenotype further, pycnidiospores of all strains were harvested and compared via light microscopy analysis (Fig. 5B). Spore suspensions derived from SN15 and the Sch1-30 strain were predominantly composed of pycnidiospores. The spore suspensions harvested from the sch1 strains contained far fewer spores and much of what was assumed to be mycelial debris. Quantitative analysis of the spores harvested showed an approximately 50-fold decrease in the number produced by the sch1 strains (Fig. 6C). Significantly fewer pycnidiospores were also produced by the sch1 strains in planta, implying that the phenotype is not restricted to a specific growth environment (Fig. 6D). The sch1 deletion also resulted in reduced average spore length (Fig. 6E), although the germination rate of the mutants was unaffected (data not shown).
FIG. 6.

Sch1 deletion affects pycnidial function and size. Digital images of pycnidia produced on CzV8CS agar (A) and wheat leaves (B). Pycnidia of the sch1 mutants rarely exude spores. Ch, cirrhus; Py, pycnidium. The average diameter of pycnidia derived from growth on CzV8CS agar (the SN15 [n = 191], Sch1-30 [n = 146], sch1-11 [n = 144], and sch1-42 [n = 286] strains) (C) and wheat leaves (the SN15 [n = 69], Sch1-30 [n = 69], sch1-11 [n = 151], and sch1-42 [n = 184] strains) (D). Note that asterisks denote a significant difference to SN15 (P < 0.05).
Sch1 is required for pycnidial development in vitro and in planta.
Abnormalities in asexual sporulation of the sch1 mutants prompted further studies of the mutant pycnidia. The pycnidia of SN15 and the Sch1-30 strain exuded a pink cirrhi when grown on CzV8CS agar, while the cirrhi secreted by the sch1 pycnidia appeared much paler, almost white, and less abundant (Fig. 6A). On wheat leaves, the mutant phenotype was further exaggerated with the sch1 strains not exuding visible cirrhi from the pycnidia (Fig. 6B). The diameter of sch1 pycnidia was also significantly smaller than those of the wild-type or ectopic strains both in vitro and in planta, suggesting a structural role for Sch1 (Fig. 6C and D).
The ontogeny of SN15 and sch1-42 pycnidia in vitro was compared via tissue longitudinal sectioning and visualization with DIC, bright field, and TEM (Fig. 7A). Immediately apparent was the smaller size of the sch1 pycnidium, confirming the measurements reported above. Within the pycnidial cavity, far fewer pycnidiospores were present for the mutant, which is consistent with the much lower density of spores demonstrated in the exuding cirrhus. The cell walls of the two strains were also structurally different, with the cells within the SN15 wall appearing to be more uniform than the corresponding cells in the sch1-42 strain.
FIG. 7.

Analysis of SN15 and sch1-42 pycnidia via longitudinal sectioning. (A) The morphology SN15 and sch1-42 melanized pycnidial wall (panels i and iii) and cirrhi (panels ii and iv) are demonstrated via paraffin embedding and sectioning. Magnified images of the unstained pycnidial wall cellular arrangements (panels v and vii) and cirrhi (panels vi and viii) are shown. (B) Spurr's resin embedding sectioning of SN15 (panels i, ii, and iii) and sch1-42 (panels iv, v, and vi) pycnidia showing greater details of cells of the pycnidial wall and the subparietal layer. Panels i and iv show pycnidia of the SN15 and sch1-42 strains. Panels ii and v are images taken from increased magnifications of the pycnidial wall and cavity interface of SN15 and sch1-42 pycnidia. Cells of the pycnidial wall were examined via a TEM (panels iii and vi). C, conidiogenous cell; Ch, cirrhus; Cp, cytoplasm; Cv, pycnidial cavity; N, nucleus; PC, plant cell; OC, ostiolar cone; S, spore; SL, subparietal layer; Vc, vacuole; W, pycnidial wall.
The pycnidia of the sch1-42 strain showed similar developmental defects during growth on wheat leaves (Fig. 7B). The contents of the pycnidial cavity again significantly differed with that of the cavity of the wild type, comprising of tightly packed uniform spores. Surrounding the cavity is the subparietal layer that lines the inner wall of the pycnidium. The subparietal layer was evident in SN15 as a dense ring enveloping the cavity but was poorly defined for the sch1 strain. It was further observed that the conidiogenous cells in the sch1-42 strain were unable to differentiate into distinct pycnidiospores. As witnessed for the in vitro samples, the pycnidial wall cells of SN15 and the sch1-42 strain were morphologically different, as indicated by the staining pattern.
TEM analysis was used to interpret the structural alteration of sch1 pycnidia in greater detail (Fig. 7B, panels iii and vi). It was observed that a substantial portion of most SN15 pycnidial wall cells was occupied by a vacuole. Electron-dense materials, presumed to be cytoplasmic constituents, were often located adjacent to the intracellular side of the cell wall. In contrast, corresponding cells in the sch1-42 strain contained multiple small vacuoles and a high proportion of cytoplasmic constituents.
It was observed that the pycnidia of the sch1-42 strain resembled previously described immature pycnidia of S. nodorum (10). Hence, it was possible that Sch1 may be involved in the differentiation of the pycnidial primordium to maturity. To test this hypothesis, SN15 (mature and developing) and sch1-42 pycnidia were examined for nuclei distribution using DAPI staining (Fig. 8). The mature SN15 subparietal layer was distinguishable from the cell wall, as the latter tissue revealed comparatively less nuclei. Nuclei were also observed in spores located in the pycnidial cavity amid the background fluorescence. The pycnidial cell wall and subparietal layer of the sch1-42 strain were indistinguishable, as the DAPI staining indicated that most cells surrounding the pycnidial cavity were nucleated. DAPI staining of an immature pycnidium of SN15 showed a similar nuclei distribution pattern as that of the sch1-42 strain (Fig. 8). Collectively, these data suggest that the pycnidial wall of the sch1-42 strain may be attenuated in pycnidial maturation.
FIG. 8.

The nuclear content of SN15 and sch1-42 pycnidia was examined from longitudinal tissue sections stained with DAPI. (A) A comparison of nuclei distribution in pycnidia of SN15 at different stages of development and in that of the sch1-42 strain. Boxes are expanded in panel B, showing a greater magnification of the DAPI-stained cell wall and subparietal-layer regions of SN15 and sch1-42 pycnidia. Cv, pycnidial cavity; N, nucleus; OC, ostiolar cone; SL, subparietal layer; Vc, vacuole; W, pycnidial wall; (D), developing; (M), mature.
Sch1 regulation is independent of Ca2+/calmodulin signaling.
Sch1 abundance was examined in previously characterized signaling mutant strains lacking the MAP kinase Mak2 and the Ca2+/calmodulin protein kinase CpkA (54, 59). The level of Sch1 protein in the cpkA strain was not significantly different from that in SN15, suggesting that the regulation of Sch1 is independent of the Ca2+-/calmodulin-dependent signaling (Fig. 9). The amount of Sch1 protein was significantly less in the mak2 strain than in SN15 but was comparable to the level observed in the sch1-42 strain, suggesting that the Mak2 MAP kinase signaling pathway has a role in the regulation of Sch1.
FIG. 9.
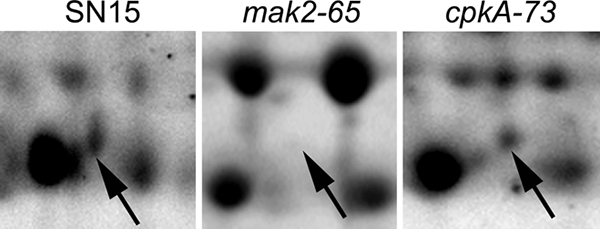
Representative regions of 2D gels from the S. nodorum SN15, mak2-65, and cpkA-73 strains. The arrows indicate the presence/absence of Sch1.
DISCUSSION
We have previously shown that inactivation of Gna1 has resulted in extensive changes in the phenotype and pathogenicity S. nodorum. Hence, the aim of this study was to identify and functionally characterize proteins in the pathogen S. nodorum that are regulated by signaling events associated with the Gαi subunit Gna1.
2D-PAGE was used to directly compare the intracellular proteomes of the gna1 and S. nodorum wild-type strains. The analysis of the 2D-PAGE data set led to the identification of seven intracellular proteins that were regulated at a significant level by Gna1 in biological independent samples analyzed in triplicate. The subsequent data were subjected to rigorous statistical analysis with only proteins with significant differences reported. A less stringent approach would have resulted in the identification of many more “regulated” proteins, but their biological significance would have been questionable.
The seven genes identified encode putative proteins of diverse function. SNOG_11081 encodes a putative concanamycin-induced protein C. CipC was first identified as an accumulated protein in Aspergillus nidulans exposed to the antibiotic concanamycin A (36). Orthologues of CipC were also identified in other fungi; however, their function is unknown (2, 29, 37, 43, 64). The gene expression profile of CipC in planta showed maximal transcript abundance 1 day postinfection, which suggests that this gene may play a role during early infection. Gene disruption of SNOG_11081 had no effect on the pathogenicity or phenotype of S. nodorum (data not shown). SNOG_07694 and SNOG_13042 encode a putative glutathione S-transferase and a short-chain dehydrogenase, respectively. These, too, were subsequently characterized by gene disruptions. The resulting mutants appeared to be identical to the wild-type strain, implying that these genes, while regulated by Gna1, did not significantly contribute to the phenotype of the gna1 strains (data not shown).
The disruption of a fourth gene, SNOG_10217, generated strains of S. nodorum unable to differentiate mature pycnidia. Sequence analysis of SNOG_10217 identified it as also belonging to the family of short-chain dehydrogenase, and the gene was subsequently named Sch1. The pycnidia developed by sch1 strains were smaller and contained a significantly lower number of pycnidiospores which appeared abnormal in shape. Histological analysis of these mutant pycnidia highlighted significant structural differences compared to the wild type, including the spore density and the shape within the pycnidial cavity and also structural deformity of the subparietal layer and pycnidial wall.
It was observed that the protein sequences of Sch1 and SNOG_13042 shared approximately 30% similarity. On this basis, we investigated whether SNOG_13042 was partially compensating for the loss of Sch1 in the sch1 strains via the creation of a double mutant lacking both Sch1 and Sch2. The resulting mutants were identical to the sch1 strains, strongly suggesting that Sch2 is not compensating for the loss of Sch1 (see Fig. S3 in the supplemental material).
There have been several recent reports examining the molecular and biochemical requirements of asexual sporulation in S. nodorum. The cAMP-dependent (Gna1), MAP kinase (Mak2), and calcium (CpkA) signaling pathways all have a demonstrated role in sporulation (54, 56, 59). Analyses in this study have shown that Sch1 is regulated by Gna1 and Mak2 but not CpkA. Shared regulation by the cAMP-dependent and MAP kinase signaling pathways was not unexpected, as cross talk between these pathways has been well documented (23, 40).
The presence of the sugar alcohol mannitol has also been identified as a requirement for S. nodorum to undergo asexual sporulation (55, 58, 60). The levels of mannitol appear unchanged when comparing the sch1 strains with SN15, excluding it as having a role in the sch1 defect (data not shown). Hence, Sch1 appears to be a novel factor in S. nodorum that is required for appropriate sporulation.
Douaiher et al. have previously reported the ontogeny of S. nodorum pycnidia in vitro (10). This detailed examination elegantly described the differentiation of a pycnidium from the initial formation of the mycelial knot through to a fully mature structure. A comparative analysis of these structures described by Douaiher et al. with those produced by the sch1 strains indicates that differentiation of the sch1 pycnidia is interrupted through the development of the pycnidial primordium. This stage has been defined as the formation and the extension of the pycnidial cavity and conidiogenesis. A pycnidial cavity has clearly formed for the sch1 structures, but the conidiogenesis cells are difficult to distinguish. Furthermore, using DAPI staining, we have shown that the walls of sch1-42 pycnidia contain a similar nuclei distribution to that of an immature pycnidium of SN15. Hence, the evidence reported here indicates that the Sch1 gene/product has a discrete role in this stage of pycnidial development.
Many important phytopathogenic fungi, such as C. parasitica, Cochliobolus heterostrophus, and Mycosphaerella graminicola, are capable of asexual sporulation through pycnidia. Recent studies have identified various signaling pathways as having a role in pycnidial development in these fungi (6, 35). Similar studies in S. nodorum also identified that the calcium-/calmodulin-dependent protein kinase CpkA was required for proper pycnidial differentiation (54). However, the genes and proteins regulated by these signaling pathways that are required for the development of wild-type pycnidia are yet to be identified. To our knowledge, Sch1 is the first signal transduction target identified to play a required role in the development of pycnidia.
Three additional genes were identified during the course of this study, as regulated by G protein signaling, but have yet to be functionally characterized. SNOG_07541 encodes an alpha type 2 proteasome subunit which comprises part of the 20S proteasome, the central enzyme of nonlysosomal protein degradation in both the cytosol and nucleus (34). SNOG_08275 encodes a protein of unknown function that is not expressed during infection, while SNOG_11441 encodes a putative dehydroquinate dehydratase. The 3-dehydroquinate dehydratase protein is associated with quinate metabolism (15). In Neurospora crassa, Qa-2p is required for the conversion of 3-dehydroquinate to 3-dehydroshikimate. Both compounds are intermediates of aromatic amino acid biosynthesis and quinate catabolism pathways (15, 20). It is possible that the increased abundance of the Qa-2p orthologue in S. nodorum may have led to a perturbation of the aromatic amino acid pathway. This in turn may have affected dihydroxyphenylalanine melanin biosynthesis in the gna1 strains and resulted in the albino vegetative phenotype previously reported. However, this hypothesis requires further investigation.
A thorough gene expression analysis, both in vitro and in planta, was undertaken on the genes encoding the seven proteins. Quantitative transcript measurements revealed a correlation between protein and transcript abundances in four of the seven genes. Three of the genes were downregulated in the gna1 background, while one was upregulated. The protein and transcript abundances in the three remaining genes did not correlate in vitro. Similar observations were previously made in studies of other biological systems using both proteomics and transcriptomics to analyze gene expression (13, 18). This may be attributed to posttranscriptional regulation or differing half-lives of transcripts and proteins (26, 33). Nevertheless, some of these genes showed a differential expression pattern during infection, suggestive of transcriptional regulation by unknown factors.
This study has demonstrated that 2D-PAGE is an effective method for analyzing the proteomes for downstream targets of signaling pathways that are differentially accumulated between S. nodorum SN15 and gna1 strains. The genes encoding several of these proteins were functionally characterized by gene disruption. Through this approach, the short-chain dehydrogenase Sch1, which is subjected to positive regulation by Gna1, was found to be required for the differentiation of pycnidia. S. nodorum is a polycyclic pathogen, and, as such, asexual sporulation is an attractive target for investigating mechanisms of disease control. It is relevant to note that, although deformed, the sch1 strains were able to form pycnidia. In contrast, the Gna1 mutants were unable to differentiate pycnidia, suggesting that additional unidentified signaling targets are required to initiate pycnidial formation from precursor hyphal cells. It should also be considered that proteome changes observed in this study may have been the result of perturbation in other parts of the heterotrimeric G protein pathway, rather than Gna1 alone. Therefore, the proteins identified could have been directly or indirectly regulated by Gna1.
We anticipate that this study will stimulate research to further understand the biology of pycnidial development in other fungal pathogens and its requirement for the establishment of diseases.
Supplementary Material
Acknowledgments
We thank Kasia Rybak and Eva Antoni for technical assistance and Barbara J. Howlett at The University of Melbourne for providing the pGPD-GFP construct. This research was supported by the Grains Research and Development Corporation.
K.-C.T. was supported by an Australian Postgraduate Award. J.L.H. and A.H.M. were supported by an ARC Australian Postdoctoral Fellowship and an ARC Australian Professorial Fellowship, respectively.
Footnotes
Published ahead of print on 5 September 2008.
Supplemental material for this article may be found at http://ec.asm.org/.
REFERENCES
- 1.Altschul, S. F., T. L. Madden, A. A. Schaffer, J. Zhang, Z. Zhang, W. Miller, and D. J. Lipman. 1997. Gapped BLAST and PSI-BLAST: a new generation of protein database search programs. Nucleic Acids Res. 253389-3402. [DOI] [PMC free article] [PubMed] [Google Scholar]
- 2.Bohmer, M., T. Colby, C. Bohmer, A. Brautigam, J. Schmidt, and M. Bolker. 2007. Proteomic analysis of dimorphic transition in the phytopathogenic fungus Ustilago maydis. Proteomics 7675-685. [DOI] [PubMed] [Google Scholar]
- 3.Bolker, M. 1998. Sex and crime: heterotrimeric G proteins in fungal mating and pathogenesis. Fungal Genet. Biol. 25143-156. [DOI] [PubMed] [Google Scholar]
- 4.Borkovich, K. A. 1996. Signal transduction pathways and heterotrimeric G proteins. In R. Brambl and G. A. Marzluf (ed.), The mycota. Springer-Verlag, Berlin, Germany.
- 5.Cooper, B., W. M. Garrett, and K. B. Campbell. 2006. Shotgun identification of proteins from uredospores of the bean rust Uromyces appendiculatus. Proteomics 62477-2484. [DOI] [PubMed] [Google Scholar]
- 6.Cousin, A., R. Mehrabi, M. Guilleroux, M. Dufresne, T. Van der Lee, C. Waalwijk, T. Langin, and G. H. J. Kema. 2006. The MAP kinase-encoding gene MgFus3 of the nonappressorium phytopathogen Mycosphaerella graminicola is required for penetration and in vitro pycnidia formation. Mol. Plant Pathol. 7269-278. [DOI] [PubMed] [Google Scholar]
- 7.Cuomo, C. A., U. Guldener, J. R. Xu, F. Trail, B. G. Turgeon, A. Di Pietro, J. D. Walton, L. J. Ma, S. E. Baker, M. Rep, G. Adam, J. Antoniw, T. Baldwin, S. Calvo, Y. L. Chang, D. Decaprio, L. R. Gale, S. Gnerre, R. S. Goswami, K. Hammond-Kosack, L. J. Harris, K. Hilburn, J. C. Kennell, S. Kroken, J. K. Magnuson, G. Mannhaupt, E. Mauceli, H. W. Mewes, R. Mitterbauer, G. Muehlbauer, M. Munsterkotter, D. Nelson, K. O'Donnell, T. Ouellet, W. Qi, H. Quesneville, M. I. Roncero, K. Y. Seong, I. V. Tetko, M. Urban, C. Waalwijk, T. J. Ward, J. Yao, B. W. Birren, and H. C. Kistler. 2007. The Fusarium graminearum genome reveals a link between localized polymorphism and pathogen specialization. Science 3171400-1402. [DOI] [PubMed] [Google Scholar]
- 8.Dawe, A. L., G. C. Segers, T. D. Allen, V. C. McMains, and D. L. Nuss. 2004. Microarray analysis of Cryphonectria parasitica Gα- and Gβγ-signalling pathways reveals extensive modulation by hypovirus infection. Microbiology 1504033-4043. [DOI] [PubMed] [Google Scholar]
- 9.Dean, R. A., N. J. Talbot, D. J. Ebbole, M. L. Farman, T. K. Mitchell, M. J. Orbach, M. Thon, R. Kulkarni, J. R. Xu, H. Pan, N. D. Read, Y. H. Lee, I. Carbone, D. Brown, Y. Y. Oh, N. Donofrio, J. S. Jeong, D. M. Soanes, S. Djonovic, E. Kolomiets, C. Rehmeyer, W. Li, M. Harding, S. Kim, M. H. Lebrun, H. Bohnert, S. Coughlan, J. Butler, S. Calvo, L. J. Ma, R. Nicol, S. Purcell, C. Nusbaum, J. E. Galagan, and B. W. Birren. 2005. The genome sequence of the rice blast fungus Magnaporthe grisea. Nature 434980-986. [DOI] [PubMed] [Google Scholar]
- 10.Douaiher, M. N., P. Halama, and M. C. Janex-Favre. 2004. The ontogeny of Stagonospora nodorum pycnidia in culture. Sydowia 5639-50. [Google Scholar]
- 11.Fang, E. G., and R. A. Dean. 2000. Site-directed mutagenesis of the magB gene affects growth and development in Magnaporthe grisea. Mol. Plant-Microbe Interact. 131214-1227. [DOI] [PubMed] [Google Scholar]
- 12.Fernandez-Acero, F. J., I. Jorge, E. Calvo, I. Vallejo, M. Carbu, E. Camafeita, J. A. Lopez, J. M. Cantoral, and J. Jorrin. 2006. Two-dimensional electrophoresis protein profile of the phytopathogenic fungus Botrytis cinerea. Proteomics 6S88-S96. [DOI] [PubMed] [Google Scholar]
- 13.Fessler, M. B., K. C. Malcolm, M. W. Duncan, and G. S. Worthen. 2002. A genomic and proteomic analysis of activation of the human neutrophil by lipopolysaccharide and its mediation by p38 mitogen-activated protein kinase. J. Biol. Chem. 27731291-31302. [DOI] [PubMed] [Google Scholar]
- 14.Gao, S., and D. L. Nuss. 1996. Distinct roles for two G protein α subunits in fungal virulence, morphology, and reproduction revealed by targeted gene disruption. Proc. Natl. Acad. Sci. USA 9314122-14127. [DOI] [PMC free article] [PubMed] [Google Scholar]
- 15.Giles, N. H., R. F. Geever, D. K. Asch, J. Avalos, and M. E. Case. 1991. The Wilhelmine E. Key 1989 invitational lecture. Organization and regulation of the qa (quinic acid) genes in Neurospora crassa and other fungi. J. Hered. 821-7. [DOI] [PubMed] [Google Scholar]
- 16.Gronover, C. S., D. Kasulke, P. Tudzynski, and B. Tudzynski. 2001. The role of G protein α subunits in the infection process of the gray mold fungus Botrytis cinerea. Mol. Plant-Microbe Interact. 141293-1302. [DOI] [PubMed] [Google Scholar]
- 17.Gronover, C. S., C. Schorn, and B. Tudzynski. 2004. Identification of Botrytis cinerea genes up-regulated during infection and controlled by the Gα subunit BCG1 using suppression subtractive hybridization (SSH). Mol. Plant-Microbe Interact. 17537-546. [DOI] [PubMed] [Google Scholar]
- 18.Gygi, S. P., Y. Rochon, B. R. Franza, and R. Aebersold. 1999. Correlation between protein and mRNA abundance in yeast. Mol. Cell. Biol. 191720-1730. [DOI] [PMC free article] [PubMed] [Google Scholar]
- 19.Hane, J. K., R. G. Lowe, P. S. Solomon, K. C. Tan, C. L. Schoch, J. W. Spatafora, P. W. Crous, C. Kodira, B. W. Birren, J. E. Galagan, S. F. Torriani, B. A. McDonald, and R. P. Oliver. 2007. Dothideomycete plant interactions illuminated by genome sequencing and EST analysis of the wheat pathogen Stagonospora nodorum. Plant Cell 193347-3368. [DOI] [PMC free article] [PubMed] [Google Scholar]
- 20.Harwood, C. S., and R. E. Parales. 1996. The β-ketoadipate pathway and the biology of self-identity. Annu. Rev. Microbiol. 50553-590. [DOI] [PubMed] [Google Scholar]
- 21.Horwitz, B. A., A. Sharon, S. W. Lu, V. Ritter, T. M. Sandrock, O. C. Yoder, and B. G. Turgeon. 1999. A G protein α subunit from Cochliobolus heterostrophus involved in mating and appressorium formation. Fungal Genet. Biol. 2619-32. [DOI] [PubMed] [Google Scholar]
- 22.Jain, S., K. Akiyama, K. Mae, T. Ohguchi, and R. Takata. 2002. Targeted disruption of a G protein α subunit gene results in reduced pathogenicity in Fusarium oxysporum. Curr. Genet. 41407-413. [DOI] [PubMed] [Google Scholar]
- 23.Kaffarnik, F., P. Muller, M. Leibundgut, R. Kahmann, and M. Feldbrugge. 2003. PKA and MAPK phosphorylation of Prf1 allows promoter discrimination in Ustilago maydis. EMBO J. 225817-5826. [DOI] [PMC free article] [PubMed] [Google Scholar]
- 24.Kamper, J., R. Kahmann, M. Bolker, L. J. Ma, T. Brefort, B. J. Saville, F. Banuett, J. W. Kronstad, S. E. Gold, O. Muller, M. H. Perlin, H. A. Wosten, R. de Vries, J. Ruiz-Herrera, C. G. Reynaga-Pena, K. Snetselaar, M. McCann, J. Perez-Martin, M. Feldbrugge, C. W. Basse, G. Steinberg, J. I. Ibeas, W. Holloman, P. Guzman, M. Farman, J. E. Stajich, R. Sentandreu, J. M. Gonzalez-Prieto, J. C. Kennell, L. Molina, J. Schirawski, A. Mendoza-Mendoza, D. Greilinger, K. Munch, N. Rossel, M. Scherer, M. Vranes, O. Ladendorf, V. Vincon, U. Fuchs, B. Sandrock, S. Meng, E. C. Ho, M. J. Cahill, K. J. Boyce, J. Klose, S. J. Klosterman, H. J. Deelstra, L. Ortiz-Castellanos, W. Li, P. Sanchez-Alonso, P. H. Schreier, I. Hauser-Hahn, M. Vaupel, E. Koopmann, G. Friedrich, H. Voss, T. Schluter, J. Margolis, D. Platt, C. Swimmer, A. Gnirke, F. Chen, V. Vysotskaia, G. Mannhaupt, U. Guldener, M. Munsterkotter, D. Haase, M. Oesterheld, H. W. Mewes, E. W. Mauceli, D. DeCaprio, C. M. Wade, J. Butler, S. Young, D. B. Jaffe, S. Calvo, C. Nusbaum, J. Galagan, and B. W. Birren. 2006. Insights from the genome of the biotrophic fungal plant pathogen Ustilago maydis. Nature 44497-101. [DOI] [PubMed] [Google Scholar]
- 25.Kim, S. T., S. Yu, S. G. Kim, H. J. Kim, S. Y. Kang, D. H. Hwang, Y. S. Jang, and K. Y. Kang. 2004. Proteome analysis of rice blast fungus (Magnaporthe grisea) proteome during appressorium formation. Proteomics 43579-3587. [DOI] [PubMed] [Google Scholar]
- 26.Kozak, M. 2005. Regulation of translation via mRNA structure in prokaryotes and eukaryotes. Gene 36113-37. [DOI] [PubMed] [Google Scholar]
- 27.Kurose, H. 2003. Gα12 and Gα13 as key regulatory mediator in signal transduction. Life Sci. 74155-161. [DOI] [PubMed] [Google Scholar]
- 28.Lee, N., C. A. D'Souza, and J. W. Kronstad. 2003. Of smuts, blasts, mildews, and blights: cAMP signaling in phytopathogenic fungi. Annu. Rev. Phytopathol. 41399-427. [DOI] [PubMed] [Google Scholar]
- 29.Le Quere, A., A. Schutzendubel, B. Rajashekar, B. Canback, J. Hedh, S. Erland, T. Johansson, and A. Tunlid. 2004. Divergence in gene expression related to variation in host specificity of an ectomycorrhizal fungus. Mol. Ecol. 133809-3819. [DOI] [PubMed] [Google Scholar]
- 30.Lifton, R. P., M. L. Goldberg, R. W. Karp, and D. S. Hogness. 1978. The organization of the histone genes in Drosophila melanogaster: functional and evolutionary implications. Cold Spring Harb. Symp. Quant. Biol. 421047-1051. [DOI] [PubMed] [Google Scholar]
- 31.Liu, H., A. Suresh, F. S. Willard, D. P. Siderovski, L. Shen, and N. I. Naqvi. 2007. Rgs1 regulates multiple Gα subunits in Magnaporthe pathogenesis, asexual growth and thigmotropism. EMBO J. 26690-700. [DOI] [PMC free article] [PubMed] [Google Scholar]
- 32.Liu, S., and R. A. Dean. 1997. G protein α subunit genes control growth, development, and pathogenicity of Magnaporthe grisea. Mol. Plant-Microbe Interact. 101075-1086. [DOI] [PubMed] [Google Scholar]
- 33.Mann, M., and O. N. Jensen. 2003. Proteomic analysis of post-translational modifications. Nat. Biotechnol. 21255-261. [DOI] [PubMed] [Google Scholar]
- 34.Marchler-Bauer, A., J. B. Anderson, C. DeWeese-Scott, N. D. Fedorova, L. Y. Geer, S. He, D. I. Hurwitz, J. D. Jackson, A. R. Jacobs, C. J. Lanczycki, C. A. Liebert, C. Liu, T. Madej, G. H. Marchler, R. Mazumder, A. N. Nikolskaya, A. R. Panchenko, B. S. Rao, B. A. Shoemaker, V. Simonyan, J. S. Song, P. A. Thiessen, S. Vasudevan, Y. Wang, R. A. Yamashita, J. J. Yin, and S. H. Bryant. 2003. CDD: a curated Entrez database of conserved domain alignments. Nucleic Acids Res. 31383-387. [DOI] [PMC free article] [PubMed] [Google Scholar]
- 35.Mehrabi, R., and G. H. J. Kema. 2006. Protein kinase a subunits of the ascomycete pathogen Mycosphaerella graminicola regulate asexual fructification, filamentation, melanization and osmosensing. Mol. Plant Pathol. 7565-577. [DOI] [PubMed] [Google Scholar]
- 36.Melin, P., J. Schnurer, and E. G. Wagner. 2002. Proteome analysis of Aspergillus nidulans reveals proteins associated with the response to the antibiotic concanamycin A, produced by Streptomyces species. Mol. Genet. Genomics 267695-702. [DOI] [PubMed] [Google Scholar]
- 37.Morel, M., C. Jacob, A. Kohler, T. Johansson, F. Martin, M. Chalot, and A. Brun. 2005. Identification of genes differentially expressed in extradical mycelium and ectomycorrhizal roots during Paxillus involutus-Betula pendula ectomycorrhizal symbiosis. Appl. Environ. Microbiol. 71383-391. [DOI] [PMC free article] [PubMed] [Google Scholar]
- 38.Neuhoff, V., N. Arold, D. Taube, and W. Ehrhardt. 1988. Improved staining of proteins in polyacrylamide gels including isoelectric focusing gels with clear background at nanogram sensitivity using Coomassie brilliant blue G-250 and R-250. Electrophoresis 9255-262. [DOI] [PubMed] [Google Scholar]
- 39.Neves, S. R., P. T. Ram, and R. Iyengar. 2002. G protein pathways. Science 2961636-1639. [DOI] [PubMed] [Google Scholar]
- 40.Nishimura, M., G. Park, and J. R. Xu. 2003. The G-beta subunit MGB1 is involved in regulating multiple steps of infection-related morphogenesis in Magnaporthe grisea. Mol. Microbiol. 50231-243. [DOI] [PubMed] [Google Scholar]
- 41.Oppermann, U., C. Filling, M. Hult, N. Shafqat, X. Wu, M. Lindh, J. Shafqat, E. Nordling, Y. Kallberg, B. Persson, and H. Jornvall. 2003. Short-chain dehydrogenases/reductases (SDR): the 2002 update. Chem. Biol. Interact. 143-144247-253. [DOI] [PubMed] [Google Scholar]
- 42.Paper, J. M., J. S. Scott-Craig, N. D. Adhikari, C. A. Cuomo, and J. D. Walton. 2007. Comparative proteomics of extracellular proteins in vitro and in planta from the pathogenic fungus Fusarium graminearum. Proteomics 73171-3183. [DOI] [PubMed] [Google Scholar]
- 43.Peter, M., P.-E. Courty, A. Kohler, C. Delaruelle, D. Martin, D. Tagu, P. Frey-Klett, M. Dupleissis, G. Podila, and F. Martin. 2003. Analysis of expressed sequence tags from the ectomycorhizal basidiomycetes Lacarria bicolor and Pisolithus microcarpus. New Phytol. 159117-129. [DOI] [PubMed] [Google Scholar]
- 44.Phalip, V., F. Delalande, C. Carapito, F. Goubet, D. Hatsch, E. Leize-Wagner, P. Dupree, A. V. Dorsselaer, and J. M. Jeltsch. 2005. Diversity of the exoproteome of Fusarium graminearum grown on plant cell wall. Curr. Genet. 48366-379. [DOI] [PubMed] [Google Scholar]
- 45.Rampitsch, C., N. V. Bykova, B. McCallum, E. Beimcik, and W. Ens. 2006. Analysis of the wheat and Puccinia triticina (leaf rust) proteomes during a susceptible host-pathogen interaction. Proteomics 61897-1907. [DOI] [PubMed] [Google Scholar]
- 46.Regenfelder, E., T. Spellig, A. Hartmann, S. Lauenstein, M. Bolker, and R. Kahmann. 1997. G proteins in Ustilago maydis: transmission of multiple signals? EMBO J. 161934-1942. [DOI] [PMC free article] [PubMed] [Google Scholar]
- 47.Richardson, K. C., L. Jarret, and E. H. Finke. 1960. Embedding in epoxy resins for ultrathin sectioning in electron microscopy. Stain Technol. 35313-323. [DOI] [PubMed] [Google Scholar]
- 48.Sass, J. E. 1958. Botanical microtechnique. Iowa State University Press, Ames, IA.
- 49.Sexton, A. C., and B. J. Howlett. 2001. Green fluorescent protein as a reporter in the Brassica-Leptosphaeria maculans interaction. Physiol. Mol. Plant Pathol. 5813-21. [Google Scholar]
- 50.Siewers, V., M. Viaud, D. Jimenez-Teja, I. G. Collado, C. S. Gronover, J. M. Pradier, B. Tudzynski, and P. Tudzynski. 2005. Functional analysis of the cytochrome P450 monooxygenase gene bcbot1 of Botrytis cinerea indicates that botrydial is a strain-specific virulence factor. Mol. Plant-Microbe Interact. 18602-612. [DOI] [PubMed] [Google Scholar]
- 51.Simon, M. I., M. P. Strathmann, and N. Gautam. 1991. Diversity of G proteins in signal transduction. Science 252802-808. [DOI] [PubMed] [Google Scholar]
- 52.Smale, S. T., and J. T. Kadonaga. 2003. The RNA polymerase II core promoter. Annu. Rev. Biochem. 72449-479. [DOI] [PubMed] [Google Scholar]
- 53.Solomon, P. S., R. G. T. Lowe, K.-C. Tan, O. D. C. Waters, and R. P. Oliver. 2006. Stagonospora nodorum: cause of stagonospora nodorum blotch of wheat. Mol. Plant Pathol. 7147-156. [DOI] [PubMed] [Google Scholar]
- 54.Solomon, P. S., K. Rybak, R. D. Trengove, and R. P. Oliver. 2006. Investigating the role of calcium/calmodulin-dependent protein signalling in Stagonospora nodorum. Mol. Microbiol. 62367-381. [DOI] [PubMed] [Google Scholar]
- 55.Solomon, P. S., K.-C. Tan, and R. P. Oliver. 2005. Mannitol 1-phosphate metabolism is required for sporulation in planta of the wheat pathogen Stagonospora nodorum. Mol. Plant-Microbe Interact. 18110-115. [DOI] [PubMed] [Google Scholar]
- 56.Solomon, P. S., K.-C. Tan, P. Sanchez, R. M. Cooper, and R. P. Oliver. 2004. The disruption of a Gα subunit sheds new light on the pathogenicity of Stagonospora nodorum on wheat. Mol. Plant-Microbe Interact. 17456-466. [DOI] [PubMed] [Google Scholar]
- 57.Solomon, P. S., S. W. Thomas, P. Spanu, and R. P. Oliver. 2003. The utilisation of di/tripeptides by Stagonospora nodorum is dispensable for wheat infection. Physiol. Mol. Plant Pathol. 63191-199. [Google Scholar]
- 58.Solomon, P. S., O. D. Waters, C. I. Jorgens, R. G. Lowe, J. Rechberger, R. D. Trengove, and R. P. Oliver. 2006. Mannitol is required for asexual sporulation in the wheat pathogen Stagonospora nodorum (glume blotch). Biochem. J. 399231-239. [DOI] [PMC free article] [PubMed] [Google Scholar]
- 59.Solomon, P. S., O. D. Waters, J. Simmonds, R. M. Cooper, and R. P. Oliver. 2005. The Mak2 MAP kinase signal transduction pathway is required for pathogenicity in Stagonospora nodorum. Curr. Genet. 4860-68. [DOI] [PubMed] [Google Scholar]
- 60.Solomon, P. S., O. D. C. Waters, and R. P. Oliver. 2007. Decoding the enigmatic mannitol in filamentous fungi. Trends Microbiol. 15257-262. [DOI] [PubMed] [Google Scholar]
- 61.Solomon, P. S., T. J. G. Wilson, K. Rybak, K. Parker, R. G. T. Lowe, and R. P. Oliver. 2006. Structural characterisation of the interaction between Triticum aestivum and the dothideomycete pathogen Stagonospora nodorum. Eur. J. Plant Pathol. 114275-282. [Google Scholar]
- 62.Spurr, A. R. 1969. A low-viscosity epoxy resin embedding medium for electron microscopy. J. Ultrastruct. Res. 2631-43. [DOI] [PubMed] [Google Scholar]
- 63.Taylor, N. L., J. L. Heazlewood, D. A. Day, and A. H. Millar. 2005. Differential impact of environmental stresses on the pea mitochondrial proteome. Mol. Cell. Proteomics 41122-1133. [DOI] [PubMed] [Google Scholar]
- 64.Teichert, S., B. Schonig, S. Richter, and B. Tudzynski. 2004. Deletion of the Gibberella fujikuroi glutamine synthetase gene has significant impact on transcriptional control of primary and secondary metabolism. Mol. Microbiol. 531661-1675. [DOI] [PubMed] [Google Scholar]
- 65.Venable, J. H., and R. Coggshall. 1965. A simplified lead citrate stain for electron microscopy. J. Cell Biol. 25407-408. [DOI] [PMC free article] [PubMed] [Google Scholar]
- 66.Yamagishi, D., H. Otani, and M. Kodama. 2006. G protein signaling mediates developmental processes and pathogenesis of Alternaria alternata. Mol. Plant-Microbe Interact. 191280-1288. [DOI] [PubMed] [Google Scholar]
Associated Data
This section collects any data citations, data availability statements, or supplementary materials included in this article.