

Abstract
Despite recent advances in immunology, several key parameters determining virus dynamics in infected hosts remain largely unknown. For example, the rate at which specific effector and memory CD8 T cells clear virus-infected cells in vivo is hardly known for any viral infection. We propose a framework to quantify T-cell-mediated killing of infected or peptide-pulsed target cells using the widely used in vivo cytotoxicity assay. We have reanalyzed recently published data on killing of peptide-pulsed splenocytes by cytotoxic T lymphocytes and memory CD8 T cells specific to NP396 and GP276 epitopes of lymphocytic choriomeningitis virus (LCMV) in the mouse spleen. Because there are so many effector CD8 T cells in spleens of mice at the peak of the immune response, NP396- and GP276-pulsed targets are estimated to have very short half-lives of 2 and 14 min, respectively. After the effector numbers have diminished, i.e., in LCMV-immune mice, the half-lives become 48 min and 2.8 h for NP396- and GP276-expressing targets, respectively. Analysis of several alternative models demonstrates that the estimates of half-life times of peptide-pulsed targets are not affected when changes are made in the model assumptions. Our report provides a unifying framework to compare killing efficacies of CD8 T-cell responses specific to different viral and bacterial infections in vivo, which may be used to compare efficacies of various cytotoxic-T-lymphocyte-based vaccines.
The time course of a CD8 T-cell response to several acute viral infections in mice is well understood (3, 18, 52), but several key parameters determining dynamics of the virus and virus-specific CD8 T cells are yet to be determined. For example, the death rate of virus-infected cells due to a CD8 T-cell response and the per capita killing efficacy of CD8 T cells are hardly known for most viral infections.
In a series of elegant articles, a new experimental method for measuring cytotoxicity of peptide-specific CD8 T cells in vivo was introduced (2, 7, 15, 30, 32). In this assay, peptide-pulsed and unpulsed target cells are transferred into mice harboring epitope-specific T cells and elimination of pulsed targets is used as an indication of antigen-specific killing in vivo (6, 13, 16, 28; reviewed in reference 29). Despite the widespread use of this technique to measure epitope-specific killing in acute and chronic viral infections (1, 23, 25, 33, 40, 42, 44, 49) by naive CD8 T cells (14), by CD4+ T cells (11), or during graft rejection (21), the output of the assay remains semiquantitative. Usually, one reports the percent killing of peptide-pulsed targets in a short-term killing assay. Due to the semiquantitative nature of the assay, it is hard to compare the efficacies of CD8 T-cell responses to different agents in vivo, e.g., due to different time windows used for the assay, different tissues sampled (e.g., spleen, lung, and lymph nodes), different numbers of CD8 T cells present in the tissue, etc. In contrast, killing of target cells in vitro has been investigated in great detail (34-36).
In this report, we illustrate how the killing efficacy of CD8 T-cell responses can be estimated using the in vivo cytotoxicity assay. Currently there are two types of experiments in which CD8 T-cell-mediated cytotoxicity is measured in vivo. In a few studies, killing of peptide-pulsed targets is recorded in a time series regularly over a short time period (6, 13), but in most other experiments, killing is measured at a single time point. In this report, we demonstrate how, using either time series data or single-point measurements, one can estimate the death rate or half-life times of peptide-pulsed targets due to CD8 T-cell-mediated killing.
Our work builds upon several previous studies attempting to estimate killing efficacy of CD8 T cells in vivo and adds several improvements to the previous analysis (7, 37, 51). In a pioneering study, Barchet et al. (7) have estimated the half-life of target cells expressing the GP33 epitope of lymphocytic choriomeningitis virus (LCMV) at the peak of the immune response to LCMV. As we show here, their study underestimated the killing efficacy of the GP33-specific CD8 T-cell response by assuming rapid migration of target cells from the blood to the spleen. Regoes et al. (37) extended the previous study by explicitly describing recruitment of targets from the blood to the spleen and by estimating the per-capita killing efficacies of memory and effector CD8 T cells specific to two epitopes of LCMV. Yates et al. (51) further extended this work by proposing a different fitting procedure for the estimation of the per-capita killing efficacy of CD8 T cells. In this article, we show that the model originally proposed by Regoes et al. (37) does not adequately describe the loss of peptide-pulsed targets over time in the data of Barber et al. (6). We formulate several alternative models that are more consistent with the analyzed data and show that from a single measurement of in vivo cytotoxicity one can estimate the death rate of target cells due to CD8 T cell-mediated killing. Finally, we demonstrate that the estimates of the death rates of pulsed targets are not affected when several changes are made in the model. In contrast, the estimates of the per-capita killing efficacies of CD8 T cells in vivo depend critically on the model assumptions (V. V. Ganusov and R. J. De Boer, unpublished data) and therefore are less reliable. These results strongly argue that in the absence of a better understanding of the process of killing of cells in the spleen, one should aim at estimating the overall efficacy of CD8 T-cell responses by calculating the death rates or half-life times of peptide-pulsed targets and not by estimating the per-capita killing efficacy of cytotoxic T lymphocytes (CTLs) as has been done before (37, 51). We also suggest additional experiments for further testing of specific predictions of the analyzed models that may allow a better understanding of how viral infections are controlled by CD8 T-cell responses.
MATERIALS AND METHODS
Cytotoxicity in vivo.
The method of measuring cytotoxicity of CD8 T cells in vivo has been described in detail elsewhere (29). In short, a population of mouse splenocytes is labeled with an intermediate concentration of 5- (and 6-) carboxyfluorescein diacetate succinimidyl ester (CFSE) and incubated with a relevant peptide in vitro (pulsed targets). Another population of splenocytes is labeled with a high concentration of CFSE and left unpulsed (unpulsed targets). Both peptide-pulsed and unpulsed cell populations are transferred into syngeneic hosts (generally intravenously [i.v.]), and the loss of peptide-pulsed targets is measured in the organ of interest, usually the mouse spleen. The percent killing is estimated from the reduction in the ratio of the percentage of pulsed target cells to unpulsed cells, which is corrected for the initial ratio (29). This calculation is similar to that used in the standard 51Cr release assay (6). For example, if 4 h after cell transfer, 10% of pulsed cells and 90% of unpulsed cells are recovered from the mouse spleen (R1 = 0.10/0.90) and the initial ratio of pulsed to unpulsed cells was 45% to 55% (R2 = 0.45/0.55), then the (corrected) ratio of pulsed to unpulsed targets is as follows: R = R1/R2 = (0.10/0.90):(0.45/0.55) ≈ 0.14; the percent killing is determined as L = 1 − R = 86% (29).
In this report, we analyze recently published data on killing of peptide-pulsed splenocytes by LCMV-specific effector and memory CD8 T cells (6, 37). The cytotoxicity in vivo assay was conducted as described above with some modifications. Target splenocytes were pulsed with NP396 or GP276 peptides of LCMV or were left unpulsed. Cells were transferred into syngeneic mice either infected with LCMV 8 days before (“acutely infected” mice) or that had recovered from LCMV infection (LCMV-immune or “memory” mice). At day 8 after the infection, the CD8 T-cell response to LCMV reaches its peak, and by 30 to 40 days after the infection, the CD8 T-cell response contracts and the memory phase starts (3, 31). At different times after the transfer of target cells, spleens were harvested and the numbers of pulsed and unpulsed targets, splenocytes, and peptide-specific CD8 T cells were measured.
Mathematical model for cytotoxicity in vivo assay.
Following i.v. injection, target splenocytes migrate to different tissues. The route of recirculation of splenocytes in mice has not been thoroughly investigated, however. Migration of radioactively labeled lymphocytes, mainly thoracic duct lymphocytes (TDLs), from the blood to different organs and back to blood has been extensively studied in rats and sheep (22, 38, 39, 45, 47) but may be different from that of splenocytes (38, 39). Based on previous studies, it is expected that many splenocytes enter the spleen (22, 39), one of the major lymphoid organs (24). Given these immunological details, modeling migration of pulsed and unpulsed targets from the blood to the spleen (or potentially another organ of interest) is done using a two-compartment model similar to one proposed earlier (37).
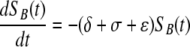
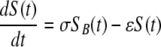
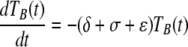
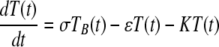
Target cells injected i.v. migrate from the blood to the spleen at rate σ, die at rate ɛ due to preparation techniques (independently of CD8 T-cell-mediated killing), or migrate to other tissues and/or die elsewhere at rate δ. Because of the method of obtaining single-cell suspensions (e.g., mincing the spleen or pushing it through a mesh) and long handling times, transferred splenocytes are expected to have some intrinsic death rate (27). Additional indirect evidence of low survival of splenocytes comes from the observation that generally only 10% or less of adoptively transferred lymphocytes (or splenocytes) are recovered in the spleen and major lymph nodes of recipient mice (26, 50). This is in contrast with TDLs, sampled from the lymph and therefore expected to undergo less mechanical death, since up to 80 to 90% of TDLs are recovered after adoptive transfer in rats (39, 46, 47). In the spleen, unpulsed and pulsed targets die due to preparation-induced death rate ɛ and pulsed targets also die due to CD8 T-cell-mediated killing, described by the rate K. The model equations are
 |
(1) |
 |
(2) |
 |
(3) |
 |
(4) |
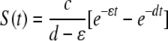
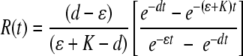
where SB(t) and TB(t) are the numbers of unpulsed and peptide-pulsed target cells in the blood, respectively, and S(t) and T(t) are the numbers of unpulsed and pulsed targets in the spleen, respectively; σ is the rate of migration of target cells from the blood into the spleen, and δ is the rate of cell migration/death from blood to other organs; ɛ is the extra death rate of transferred splenocytes due to preparation (independent of epitope-specific CD8 T cells), and K is the death rate of peptide-pulsed targets due to CD8 T-cell-mediated killing in the spleen. The initial conditions for the model are as follows: SB(0) = TB(0) = 5 × 10⁶ cells, and S(0) = T(0) = 0 (6). Because there is a constant number of epitope-specific CD8 T cells in the spleen in 4-h experiments (data not shown), the death rate of peptide-pulsed targets K due to CD8 T-cell-mediated killing is assumed to be constant over time. Note that in this formulation of the model, we assume that there is no specific killing of peptide-pulsed targets in the blood (see below for alternative models). Also note that we extend the previously suggested model (37) by adding an extra death rate, ɛ, due to preparation of targets. As we show in the main text, this extension is absolutely required for a satisfactory description of the data. One can easily solve the model equations and arrive at the following formulas:
 |
(5) |
 |
(6) |
where d = σ + ɛ + δ is the rate of removal of cells from the blood, c = SB(0)σ, and R(t) = T(t)/S(t) is the ratio of the number of pulsed to unpulsed targets in the spleen at time t. A simple analysis shows that the decline in the logarithm of the ratio, log[R(t)], over time is biphasic with the initial decline rate K/2, with a lower rate thereafter being determined by the difference between the rate of removal of targets from the blood, d, and the preparation-induced death rate ɛ (if K is >d, see Fig. 2 and the supplemental material). Fitting simple exponential or biexponential functions to data on the decline in the ratio R(t) for NP396- and GP276-pulsed targets in acutely infected mice confirms the biphasic nature of the decline (single versus double exponential decline fitted to arcsin ( )-transformed data, F2,34 = 70.45 with a P value of ≪0.001 for NP396-pulsed targets and F2,34 = 10.27 with a P value of ≪0.01 for GP276-pulsed targets). The arcsin(
 ) transformation is widely used to normalize frequency data distributed between 0 and 1 (53).
FIG. 2.

Fitting of the data on recruitment of target cells to the spleen (A and B) or on killing of peptide-pulsed targets in the spleen (C to F). Panels A and B show the recruitment of unpulsed targets into the spleen, and panels C to F show the decline in the ratio of pulsed to unpulsed targets in the spleen due to CD8 T-cell-mediated killing over time. Panels A, C, and D are for acutely infected mice, and panels B, E, and F are for memory mice. Panels C and E are for NP396-pulsed targets, and panels D and F are for GP276-pulsed targets. Black circles denote measurements from individual mice, and black lines denote the log average value per time point. Gray boxes show the numbers of recruited cells predicted by the model for individual mice (A and B) or the predicted average ratio (C to F). Gray lines show the log average between individually predicted values (A and B) or the predicted average ratio (C to F). Note a different scale for killing of target cells in acutely infected (C and D) or memory (E and F) mice. Parameters providing the best fit of the model are shown in Table 1. The RSS for this fit is 65.55.
When killing of peptide-pulsed targets is measured at several time points after the transfer, one should fit the model solutions given in equations 5 and 6 to the data to estimate the death rate of peptide-pulsed targets K due to CD8 T-cell-mediated killing.
When the killing assay is done for one time point, one can obtain an estimate of the minimal and maximal death rates of peptide-pulsed targets K using the assumptions of the above model and assuming small preparation-induced cell death rate (i.e., ɛ → 0; see the supplemental material). The upper-bound estimate for K is obtained by assuming that the rate of removal of cells from the blood is minimal, i.e., d → 0. The estimate of the death rate of peptide-pulsed targets Kmax is then found by solving the transcendental equation
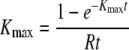 |
(7) |
where R is the ratio of pulsed to unpulsed targets at the time of the assay t. Note that when the death rate Kmax is large (i.e., Kmaxt ≫ 1), then Kmax ≈ 1/(Rt). The minimal estimate for the death rate of infected cells, Kmin, is found when migration of target cells into the organ where the killing occurs is instantaneous (i.e., when σ → ∞ in equation 6)
 |
(8) |
Survival of peptide-pulsed targets can also be expressed as half-lives, T1/2 = ln 2/K, Tmin = ln 2/Kmax, and Tmax = ln 2/Kmin. Note that to determine the death rate of targets due to CD8 T-cell-mediated killing, one need not measure the number of epitope-specific CD8 T cells at the site of killing.
It should be noted, however, that besides the main model with the preparation-induced cell death (given in equations 5 and 6), several alternative models can describe the data on killing of peptide-pulsed targets with reasonable quality. However, as we discuss in Results, these models require specific parameter values that we believe are not consistent with available data. Nevertheless, additional experimental data are required to discriminate between the alternative models.
Estimation of death rate of target cells from time series data.
We fit the data on recruitment of unpulsed cells into the spleen (“recruitment” data) and those on killing of peptide-pulsed target cells (“killing” data) with the model simultaneously for all six populations of cells (i.e., unpulsed and pulsed with either the NP396 or GP276 epitope) in acutely infected or memory mice using equations 5 and 6.
To describe recruitment of target cells from the blood to the spleen, we assume that the recruitment occurs at different rates in different mice. Indeed, plotting the total number of unpulsed target cells in the spleen versus the number of splenocytes for any particular time point reveals that the number of target cells recruited into the spleen increases with the spleen size (Fig. 1). Therefore, for every mouse, the rate of entrance of cells into the spleen, σ, is assumed to depend linearly on the number of splenocytes,
 |
(9) |
where (Ns)i is the number of splenocytes in the ith mouse and α is a coefficient. Because there are more splenocytes in acutely infected mice than in spleens of memory mice, we allow for two coefficients, αA and αM, to relate the rate of recruitment of targets from blood to the spleen and spleen size in acutely infected and memory mice, respectively. The extra death rate of targets, ɛ, and the rate of migration to other organs, δ, are assumed to be the same in different mice.
FIG. 1.

Plotting correlations between the numbers of unpulsed cells found in the spleen at different time points after transfer (shown in minutes) as a function of the number of splenocytes in acutely infected (A) or memory (B) mice. There is a positive correlation between the total number of unpulsed cells found and the number of splenocytes for most time points analyzed. This suggests that the rate of recruitment of targets into the spleen depends on the spleen size.
Targets pulsed with different peptides may have different death rates in the spleen due to CD8 T-cell-mediated killing, in part due to different sizes of populations of epitope-specific CD8 T cells. Then,  and
and  are the death rates of NP396- and GP276-expressing targets in acutely infected mice (due to killing by effector CD8 T cells). Similarly,
  and
and  are the death rates of NP396- and GP276-expressing targets in memory mice (due to killing by memory CD8 T cells).
Estimation of death rates of target cells from a single time point.
Measuring killing of peptide-pulsed targets at one time point does not allow for a rigorous test of different modeling approaches (as shown in Results). However, using the simple formulas given in equations 7 and 8, one can obtain maximal and minimal estimates of the death rates of peptide-pulsed targets due to CD8 T-cell-mediated killing. Specifically, for every measured fraction of target cells killed (L), one calculates the ratio R = 1 − L and using equations 7 and 8 finds an estimate of the maximal and minimal death rates of peptide-pulsed targets, respectively.
Statistics.
To fit both recruitment and killing data at the same time, we log transformed the data and the model predictions. This resulted in well-behaved residuals with a distribution statistically not different from a normal distribution (8) (P = 0.08, Shapiro-Wilk normality test). To access the lack of fit of the data with repeated measures, we used the F test (see reference 8, p. 29). To compare the quality of the fit of different models, we performed the partial F test to compare two nested models by the difference between their residual sum of squares (RSS) per additional parameter divided by the residual mean square of the largest of the two models (see reference 8, p.104). The residual mean square is the RSS divided by the residual degrees of freedom, i.e., the difference between the number of data points and the number of free parameters (8). The F distribution is parameterized by 2 degrees of freedom, Fn,k. The one in the numerator (n) is the difference in the number of parameters between the two models. The one in the denominator (k) is the number of degrees of freedom of the largest model (i.e., the number of data points minus the number of parameters). Fittings were done in the Mathematica 5.2 software program using the FindMinimum routine.
RESULTS
Estimating the death rate of peptide-pulsed targets using time series data.
We propose a mathematical model to estimate the killing efficacy of CD8 T-cell responses using the in vivo cytotoxicity assay. The model describes the recruitment of unpulsed targets from the blood to the spleen and the decline in the ratio of peptide-pulsed to unpulsed targets over time due to CD8 T-cell-mediated killing. Two mechanisms are included in the model: (i) target cells may die because of the preparation of single-cell suspensions, and (ii) the rate of recruitment of targets cells from the blood to the spleen depends on the spleen size in individual mice. The model was fitted to the data on killing of NP396- and GP276-pulsed targets in mice acutely infected with LCMV (8 days after the infection) and LCMV-immune, memory mice (see Materials and Methods for more detail).
We find that the proposed model (given in equations 5 and 6) describes reasonably well the recruitment of unpulsed targets into the spleens of acutely infected and LCMV-immune mice (Fig. 2A and B). This result suggests that the rate of recruitment of cells into the spleen was dependent on the spleen size (see also Fig. 1). This was also true for acutely infected mice, since assuming a constant rate of cell recruitment into the spleen in acutely infected mice resulted in a 25% decrease in the quality of the model fit to the data (or consequently an increase in the residual sum of squares from 14.2 to 18.9 for the data from acutely infected mice; results not shown).
Importantly, the model also predicts a biphasic decline in the ratio of NP396-pulsed to unpulsed targets over time in acutely infected mice, similar to what is observed in the data (Fig. 2C); changes in the ratio are well reproduced for memory mice as well (Fig. 2D and F). Overall, the data are described by the model with reasonable quality as judged by the lack-of-fit test (F29,162 = 1.53; P = 0.053; the low P value is due to several outliers, such as those shown in Fig. 2C at 120 min) and by the distribution of the residuals (P = 0.08, Shapiro-Wilk normality test).
Interestingly, we could set the rate of migration of target cells from the blood to other organs, δ, to 0 without reducing the quality of the model fit to the data (F1,190 = 0.17; P = 0.68). This suggests little or no migration of cells to other organs of mice. Reducing the number of other parameters in the model always resulted in a significantly worse description of the data. In particular, setting the preparation-induced cell death rate ɛ to 0 (in the model where δ was >0) resulted in significantly worse fits of the data (F1,190 = 19.82; P ≪ 0.001), mainly because of a poor description of recruitment of unpulsed targets into the spleen. This argues that the previously suggested model (37), which lacked this extra parameter, does not provide a satisfactory description of the data. This is further confirmed by the lack-of-fit test of the model with ɛ = 0 (F29,162 = 2.26; P ≪ 0.01). Allowing for αA = αM (these parameters determine the rate of cell migration from the blood to the spleen in acutely infected and memory mice, respectively) also resulted in significantly worse fits of the data (F1,191 = 13.59; P < 0.001).
Finally, assuming that recruitment of target cells from the blood to the spleen occurs similarly in all mice, i.e., independently of their spleen size, led to much worse fits of the data (RSS = 72.57). This further argues in favor of our hypothesis that recruitment of target cells into the spleen occurs at different rates in different mice.
Our analysis provides novel estimates for the half-life times (or death rates) of peptide-pulsed target cells in spleens of mice acutely infected and in mice that have cleared LCMV. We find that NP396- and GP276-pulsed targets have half-lives of 2 and 14 min, respectively, in acutely infected mice, while half of pulsed targets are eliminated in 48 min and 2.8 h in memory mice. The short half-life of peptide-pulsed targets in acutely infected mice is most likely due to a large population of epitope-specific CD8 T cells present at the peak of the immune response.
Estimating the death rate of peptide-pulsed targets from single measurements.
For every measured ratio of pulsed to unpulsed targets in the same data, we can also use the formulas given in equations 7 and 8 to estimate the maximal and minimal death rates of peptide-pulsed targets in spleens of acutely infected or memory mice due to CD8 T cell-mediated killing (Fig. 3). The analysis shows that there is a large variability in the estimated death rates, especially for NP396-pulsed targets, suggesting a large measurement noise in estimating the percentage of peptide-pulsed targets killed. Interestingly, the average of the maximum death rate of peptide-pulsed targets is only slightly higher than the predicted death rate, K, obtained by the analysis of the time series data (see Table 1). This argues that this method of calculation does deliver reliable estimates for the death rate of peptide-pulsed targets but may require repeated measurements of killing. In contrast, the minimal estimates of the death rates of peptide-pulsed targets are up to 10 times lower than the fitted values, especially for cases when killing is very fast (Fig. 3). This discrepancy may explain the very low estimates of the death rate of peptide-pulsed targets found in a previous study (7) that assumed rapid migration of target cells from the blood to the spleen (and therefore an estimated Kmin; see also Discussion). Since the maximum estimate of the death rate of peptide-pulsed targets remains relatively accurate when the model is changed in various ways (for example, assuming killing of peptide-pulsed targets in the blood; see the supplemental material), one can use Kmax as an upper-bound estimate for the efficacy of antigen-specific CD8 T-cell responses in vivo.
FIG. 3.

Maximal (•) and minimal (□) estimates of the death rate of peptide-pulsed cells due to CD8 T-cell-mediated killing, obtained from a single measurement of killing of peptide-pulsed targets (using equations 7 and 8). Average maximum estimates and standard deviations are as follows: 812 ± 1,160 per day (NP396 acute [A]), 110 ± 68 per day (GP276 acute [B]), 23 ± 17 per day (NP396 memory [C]), and 7 ± 4 per day (GP276 memory [D]). The average minimal estimates and the standard deviations are as follows: 68 ± 47 per day (NP396 acute), 35 ± 27 per day (GP276 acute), 8 ± 4 per day (NP396 memory), and 3 ± 2 per day (GP276 memory). Dashed horizontal lines denote estimates of the death rate of peptide-pulsed targets obtained by fitting the time series data (see Fig. 2 and Table 1). A large variation in individual estimates of the death rate of targets suggests that one should aim for performing longitudinal killing assays that allow for more-precise estimation of the death rates of peptide-pulsed targets. Eff, effector; Mem, memory.
TABLE 1.
Parameters providing the best fit of the model with preparation-induced death of targets (given in equations 5 and 6) to the dataa
| Parameter | Mean | Low 95% CI | High 95% CI |
|---|---|---|---|
| ɛ, min−1 | 4.71 × 10⁻³ | 3.34 × 10⁻³ | 6.17 × 10⁻³ |
| αA, min−1 | 7.17 × 10⁻¹² | 5.58 × 10⁻¹² | 9.22 × 10⁻¹² |
| αM, min−1 | 1.30 × 10⁻¹¹ | 0.92 × 10⁻¹¹ | 1.89 × 10⁻¹¹ |
 (min−1) (min−1) |
3.45 × 10⁻¹ | 2.59 × 10⁻¹ | 4.56 × 10⁻¹ |
 (min−1) (min−1) |
5.0 × 10⁻² | 3.80 × 10⁻² | 6.41 × 10⁻² |
 (min−1) (min−1) |
1.44 × 10⁻² | 1.10 × 10⁻² | 1.82 × 10⁻² |
 (min−1) (min−1) |
4.15 × 10⁻³ | 3.21 × 10⁻³ | 5.52 × 10⁻³ |
Here αA and αM are coefficients relating the recruitment rate of cells into the spleen in acutely infected (σ = αANs) or LCMV-immune (σ = αM Ns) mice, and the number of splenocytes in individual mice is Ns. In the fits, the rate of migration of labeled splenocytes to other organs, δ, was fixed to 0 since this did not affect the quality of the model fit to data (F1,190 = 0.15; P = 0.68). Data and model fits are shown in Fig. 2. The death rate of targets estimated by the model for acutely infected mice is as follows:  = 497 and
  = 72 per day for NP396- and GP276-pulsed targets, respectively. In memory mice, the death rate of peptide-pulsed targets is as follows:
  = 21 and
  = 6 per day for NP396- and GP276-pulsed targets, respectively. These rates correspond to half-lives of 2 and 14 min for NP396- and GP276-expressing targets at the peak of the CD8 T-cell response and 48 min and 2.8 h for NP396- and GP276-expressing targets in LCMV-immune mice, respectively. CIs were calculated by bootstrapping the data with 1,000 simulations (19).
Alternative models, potential problems, and future experimental tests.
The biphasic decline in the ratio of peptide-pulsed to unpulsed targets (for example, see Fig. 2C) is one of the important features of these data that was missed in the previous analyses. There are several alternative models that can provide the slowdown of the decline in the ratio over time.
In the main model, in which target cells have a preparation-induced poor survival in recipient hosts, the slowing down of the decline in the ratio R is due to a slow removal of target cells from the blood (given by the parameter d = ɛ + δ + σ). At very high rates of killing of peptide-pulsed targets, killing in the spleen can indeed become limited by the rate of recruitment of pulsed targets from the blood to the spleen. The preparation-induced cell death rate is then required to properly describe the recruitment of unpulsed targets from the blood to the spleen. For acutely infected mice, we estimate the average rate of removal of cells from the blood as d ≈ 0.006 min−1, corresponding to a half-life of cells in the blood of 1.95 h. To our knowledge, the rate of removal of splenocytes from circulation in mice has not yet been estimated, and future experiments would be needed to test this quantitative prediction of our model. Interestingly, some studies have found that transferred splenocytes can be detected in the blood for long periods of time, although the rate of their removal from the blood has not been estimated (1, 2). The net slow removal of targets from the blood could also come from influx of cells that first migrated to other organs, such as the lungs or liver, and then back to the circulation (39; also results not shown). It is important to note, however, that the estimated rate of removal of splenocytes from the blood is severalfold lower than that of TDLs, which reside in the blood of rats only for ∼30 min (22, 39).
The biphasic decline in the ratio of pulsed to unpulsed targets could also be due to a loss of recognition of peptide-pulsed targets by epitope-specific CD8 T cells. This may occur, for example, due to different expression levels of peptide-major histocompatibility complex (MHC) complexes on the surface of target splenocytes due to migration of targets into areas of the spleen hardly reachable by activated CD8 T cells (e.g., B-cell zones) or due to the loss of peptides from the surfaces of peptide-pulsed cells (51). Since the latter is the most mechanistic, we have formulated a model describing the loss of peptides from MHC molecules on the cell surface, and indeed, this model produced expected biphasic fits of the data (see the supplemental material; also results not shown). The model fits suggested that peptide-pulsed targets should become unrecognizable by epitope-specific CD8 T cells with the half-life time of about 4 h. Given that the half-lives of most specific peptide and MHC class I molecule complexes in vitro range from 6 to more than 20 h (5, 12, 41, 43), the loss of recognition by CD8 T cells by peptide-pulsed cells in the time scale of 4 h seems rather fast. Additional experimental work would be required to investigate the rate at which peptide-pulsed targets become unrecognizable by epitope-specific CD8 T cells in vivo.
Our main model allowing for preparation-induced (CD8 T-cell-independent) cell death predicts that at the constant death rate of ɛ ≈ 0.005 min−1, very few unlabeled splenocytes (∼0.03% of the transferred number) are expected to be found in the spleen at 24 h after the transfer. This is not realistic, since it is known that at 24 h after adoptive transfer, about 5 to 10% of transferred cells are found in the spleen (9, 26). It is natural to assume, however, that the preparation-induced death rate declines over time. This would imply that many cells die initially and fewer cells die later after preparation (27). Simple extension of the main model to include a decline in the death rate ɛ with time, i.e., ɛ = ɛ0 × exp[−βt], also describes the data with reasonable quality and predicts an accumulation of 9% of injected unpulsed targets in the spleen by 24 h (ɛ0 = 0.013 min−1; β = 0.008 min−1). Because the estimated rate of decline β is relatively small, this modification of the model does not affect substantially the dynamics of peptide-pulsed or unpulsed targets on the short time scale of the experiment (F1,190 = 1.83; P = 0.18).
Because of a relatively high estimate for the preparation-induced cell death rate, our model fits also predict a very low rate of migration of targets to other organs, δ ≈ 6.3 × 10⁻⁴ min−1 (with the 95% confidence intervals [CIs] of 0 and 3.5 × 10⁻³ min−1). Simple analysis suggests that about 2.1 × 10⁵ (or maximally 1.4 × 10⁶) injected unpulsed targets will migrate to other organs in 4 h of the assay. Measuring the number of unpulsed targets in other organs of mice (e.g., lung or liver) at different times after cell transfer may allow for experimental testing of this specific model prediction.
We have also formulated and analyzed another model in which cells that have migrated to the spleen can also migrate back to the blood. Kinetically, this model is very similar to the model with preparation-induced cell death (results not shown). The model also provided a reasonable description of the data, and the biphasic decline in the ratio of pulsed to unpulsed targets in this model is also due to a slow removal of targets from the blood. The model also predicts a 10-fold-higher rate of migration of targets to other organs of mice, δ ≈ 5.0 × 10⁻³ min−1, and as a consequence, a higher maximal number of target cells migrating to other organs (∼3.1 × 10⁶). This alternative model also estimated a relatively short half-life of unpulsed targets in the spleen, T1/2 ≈ 2 h, which is two- to threefold smaller than the estimated half-life of TDLs in the spleen in rats (22, 39).
The biphasic decline in the ratio of peptide-pulsed to unpulsed targets could also arise if the death rate of peptide-pulsed targets due to CD8 T-cell-mediated killing declines over time. For example, the killing efficacy of CD8 T cells may depend on the density of peptide-pulsed targets, with higher target cell densities leading to a higher killing efficacy. This, in turn, may arise if peptide-pulsed target cells stimulate CD8 T cells to increase their cytotoxicity (e.g., upregulate FasL, perforin, etc). Phenomenologically, changes in the death rate of pulsed targets with their density could be modeled by replacing the death term KT in equation 4 with KTa, with a being >1. This phenomenological model, when fitted to data, indeed allowed for the biphasic decline in the ratio R (with an estimated a value of 1.68), although the quality of the model fit to data was worse than that for the mechanistic models discussed above (RSS = 70.55; results not shown). Thus, a poor fit of the model with a density-dependent death rate of peptide-pulsed targets makes this phenomenological model less likely than a more mechanistic model with preparation-induced cell death.
In our analysis, we assumed that killing of peptide-pulsed targets occurred only in the spleen. Extending the model to allow for killing of peptide-pulsed targets in the blood did not lead to a significantly better description of the data (F1,191 = 0.01; P = 0.99). However, future experiments may need to investigate whether any killing of peptide-pulsed targets occurs in the blood, since in general this can affect the estimation of model parameters (see the supplemental material; also results not shown).
In summary, we find several realistic alternative models that describe the data well. For finer discrimination between rival models, additional experiments are necessary to test specific predictions of these models. Most importantly, the estimates of the death rates of peptide-pulsed targets due to CD8 T-cell-mediated killing are quantitatively similar in all these alternative models (with the exception of the model with a density-dependent death rate of targets; results not shown). This further highlights the robustness of the proposed modeling framework for estimation of the killing efficacy of CD8 T-cell responses in vivo.
DISCUSSION
In this report, we have formulated a novel approach allowing estimation of the death rate of peptide-pulsed targets due to CD8 T-cell-mediated killing from the in vivo cytotoxicity assay. We have shown how measuring killing of peptide-pulsed targets at one or several time points allows one to estimate the death rate of epitope-expressing target cells. This report, thus, forms a basis for quantification of the widely used approach to measure cytotoxicity of T cells in vivo.
A previous study using measurements of frequency of CD8 T cells in the mouse spleen following acute LCMV infection has investigated whether effector and memory CD8 T cells have similar per-capita killing efficacies (37). Here we show that in the absence of measured CTL frequencies, one can estimate the death rates of peptide-pulsed targets due to CTLs and therefore measure cytotoxic efficacy of the CD8 T-cell response in vivo. Neglecting the numbers of epitope-specific CD8 T cells may seem like a step backwards from previous studies (37, 51). However, to estimate the per-capita killing efficacy, one has to make assumptions on how the death rate of targets is functionally related to the number of epitope-specific T cells. This is generally unknown, and assuming different types of killing terms may change the estimated per-capita killing efficacy by orders of magnitude. For example, at the peak of the CD8 T-cell response to LCMV, there are ≈1.1 × 10⁷ NP396-specific CD8 T cells in the mouse spleen (E) (6, 31). Assuming the mass-action killing term K = kE, the per-capita killing efficacy of NP396-specific CD8 T cells is  ≈ 4.5 × 10⁻⁵ cell−1 day−1. However, if the death rate of pulsed targets were to saturate at high effector numbers, K = kE/(1 + cEE), then the estimated per capita killing rate depends on the half-saturation constant cE, i.e., k ≈ cEK (for E ≫ 1). For cE = 10−6, one obtains k ≈ 5 × 10⁻⁴ cell−1 day−1, which is 11 times higher than if the killing follows mass action. Therefore, in the absence of solid knowledge of how to model the target and CD8 T-cell encounter in the spleen, estimating the death rate of pulsed targets due to CD8 T-cell-mediated killing seems to be most appropriate and robust.
Our analysis suggests that there is a correlation between the number of target cells entering the spleen from the blood at a given time point and the spleen size. Such a correlation may be expected to arise simply due to experimental techniques, since the total number of recruited cells in the spleen is calculated by multiplying the frequency of unpulsed targets in the spleen by the number of splenocytes. In the presence of measurement noise, this by itself leads to a positive correlation between spleen size and the number of cells recruited to the spleen. Alternatively, a larger number of blood vessels in the spleen could lead to both a larger spleen size and a larger cell entrapment area and as a result to a higher rate of recruitment of cells into a larger spleen. In this respect, it is interesting to note that a twofold-lower rate of cell recruitment to the spleen in acutely infected mice than in memory mice (αA versus αM; see Table 1) may indicate a decreased rate of cell immigration to the spleen from the circulation. This is likely to occur close to the peak of the immune response, when many antigen-specific T cells leave lymphoid organs and migrate to peripheral tissues. Future studies need to address the migration pattern of splenocytes in mice and investigate potential mechanisms that may affect recruitment of target cells into the spleen.
We find that peptide-pulsed targets survive in acutely infected mice only for a few minutes. Such extremely short half-lives are due to a large population of effector CD8 T cells present at the peak of the immune response. Because there are fewer memory CD8 T cells than effector CD8 T cells at the peak of the immune response, peptide-pulsed targets survive for longer times in LCMV-immune mice. Importantly, the overall killing efficacy of epitope-specific CD8 T-cell response is correlated with the magnitude of the response. NP396-specific effectors reach the highest numbers at the peak of the response ([1.1 ± 0.6] × 106), NP396-specific memory CD8 T cells ([3.3 ± 2.5] × 105), and GP276-specific memory CD8 T cells ([2.1 ± 1.5] × 105). Therefore, a low killing efficacy of CD8 T-cell responses observed in some studies could simply arise because of a small number of antigen-specific CD8 T cells and not because of a low per-capita killing efficacy of CD8 T cells.
In a comparison of our results to those of previous studies (7, 37, 51), we provide the highest estimates for the death rate of peptide-pulsed targets in mice acutely infected with LCMV and in LCMV-immune mice. In their pioneering study, Barchet et al. (7) estimated the death rate of GP33-expressing targets to be about five per day. This is almost 100-fold lower than our estimate for the death rate of NP396-pulsed targets and about 14 times lower than the estimate for GP276-pulsed targets. This difference could arise for several reasons. First, Barchet et al. (7) assumed a rapid migration of target cells from the blood to the spleen. Assuming a similar rapid migration of cells into the spleen in our model led to dramatically lower estimates for the death rate of pulsed targets in acutely infected mice ( = 30 day−1, and
  = 16 day−1, or about 5 to 15 times lower than the estimates given in Table 1). Second, Barchet et al. (7) used splenocytes from H8 mice that ubiquitously expressed the GP33 epitope of LCMV, and the level of expression of the endogenously produced peptide could be lower than that of a target cell pulsed with a high concentration of the specific peptide. Indeed, previous studies have found that the percentage of targets killed in the in vivo cytotoxicity assay depends on the amount of the peptide used for pulsing (6, 13). Finally, GP33-specific CD8 T cells may have a lower per-capita killing efficacy than NP396- or GP276-specific CD8 T cells, also leading to the lower death rate of GP33-expressing targets.
Our estimates for the death rate of pulsed targets are also higher than those calculated from a previous study by multiplying the estimated per-capita killing efficacy of effector and memory CD8 T cells and their frequency in the mouse spleen (37). The main reason for this is that the model proposed by those authors poorly describes the early loss of NP396- and GP276-expressing targets in acutely infected mice (results not shown). We have shown that the early decline in the ratio of pulsed to unpulsed targets, R(t), is determined mainly by the death rate of pulsed targets due to CD8 T-cell-mediated killing. Therefore, a poor description of the early killing may lead to underestimation of the killing efficacy of T-cell responses. However, other reasons, such as different fitting procedures employed in our and other studies, may have contributed to different estimates of the death rate of targets (see, for example, reference 51).
We find that NP396-expressing targets are killed by memory CD8 T cells at a rate of 20 per day in the spleen (i.e., pulsed targets have a half-life of 48 min). Interestingly, since most of strains of LCMV replicate at rates less than 5 to 10 per day (10, 20), i.e., it takes 1 to 2 h for a virus population to double its size, our estimates suggest that an NP396-specific memory CD8 T-cell population can prevent virus regrowth in the spleen upon reinfection and as such could alone provide sterilizing immunity if memory cells were present at the right place and at the right time (see reference 17).
Our analysis also allows one to calculate the number of target cells killed on average by one CD8 T cell per day (4, 48). This parameter is given simply by KT(t)/E, where K is the death rate of pulsed targets due to the CD8 T-cell response, T is the number of targets expressing a particular epitope at time t after cell transfer, and E is the number of epitope-specific CD8 T cells in the spleen. Using the estimates for K from Table 1, we find that LCMV-specific memory CD8 T cells kill more target cells per day than effectors (Fig. 4). This result may seem counterintuitive, since pulsed targets are eliminated much faster in acutely infected mice than in memory mice. However, acutely infected mice have 30 times more epitope-specific CD8 T cells, and because of that, on average, less than one target was killed by one effector CD8 T cell per day. In contrast, in some mice one memory CD8 T cell killed up to 20 targets per day.
FIG. 4.

The average number of target cells killed per day by one epitope-specific effector or one memory CD8 T cell. The number of target cells killed per day is simply KT(t)/E, where T(t) is the number of target cells taken from the data, K is the death rate of pulsed targets, and E is the average number of epitope-specific CD8 T cells in the spleen (see Table 1). Note that by calculating the average number of targets killed per day by one CD8 T cell, we do not make any assumptions on the type of the killing term. Also note that the number of targets killed per day per CD8 T cell is not the per-capita killing efficacy of CD8 T cells, as it was estimated in previous studies (37, 51). The average number of target cells killed per day by an NP396-specific effector or memory CD8 T cell is 0.7 or 5.4, respectively, and that for a GP276-specific effector or memory CD8 T cell is 1.2 or 4.2 cells per day, respectively.
Although this framework of estimation of death rates has been applied to measure killing in the spleen, it can easily be extended to measure killing in other organs of mice. If killing is measured for longer periods of time (say, 12 to 24 h), then the models analyzed here will have to be extended to allow for the following: (i) recirculation of targets that had migrated to various organs back to the blood and (ii) potential changes in the number of epitope-specific CD8 T cells and as a consequence changes in the death rate of pulsed targets over time. Our report also emphasizes the importance of obtaining time series data on killing of peptide-pulsed targets because these allow a more rigorous analysis of the data and also testing of alternative models of killing. Application of this approach to measure killing efficacy of effector and memory CD8 T-cell responses in other viral and bacterial infections will allow a more quantitative understanding of immunology and potentially may lead to better predictions of the protective value of memory CD8 T cells of different specificities.
Supplementary Material
Acknowledgments
We thank Joost Beltman, Kalet Leon, John Wherry, Dan Barber, Gennady Bocharov, Roland Regoes, Andrew Yates, and several reviewers for comments and suggestions during this work.
This work was supported by VICI grant 016.048.603 from NWO and a Marie Curie Incoming International Fellowship (FP6).
Footnotes
Published ahead of print on 24 September 2008.
Supplemental material for this article may be found at http://jvi.asm.org/.
REFERENCES
- 1.Agnellini, P., P. Wolint, M. Rehr, J. Cahenzli, U. Karrer, and A. Oxenius. 2007. Impaired NFAT nuclear translocation results in split exhaustion of virus-specific CD8+ T cell functions during chronic viral infection. Proc. Natl. Acad. Sci. USA 1044565-4570. [DOI] [PMC free article] [PubMed] [Google Scholar]
- 2.Aichele, P., K. Brduscha-Riem, S. Oehen, B. Odermatt, R. Zinkernagel, H. Hengartner, and H. Pircher. 1997. Peptide antigen treatment of naive and virus-immune mice: antigen-specific tolerance versus immunopathology. Immunity 6519-529. [DOI] [PubMed] [Google Scholar]
- 3.Antia, R., V. Ganusov, and R. Ahmed. 2005. The role of models in understanding CD8+ T-cell memory. Nat. Rev. Immunol. 5101-111. [DOI] [PubMed] [Google Scholar]
- 4.Asquith, B., A. Mosley, A. Barfield, s. Marshall, A. Heaps, P. Goon, E. Hanon, Y. Tanaka, G. Taylor, and C. Bangham. 2005. A functional CD8+ cell assay reveals individual variation in CD8+ cell antiviral efficacy and explains differences in human T-lymphotropic virus type 1 proviral load. J. Gen. Virol. 861515-1523. [DOI] [PubMed] [Google Scholar]
- 5.Assarsson, E., J. Sidney, C. Oseroff, V. Pasquetto, H. H. Bui, N. Frahm, C. Brander, B. Peters, H. Grey, and A. Sette. 2007. A quantitative analysis of the variables affecting the repertoire of T cell specificities recognized after vaccinia virus infection. J. Immunol. 1787890-7901. [DOI] [PubMed] [Google Scholar]
- 6.Barber, D., E. Wherry, and R. Ahmed. 2003. Cutting edge: rapid in vivo killing by memory CD8 T cells. J. Immunol. 17127-31. [DOI] [PubMed] [Google Scholar]
- 7.Barchet, W., S. Oehen, P. Klenerman, D. Wodarz, G. Bocharov, A. L. Lloyd, M. A. Nowak, H. Hengartner, R. M. Zinkernagel, and S. Ehl. 2000. Direct quantitation of rapid elimination of viral antigen-positive lymphocytes by antiviral CD8(+) T cells in vivo. Eur. J. Immunol. 301356-1363. [DOI] [PubMed] [Google Scholar]
- 8.Bates, D. M., and D. G. Watts. 1988. Nonlinear regression analysis and its applications. John Wiles & Sons, Inc., Hoboken, NJ.
- 9.Blattman, J. N., R. Antia, D. J. Sourdive, X. Wang, S. M. Kaech, K. Murali-Krishna, J. D. Altman, and R. Ahmed. 2002. Estimating the precursor frequency of naive antigen-specific CD8 T cells. J. Exp. Med. 195657-664. [DOI] [PMC free article] [PubMed] [Google Scholar]
- 10.Bocharov, G., B. Ludewig, A. Bertoletti, P. Klenerman, T. Junt, P. Krebs, T. Luzyanina, C. Fraser, and R. Anderson. 2004. Underwhelming the immune response: effect of slow virus growth on CD8+-T-lymphocyte responses. J. Virol. 782247-2254. [DOI] [PMC free article] [PubMed] [Google Scholar]
- 11.Brown, D., A. Dilzer, D. Meents, and S. Swain. 2006. CD4 T cell-mediated protection from lethal influenza: perforin and antibody-mediated mechanisms give a onetwo punch. J. Immunol. 1772888-2898. [DOI] [PubMed] [Google Scholar]
- 12.Busch, D., and E. Pamer. 1998. MHC class I/peptide stability: implications for immunodominance, in vitro proliferation, and diversity of responding CTL. J. Immunol. 1604441-4448. [PubMed] [Google Scholar]
- 13.Byers, A., C. Kemball, J. Moser, and A. Lukacher. 2003. Cutting edge: rapid in vivo CTL activity by polyoma virus-specific effector and memory CD8+ T cells. J. Immunol. 17117-21. [DOI] [PubMed] [Google Scholar]
- 14.Chiu, C., A. Heaps, V. Cerundolo, A. McMichael, C. Bangham, and M. Callan. 2007. Early acquisition of cytolytic function and transcriptional changes in a primary CD8+ T-cell response in vivo. Blood 1091086-1094. [DOI] [PubMed] [Google Scholar]
- 15.Coles, R., S. Mueller, W. Heath, F. Carbone, and A. Brooks. 2002. Progression of armed CTL from draining lymph node to spleen shortly after localized infection with herpes simplex virus 1. J. Immunol. 168834-838. [DOI] [PubMed] [Google Scholar]
- 16.Curtsinger, J., D. Lins, and M. Mescher. 2003. Signal 3 determines tolerance versus full activation of naive CD8 T cells: dissociating proliferation and development of effector function. J. Exp. Med. 1971141-1151. [DOI] [PMC free article] [PubMed] [Google Scholar]
- 17.De Boer, R. 2007. Understanding the failure of CD8+ T-cell vaccination against simian/human immunodeficiency virus. J. Virol. 812838-2848. [DOI] [PMC free article] [PubMed] [Google Scholar]
- 18.Doherty, P. C., and J. P. Christensen. 2000. Accessing complexity: the dynamics of virus-specific T cell responses. Annu. Rev. Immunol. 18561-592. [DOI] [PubMed] [Google Scholar]
- 19.Efron, B., and R. Tibshirani. 1993. An introduction to the bootstrap. Chapman & Hall, New York, NY.
- 20.Ehl, S., P. Klenerman, P. Aichele, H. Hengartner, and R. Zinkernagel. 1997. A functional and kinetic comparison of antiviral effector and memory cytotoxic T lymphocyte populations in vivo and in vitro. Eur. J. Immunol. 273404-3413. [DOI] [PubMed] [Google Scholar]
- 21.Filatenkov, A., E. Jacovetty, U. Fischer, J. Curtsinger, M. Mescher, and E. Ingulli. 2005. CD4 T cell-dependent conditioning of dendritic cells to produce IL-12 results in CD8-mediated graft rejection and avoidance of tolerance. J. Immunol. 1746909-6917. [DOI] [PubMed] [Google Scholar]
- 22.Ford, W., and S. Simmonds. 1972. The tempo of lymphocyte recirculation from blood to lymph in the rat. Cell Tissue Kinet. 5175-189. [DOI] [PubMed] [Google Scholar]
- 23.Fuller, M., A. Khanolkar, A. Tebo, and A. Zajac. 2004. Maintenance, loss, and resurgence of T cell responses during acute, protracted, and chronic viral infections. J. Immunol. 1724204-4214. [DOI] [PubMed] [Google Scholar]
- 24.Ganusov, V., and R. De Boer. 2007. Do most lymphocytes in humans really reside in the gut? Trends Immunol. 28514-518. [DOI] [PubMed] [Google Scholar]
- 25.Guarda, G., M. Hons, S. Soriano, A. Huang, R. Polley, A. Martin-Fontecha, J. Stein, R. Germain, A. Lanzavecchia, and F. Sallusto. 2007. L-selectin-negative CCR7-effector and memory CD8+ T cells enter reactive lymph nodes and kill dendritic cells. Nat. Immunol. 8743-752. [DOI] [PubMed] [Google Scholar]
- 26.Hataye, J., J. Moon, A. Khoruts, C. Reilly, and M. Jenkins. 2006. Naive and memory CD4+ T cell survival controlled by clonal abundance. Science 312114-116. [DOI] [PubMed] [Google Scholar]
- 27.Hawkins, E., M. Turner, M. Dowling, C. van Gend, and P. Hodgkin. 2007. A model of immune regulation as a consequence of randomized lymphocyte division and death times. Proc. Natl. Acad. Sci. USA 1045032-5037. [DOI] [PMC free article] [PubMed] [Google Scholar]
- 28.Hermans, I., J. Silk, J. Yang, M. Palmowski, U. Gileadi, C. McCarthy, M. Salio, F. Ronchese, and V. Cerundolo. 2004. The VITAL assay: a versatile fluorometric technique for assessing CTL and NKT-mediated cytotoxicity against multiple targets in vitro and in vivo. J. Immunol. Methods 28525-40. [DOI] [PubMed] [Google Scholar]
- 29.Ingulli, E. 2007. Tracing tolerance and immunity in vivo by CFSE-labeling of administered cells. Methods Mol. Biol. 380365-376. [DOI] [PubMed] [Google Scholar]
- 30.Mueller, S., C. Jones, C. Smith, W. Heath, and F. Carbone. 2002. Rapid cytotoxic T lymphocyte activation occurs in the draining lymph nodes after cutaneous herpes simplex virus infection as a result of early antigen presentation and not the presence of virus. J. Exp. Med. 195651-656. [DOI] [PMC free article] [PubMed] [Google Scholar]
- 31.Murali-Krishna, K., J. Altman, M. Suresh, D. Sourdive, A. Zajac, J. Miller, J. Slansky, and R. Ahmed. 1998. Counting antigen-specific CD8+ T cells: a re-evaluation of bystander activation during viral infection. Immunity 8177-187. [DOI] [PubMed] [Google Scholar]
- 32.Oehen, S., and K. Brduscha-Riem. 1998. Differentiation of naive CTL to effector and memory CTL: correlation of effector function with phenotype and cell division. J. Immunol. 1615338-5346. [PubMed] [Google Scholar]
- 33.Peixoto, A., C. Evaristo, I. Munitic, M. Monteiro, A. Charbit, B. Rocha, and H. Veiga-Fernandes. 2007. CD8 single-cell gene coexpression reveals three different effector types present at distinct phases of the immune response. J. Exp. Med. 2041193-1205. [DOI] [PMC free article] [PubMed] [Google Scholar]
- 34.Perelson, A., and G. Bell. 1982. Delivery of lethal hits by cytotoxic T lymphocytes in multicellular conjugates occurs sequentially but at random times. J. Immunol. 1292796-2801. [PubMed] [Google Scholar]
- 35.Perelson, A., and C. Macken. 1985. Quantitative models for the kinetics of cell-mediated cytotoxicity at the single cell level. Adv. Exp. Med. Biol. 184551-561. [DOI] [PubMed] [Google Scholar]
- 36.Perelson, A., C. Macken, E. Grimm, L. Roos, and B. Bonavida. 1984. Mechanism of cell-mediated cytotoxicity at the single cell level. VIII. Kinetics of lysis of target cells bound by more than one cytotoxic T lymphocyte. J. Immunol. 1322190-2198. [PubMed] [Google Scholar]
- 37.Regoes, R., D. Barber, R. Ahmed, and R. Antia. 2007. Estimation of the rate of killing by cytotoxic T lymphocytes in vivo. Proc. Natl. Acad. Sci. USA 1041599-1603. [DOI] [PMC free article] [PubMed] [Google Scholar]
- 38.Reynolds, J., I. Heron, L. Dudler, and Z. Trnka. 1982. T-cell recirculation in the sheep: migratory properties of cells from lymph nodes. Immunology 47415-421. [PMC free article] [PubMed] [Google Scholar]
- 39.Smith, M., and W. Ford. 1983. The recirculating lymphocyte pool of the rat: a systematic description of the migratory behaviour of recirculating lymphocytes. Immunology 4983-94. [PMC free article] [PubMed] [Google Scholar]
- 40.Stambas, J., P. Doherty, and S. Turner. 2007. An in vivo cytotoxicity threshold for influenza A virus-specific effector and memory CD8(+) T cells. J. Immunol. 1781285-1292. [DOI] [PubMed] [Google Scholar]
- 41.Tian, S., R. Maile, E. Collins, and J. Frelinger. 2007. CD8+ T cell activation is governed by TCR-peptide/MHC affinity, not dissociation rate. J. Immunol. 1792952-2960. [DOI] [PubMed] [Google Scholar]
- 42.Tzelepis, F., P. Persechini, and M. Rodrigues. 2007. Modulation of CD4+ T cell-dependent specific cytotoxic CD8+ T cells differentiation and proliferation by the timing of increase in the pathogen load. PLoS ONE 2e393. [DOI] [PMC free article] [PubMed] [Google Scholar]
- 43.van der Burg, S. H., M. J. Visseren, R. M. Brandt, W. M. Kast, and C. J. Melief. 1996. Immunogenicity of peptides bound to MHC class I molecules depends on the MHC-peptide complex stability. J. Immunol. 1563308-3314. [PubMed] [Google Scholar]
- 44.van Stipdonk, M., G. Hardenberg, M. Bijker, E. Lemmens, N. Droin, D. Green, and S. Schoenberger. 2003. Dynamic programming of CD8+ T lymphocyte responses. Nat. Immunol. 4361-365. [DOI] [PubMed] [Google Scholar]
- 45.Westermann, J., E. Ehlers, M. Exton, M. Kaiser, and U. Bode. 2001. Migration of naive, effector and memory T cells: implications for the regulation of immune responses. Immunol. Rev. 18420-37. [DOI] [PubMed] [Google Scholar]
- 46.Westermann, J., S. Persin, J. Matyas, P. van der Meide, and R. Pabst. 1994. Migration of so-called naive and memory T lymphocytes from blood to lymph in the rat. The influence of IFN-gamma on the circulation pattern. J. Immunol. 1521744-1750. [PubMed] [Google Scholar]
- 47.Westermann, J., S. Sollner, E. Ehlers, K. Nohroudi, M. Blessenohl, and K. Kalies. 2003. Analyzing the migration of labeled T cells in vivo: an essential approach with challenging features. Lab. Investig. 83459-469. [DOI] [PubMed] [Google Scholar]
- 48.Wick, W., O. Yang, L. Corey, and S. Self. 2005. How many human immunodeficiency virus type 1-infected target cells can a cytotoxic T-lymphocyte kill? J. Virol. 7913579-13586. [DOI] [PMC free article] [PubMed] [Google Scholar]
- 49.Wolint, P., M. Betts, R. Koup, and A. Oxenius. 2004. Immediate cytotoxicity but not degranulation distinguishes effector and memory subsets of CD8+ T cells. J. Exp. Med. 199925-936. [DOI] [PMC free article] [PubMed] [Google Scholar]
- 50.Yarke, C., S. Dalheimer, N. Zhang, D. Catron, M. Jenkins, and D. Mueller. 2008. Proliferating CD4+ T cells undergo immediate growth arrest upon cessation of TCR signaling in vivo. J. Immunol. 180156-162. [DOI] [PubMed] [Google Scholar]
- 51.Yates, A., F. Graw, D. L. Barber, R. Ahmed, R. R. Regoes, and R. Antia. 2007. Revisiting estimates of CTL killing rates in vivo. PLoS ONE 2e1301. [DOI] [PMC free article] [PubMed] [Google Scholar]
- 52.Yewdell, J. 2006. Confronting complexity: real-world immunodominance in antiviral CD8+ T cell responses. Immunity 25533-543. [DOI] [PubMed] [Google Scholar]
- 53.Zar, J. 1999. Biostatistical analysis. Prentice Hall, Upper Saddle River, NJ.
Associated Data
This section collects any data citations, data availability statements, or supplementary materials included in this article.