

Abstract
Background
Very little is known about the immunological responses of amphibians to pathogens that are causing global population declines. We used a custom microarray gene chip to characterize gene expression responses of axolotls (Ambystoma mexicanum) to an emerging viral pathogen, Ambystoma tigrinum virus (ATV).
Result
At 0, 24, 72, and 144 hours post-infection, spleen and lung samples were removed for estimation of host mRNA abundance and viral load. A total of 158 up-regulated and 105 down-regulated genes were identified across all time points using statistical and fold level criteria. The presumptive functions of these genes suggest a robust innate immune and antiviral gene expression response is initiated by A. mexicanum as early as 24 hours after ATV infection. At 24 hours, we observed transcript abundance changes for genes that are associated with phagocytosis and cytokine signaling, complement, and other general immune and defense responses. By 144 hours, we observed gene expression changes indicating host-mediated cell death, inflammation, and cytotoxicity.
Conclusion
Although A. mexicanum appears to mount a robust innate immune response, we did not observe gene expression changes indicative of lymphocyte proliferation in the spleen, which is associated with clearance of Frog 3 iridovirus in adult Xenopus. We speculate that ATV may be especially lethal to A. mexicanum and related tiger salamanders because they lack proliferative lymphocyte responses that are needed to clear highly virulent iridoviruses. Genes identified from this study provide important new resources to investigate ATV disease pathology and host-pathogen dynamics in natural populations.
Background
Emerging infectious diseases (EIDs) pose a serious threat to the health, stability, and persistence of human and wildlife populations [1-4]. Genetic and genomic tools have been incredibly useful for discovery of genes associated with host response and variation in resistance or susceptibility to a variety of pathogens [5-7]. The advent of genomic tools such as microarray analysis has offered new insights into host-pathogen systems. Additionally, their application to genomic response to host disease response allows rapid characterization of candidate genes for further research into control and eradication methods.
EIDs are a leading hypothesis for the global decline of amphibians and two pathogens in particular, Batrachochytrium dendrobatidis and Ranaviruses have been implicated in worldwide epizootics. Although studies are beginning to investigate possible mechanisms of resistance to these pathogens [8], in general, very little is known about the immune response of amphibians to EIDs. This is because most natural amphibian species are not used as laboratory models and we lack fundamental molecular tools to investigate disease pathology and host-pathogen interactions at the molecular level for all but a few species (e.g., Ambystoma tigrinum spp., Xenopus spp.).
Over the last 15 years, Ranavirus infections have been associated with marked increases in morbidity and mortality in fish, reptiles, and amphibians [9]. Ranaviruses are globally-distributed double-stranded, methylated DNA viruses of fish, amphibians and reptiles and are implicated in amphibian epizootics worldwide [9-11]. Both encapsulated and non-encapsulated forms can be infectious. The virus enters the cell via receptor mediated endocytosis or via fusion with the plasma membrane; and DNA and RNA synthesis occur in the nucleus, while protein synthesis occurs at morphologically specific assembly sites in the cytoplasm [9]. In North America, ranaviruses have been isolated from the majority of recent documented amphibian epizootics [12], including from tiger salamander (Ambystoma tigrinum) epizootics in Saskatchewan, Canada [13], Arizona [14], North Dakota, Utah, and Colorado, USA [15,16]. The viral variant that infects tiger salamanders, ATV, is transmitted either via direct contact with an infected animal or immersion in water that contains virus and infected individuals exhibit systemic hemorrhaging, edema, ulceration, and necrosis of the integument and internal organs [13,17,18]. In cases where ATV infection leads to mortality, it usually occurs within 2–3 weeks of exposure, with animals displaying symptoms often between 8–10 days post-exposure. Thus, ATV can rapidly overwhelm the tiger salamander immune response. However, mortality is not always a pathological endpoint because virulence and resistance are known to vary among ATV strains and tiger salamander populations, respectively, as indicated by both laboratory experiments and field observations [19]. Research characterizing the tiger salamander genomic response to ATV is needed to better understand the pathology, virulence, and possible mechanisms of resistance to this emerging disease.
The tiger salamander species complex includes A. mexicanum (Mexican axolotl), a model organism with a growing genomic and informatics resource base [20]. The immune system of the Mexican axolotl has been extensively studied using several classical approaches. Relative to other vertebrate models, the axolotl immune response has been described as immunodeficient [21,22]. There are several reasons for this characterization, including: production of only two immunoglobulin (Ig) classes, only one of which regulates the humoral response and neither of which is anamnestic [23,24]; no response to soluble antigens [25]; poor mixed lymphocyte reactions [26,27]; and lack of cellular cooperation during the humoral immune response as indicated by enhanced humoral immunity following thymectomy or X-ray irradiation [28,29]. Weak immune responses are known for salamanders in general, and the Mexican axolotl and related tiger salamanders are especially susceptible to ATV infections with high observed mortality rates both in the laboratory and in the field. Indeed, an outbreak of ATV in 2003 at the Indiana Axolotl Colony significantly reduced adult stocks before the virus was contained. By way of comparison, adult Xenopus effectively clear close-related FV3 Ranavirus with an immune response that includes an early T-cell proliferative phase in the spleen [30].
To further investigate the axolotl immune response to ATV, we used an Affymetrix custom microarray to identify genes that were significantly, differentially expressed in the spleen. We then compared these genes to a list of genes associated with regeneration that were previously identified from A. mexicanum using the same microarray platform. We reasoned that such a comparison would allow us to filter gene expression responses of humoral cells induced generally in response to injury and stress from those expressed specifically in response to ATV infection. Also, this comparison would potentially identify gene expression signatures associated with cell proliferation in response to ATV, as we have previously identified many cell proliferation probe sets on the Ambystoma genechip that are differentially regulated during spinal cord regeneration [31]. The genes that we describe provide mechanistic insights and new tools to investigate salamander antiviral responses in the laboratory and in natural populations.
Methods
Animal care and surgery protocols
Inbred A. mexicanum eggs from a single full-sib mating were obtained from the Ambystoma Genetic Stock Center at the University of Kentucky. Each A. mexicanum egg and larva was reared in an individual container in aquifer water treated with ReptiSafe and changed weekly. Individuals were fed brine shrimp ad libitum for the first four weeks post-hatching and blackworms (Tubifex) ad libitum thereafter. Animals were reared in an environmental chamber on a 12:12 h light:dark cycle at 20°C. At 4.5 months of age, 12 individuals were injected with 100 μl of 106 p.f.u./ml of ATV isolated from the axolotl colony and suspended in cell culture medium. This amount of virus was determined to be the minimum lethal dose via injection in previous unpublished experiments (Storfer, unpublished data) and the strain utilized in the experiment was extracted from axolotls that had previously been infected and killed by the virus. Simultaneously, four uninfected (control) individuals were sacrificed in MS222 for spleen and lung removal. Spleens from all animals were flash frozen in liquid nitrogen. The same surgical procedure was performed on four infected individuals following 24, 72 and 144 hours of infection. Spleen tissue was utilized due to its previously noted importance in CD8+ T cell immune responses to Ranaviruses, particularly FV3, in frogs [30] Additionally, spleen is an important immune organ as antigens from the blood are processed in the spleen. Lung tissue was removed for viral quantification as it is an internal organ that can be utilized in early stage virus quantification (Stewart, unpublished data).
During the infection period behavioral observations were taken opportunistically. Total RNA was extracted from spleen with TRIzol (Invitrogen) according to the manufacturer's protocol. RNA isolations were further purified using RNeasy mini columns (Qiagen). The amount of RNA present in each isolate was determined via UV spectrophotometry, and RNA quality was inspected via a 2100 Agilent Bioanalyzer. Sixteen high quality isolates (four replicates at each of four sampling times: 0 (controls), 24, 72, and 144 hours post-infection) were used to make individual-specific pools of biotin labeled cRNA probes. Each of the 16 pools was then independently hybridized to an Amby_001 custom Affymetrix GeneChip (for a more detailed description of the microarray platform see [31] and [32]). The University of Kentucky Microarray Core Facility generated cRNA probes and performed hybridizations according to standard Affymetrix protocols.
Quality Control and Data Processing
All quality control and processing analyses were done in R [33]http://www.r-project.org. We used the Bioconductor package "affy" http://www.bioconductor.org to perform several quality control analyses at the individual probe level [34,35]. These analyses included: (1) viewing images of the log(intensity) values of the probes on each GeneChip to check for spatial artifacts, (2) investigating measures of central tendency and dispersion by viewing box-plots and histograms of all the GeneChips, (3) viewing pair-wise M versus A plot matrices for replicate GeneChips, and (4) viewing an RNA degradation plot [35] that enables the visualization of the 3' labeling bias associated with all GeneChips simultaneously. Upon conducting these probe level analyses, we background corrected, normalized, and summarized all sixteen GeneChips using the Robust Multi-array Average (RMA) algorithm [36]. Following this, we calculated correlation matrices for replicate GeneChips (four correlation matrices with four GeneChips per matrix; all r from replicate GeneChips > 0.980) on the summarized probe-set level data. The strong correlations observed between replicate GeneChips suggests that we were able to obtain a high degree of repeatability within treatments.
Data Filtering
Microarrays may not accurately quantify the abundance of lowly expressed genes [37]. Calculating statistical tests for such genes adds to the multiple testing burden that is inherent to microarray studies. To address this issue, we filtered genes whose mean intensity across all 16 GeneChips was greater than the mean of the lowest quartiles (25th percentiles) across all GeneChips (n = 16, mean = 5.83, SD = 0.06; data presented on a log2 scale). Upon imposing this filtering criterion, 3619 probe-sets were available for significance testing.
Identifying Differentially Expressed Genes
We used the Bioconductor package LIMMA [38,39] to generate moderated t-statistics for all six of the possible pair-wise contrasts of the four sampling times investigated in our study. LIMMA employs an empirical Bayes methodology that effectively shrinks the sample variances towards a pooled estimate. This approach reduces the likelihood of obtaining large test statistics due to underestimation of the sample variances. The moderated t-statistics generated by LIMMA test the null hypothesis that the difference between the two groups being compared is zero (i.e., group 1 – group 2 = 0). LIMMA also generates moderated F-statistics that test the null hypothesis that none of the contrasts within a family of contrasts are statistically significant. We corrected for multiple testing by applying the step-up algorithm [40] to the P-values of the moderated F-statistics associated with our six contrasts. Upon correcting for multiple testing, we identified 2322 genes (probe-sets) that were statistically significant. To prioritize amongst differentially expressed genes, we focused on probe-sets that exhibited two-fold or greater changes at any time-point relative to controls. Any gene that was non-significantly down-regulated but significantly up-regulated at one or more time points was considered up-regulated, and vice versa for classification of up- versus down-regulation. We also required that these probe sets have moderated F-statistics greater than or equal to the 50th percentile of the 2322 F-statistics from the statistically significant probe-sets (F ≥ 12.68). We further limited our analysis to only those probe sets that exhibited significant sequence identity with a human reference sequence. We note that 263 probe-sets with no functional annotation were statistically significant, differentially expressed by ≥ two-fold, and had F-values ≥ 12.68.
Clustering
Hybridization intensities were averaged within treatment groups (0, 24, 72, and 144 hrs post-infection) and log2 ratios were calculated for each non-zero sampling time relative to 0 hours post-infection. Genesis v. 1.6.0 [41,42] was used cluster these log2 ratio data and to generate heat maps. Clustering was conducted using a Self Organizing Map (SOM) algorithm. Default conditions were used with the exception that the SOM was allowed to run for 263,000 iterations. The dimensions of the final SOM are 2x *1y. These dimensions were determined by comparing output from several different combinations.
Enrichment Analyses
Functional annotation of genes by gene ontology was performed using the Database for Annotation, Visualization and Integrated Discovery (DAVID, [43]). Functional annotation clustering was performed using the default settings with the exception of using the highest classification stringency.
Quantitative real-time PCR
We used quantitative real-time PCR (qPCR) to confirm the results of the microarrays. We estimated a fold change for 24 and 72 hr time points using the ΔΔct method of relative quantification [44], utilizing ribosomal protein L 19 as an endogenous control gene. The same total RNA that was used for microarray analysis was used to create cDNA for qPCR using the BioRad iScript cDNA synthesis kit, following manufacturer instruction. Primers for the qPCR were designed using Primer Express 2.0 (Applied Biosystems). Primers were designed to encompass the sequence of GeneChip probe sets (Additional file 1). qPCR was accomplished using SYBR Green chemistry.
To verify that exposed animals were infected and to quantify viral load and replication over time, we performed qPCR on lung tissue with TaqMan chemistry following the protocol detailed in [45]. ANOVA with a Tukey's HSD correction for all pairwise comparisons was performed to determine if viral loads were significantly different across time points.
Results
Viral load and disease pathogenesis
Viral load for each animal was estimated using qPCR and then averaged for each time point (Fig 1). The significant increase in viral load across time points indicates that animals were infected and that viral replication was occurring. ANOVA with a Tukey's correction for multiple comparisons confirmed that viral load increased linearly between 24, 72, and 144 hours post-infection, and all time points were significantly different from all other time points (F3,44 = 242.56; p ≤ 0.01).
Figure 1.
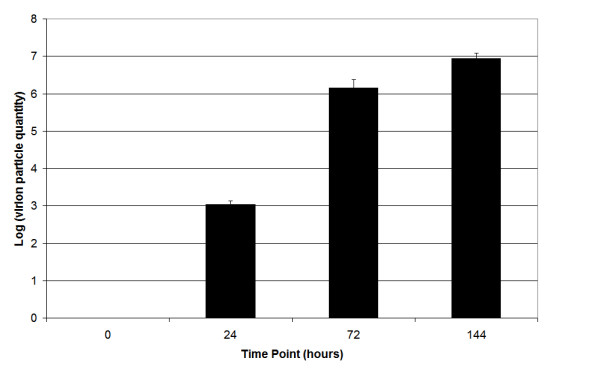
Log values of viral particles quantified with quantitative real-time PCR across all time points.
No animals displayed any gross symptoms of ATV infection in terms of hemorrhaging, lesions or edema, either externally or on any internal organs upon euthanasia and subsequent surgery. Similarly, there were no notable changes in behavior observed during the period of infection. This is likely due to the relatively short infection period utilized in this experiment. As noted in the introduction, infected animals often take 8–10 days, or more, to become symptomatic upon infection.
Gene clustering and functional annotation
We identified 263 probe sets with statistically significant differences in mRNA abundances between Day 0 and any other subsequent time point (Tables 1, 2). We assume that statistically significant probe sets correspond to genes that were differentially regulated after ATV infection. Cluster analysis of the statistically significant genes identified two groups that exhibited similar changes in mRNA abundance. After ATV infection at Day 0, 158 putative genes showed a significant increase in mRNA abundance at subsequent time points (Figure 2), while 105 transcripts showed a significant decrease (Figure 3). Thus, more genes were up-regulated than down-regulated in response to ATV infection. Overall, DAVID categorized statistically significant genes among 44 different groups that correspond to different biological processes. Eight of these groups contained more genes than would be expected by chance sampling of genes from the microarray (geometric mean p-value < 0.05); these groups were considered significantly enriched with candidate genes relative to other groups (Table 3). Four of these significant groups contain gene ontologies related to immune response and pathogen response, including innate immunity, complement activation, lysosome function, and antigen processing and presentation. The most enriched functional group contains genes primarily related to immune function and defense responses. The remaining four functional groups contain gene ontologies related to ion binding, ion transport, vitamin metabolism, and response to an unfolded protein. Many genes that were classified in broader biological process categories that are not directly immunity-related are nonetheless associated with immunity in vertebrates [e.g. [46-48]].
Table 1.
Genes which were significantly up-regulated at any time point. Numbers indicate fold change at that time point.
| Gene ID | Gene Name | 24 hr | 72 hr | 144 hr |
| immune response | ||||
| SRV_03329_at | INTERFERON-INDUCED PROTEIN WITH TETRATRICOPEPTIDE REPEATS 5 | 11.85 | 82.22 | 91.04 |
| SRV_01342_at | INTERFERON REGULATORY FACTOR 1 | 1.94 | 12.71 | 12.79 |
| SRV_01343_a_at | INTERFERON REGULATORY FACTOR 1 | 2.10 | 16.07 | 15.63 |
| SRV_13637_a_at | INTERFERON INDUCED TRANSMEMBRANE PROTEIN 3 (1–8 U) | 1.75 | 8.48 | 10.88 |
| SRV_01199_a_at | CLUSTERIN | 1.05 | 4.35 | 8.02 |
| SRV_00442_at | SOLUTE CARRIER FAMILY 11 (PROTON-COUPLED DIVALENT METAL ION TRANSPORTERS), MEMBER 1 | 1.28 | 6.17 | 5.38 |
| SRV_01303_a_at | GUANYLATE BINDING PROTEIN 1, INTERFERON-INDUCIBLE, 67 KDA | 1.10 | 2.35 | 2.49 |
| SRV_02828_at | 2'-5'-OLIGOADENYLATE SYNTHETASE 3, 100 KDA | 2.47 | 13.56 | 9.35 |
| SRV_02072_at | CATHEPSIN S | 1.54 | 5.51 | 6.43 |
| SRV_02588_a_at | LECTIN, GALACTOSIDE-BINDING, SOLUBLE, 3 BINDING PROTEIN | 4.04 | 26.37 | 24.40 |
| SRV_02586_at | LECTIN, GALACTOSIDE-BINDING, SOLUBLE, 3 BINDING PROTEIN | 3.88 | 21.30 | 18.03 |
| response to virus | ||||
| SRV_03073_at | INTERFERON-INDUCED PROTEIN 44 | 2.05 | 9.44 | 13.16 |
| SRV_01439_a_at | MYXOVIRUS (INFLUENZA VIRUS) RESISTANCE 1, INTERFERON-INDUCIBLE PROTEIN P78 (MOUSE) | 3.13 | 29.23 | 36.80 |
| SRV_01441_at | MYXOVIRUS (INFLUENZA VIRUS) RESISTANCE 1, INTERFERON-INDUCIBLE PROTEIN P78 (MOUSE) | 3.26 | 28.24 | 35.84 |
| SRV_04604_s_at | INTERFERON INDUCED WITH HELICASE C DOMAIN 1 | 6.81 | 27.34 | 24.15 |
| SRV_04604_at | INTERFERON INDUCED WITH HELICASE C DOMAIN 1 | 7.27 | 25.43 | 22.62 |
| SRV_04518_at | RIBONUCLEASE L (2',5'-OLIGOISOADENYLATE SYNTHETASE-DEPENDENT) | 3.30 | 7.38 | 8.66 |
| cell defense response | ||||
| SRV_00353_at | NEUTROPHIL CYTOSOLIC FACTOR 2 (65 KDA, CHRONIC GRANULOMATOUS DISEASE, AUTOSOMAL 2) | 1.05 | 2.07 | 1.73 |
| SRV_00264_a_at | MYELOPEROXIDASE | 1.60 | 7.60 | 4.10 |
| antigen processing and presentation | ||||
| SRV_05347_at | PROTEASOME (PROSOME, MACROPAIN) SUBUNIT, BETA TYPE, 9 (LARGE MULTIFUNCTIONAL PEPTIDASE 2) | 1.27 | 3.73 | 4.25 |
| lysosome/endosome | ||||
| SRV_02581_a_at | LYSOSOMAL-ASSOCIATED MEMBRANE PROTEIN 1 | 1.23 | 2.26 | 2.06 |
| SRV_12596_at | EH-DOMAIN CONTAINING 1 | 1.22 | 4.16 | 3.47 |
| inflammatory response | ||||
| SRV_10702_at | CYTOCHROME B-245, BETA POLYPEPTIDE (CHRONIC GRANULOMATOUS DISEASE) | 1.69 | 5.58 | 4.40 |
| SRV_00330_at | CYTOCHROME B-245, BETA POLYPEPTIDE (CHRONIC GRANULOMATOUS DISEASE) | 1.59 | 4.74 | 3.89 |
| SRV_01877_at | CHEMOKINE (C-X-C MOTIF) RECEPTOR 4 | 1.29 | 5.70 | 8.08 |
| SRV_02292_at | N-myc (and STAT) interactor | 1.15 | 2.29 | 2.29 |
| SRV_00453_a_at | TRANSFORMING GROWTH FACTOR, BETA 1 (CAMURATI-ENGELMANN DISEASE) | 1.12 | 2.19 | 2.18 |
| SRV_01617_a_at | PENTRAXIN-RELATED GENE, RAPIDLY INDUCED BY IL-1 BETA | 2.83 | 12.82 | 17.76 |
| cell cycle | ||||
| SRV_02067_at | POLO-LIKE KINASE 3 (DROSOPHILA) | 0.93 | 3.82 | 6.18 |
| SRV_11882_s_at | RAS HOMOLOG GENE FAMILY, MEMBER B | 1.18 | 2.33 | 2.40 |
| SRV_02051_at | RAS HOMOLOG GENE FAMILY, MEMBER B | 1.26 | 2.15 | 2.28 |
| SRV_02050_at | RAS HOMOLOG GENE FAMILY, MEMBER B | 1.23 | 2.51 | 2.55 |
| SRV_00154_at | EXOSTOSES (MULTIPLE) 1 | 0.90 | 2.07 | 1.90 |
| glycolysis | ||||
| SRV_01520_at | pyruvate kinase, muscle | 1.41 | 4.60 | 4.22 |
| SRV_01519_a_at | pyruvate kinase, muscle | 1.56 | 5.94 | 5.48 |
| B_s_at | ALDOLASE A, FRUCTOSE-BISPHOSPHATE | 1.22 | 3.14 | 2.96 |
| transcription | ||||
| SRV_01351_at | JUN B PROTO-ONCOGENE | 1.76 | 7.82 | 7.54 |
| SRV_01336_a_at | INHIBITOR OF DNA BINDING 3, DOMINANT NEGATIVE HELIX-LOOP-HELIX PROTEIN | 1.56 | 3.14 | 3.57 |
| SRV_02310_at | EUKARYOTIC TRANSLATION TERMINATION FACTOR 1 | 0.95 | 2.70 | 2.45 |
| SRV_03646_at | SPEN HOMOLOG, TRANSCRIPTIONAL REGULATOR (DROSOPHILA) | 1.15 | 2.22 | 2.30 |
| SRV_02571_at | HAIRY AND ENHANCER OF SPLIT 1, (DROSOPHILA) | 1.23 | 4.52 | 6.10 |
| complement | ||||
| SRV_00137_a_at | COMPLEMENT COMPONENT 3 | 1.80 | 9.79 | 13.66 |
| SRV_01145_a_at | COMPLEMENT FACTOR B | 3.46 | 18.33 | 20.05 |
| apoptosis | ||||
| SRV_02399_a_at | MATRIX METALLOPEPTIDASE 9 (GELATINASE B, 92 KDA GELATINASE, 92 KDA TYPE IV COLLAGENASE) | 2.19 | 6.79 | 8.78 |
| SRV_02516_at | HEAT SHOCK 70 KDA PROTEIN 5 (GLUCOSE-REGULATED PROTEIN, 78 KDA) | 2.70 | 10.28 | 7.60 |
| SRV_04970_a_at | CASPASE RECRUITMENT DOMAIN FAMILY, MEMBER 6 | 1.35 | 4.78 | 4.80 |
| SRV_08154_a_at | HEAT SHOCK 70 KDA PROTEIN 9B (MORTALIN-2) | 1.18 | 3.45 | 2.71 |
| SRV_04300_a_at | CYTOCHROME C, SOMATIC | 1.30 | 2.80 | 2.64 |
| SRV_02132_at | EUKARYOTIC TRANSLATION ELONGATION FACTOR 1 EPSILON 1 | 1.21 | 3.56 | 3.38 |
| SRV_01812_a_at | HEAT SHOCK PROTEIN 90 KDA BETA (GRP94), MEMBER 1 | 1.31 | 3.53 | 3.26 |
| SRV_03753_at | GROWTH ARREST AND DNA-DAMAGE-INDUCIBLE, BETA | 1.39 | 7.34 | 8.89 |
| SRV_03023_a_at | GROWTH ARREST AND DNA-DAMAGE-INDUCIBLE, GAMMA | 1.00 | 3.73 | 5.99 |
| metabolic process | ||||
| SRV_05147_a_at | SYNDECAN BINDING PROTEIN (SYNTENIN) | 1.27 | 4.78 | 4.42 |
| SRV_00332_a_at | glucose-6-phosphate dehydrogenase | 1.32 | 4.55 | 3.35 |
| SRV_00292_a_at | PHOSPHOMANNOMUTASE 2 | 1.14 | 2.61 | 2.65 |
| SRV_01737_a_at | UDP-N-ACTEYLGLUCOSAMINE PYROPHOSPHORYLASE 1 | 1.84 | 2.18 | 2.59 |
| SRV_05108_a_at | PHOSPHOSERINE AMINOTRANSFERASE 1 | 1.12 | 1.97 | 2.48 |
| C_s_at | ALDOLASE A, FRUCTOSE-BISPHOSPHATE | 1.15 | 2.42 | 2.27 |
| A_s_at | ALDOLASE A, FRUCTOSE-BISPHOSPHATE | 1.24 | 3.64 | 3.39 |
| SRV_00129_a_at | ALDOLASE B, FRUCTOSE-BISPHOSPHATE | 1.26 | 2.30 | 2.13 |
| SRV_02002_at | CARBOXYLESTERASE 1 (MONOCYTE/MACROPHAGE SERINE ESTERASE 1) | 1.28 | 3.86 | 2.38 |
| signal transduction | ||||
| SRV_02657_at | PRE-B-CELL COLONY ENHANCING FACTOR 1 | 1.61 | 7.61 | 7.01 |
| SRV_03054_at | MACROPHAGE RECEPTOR WITH COLLAGENOUS STRUCTURE | 2.17 | 8.20 | 6.82 |
| SRV_01818_at | THIOREDOXIN | 1.19 | 3.29 | 3.51 |
| SRV_01313_a_at | GRANULIN | 1.45 | 3.72 | 3.40 |
| SRV_01462_at | NUCLEAR FACTOR OF KAPPA LIGHT POLYPEPTIDE GENE ENHANCER IN B-CELLS 2 (P49/P100) | 1.59 | 3.67 | 2.77 |
| SRV_03006_a_at | IQ MOTIF CONTAINING GTPASE ACTIVATING PROTEIN 2 | 1.23 | 2.59 | 2.69 |
| SRV_01480_at | PURINERGIC RECEPTOR P2Y, G-PROTEIN COUPLED, 2 | 1.47 | 3.17 | 2.44 |
| SRV_02894_a_at | CAP, ADENYLATE CYCLASE-ASSOCIATED PROTEIN 1 (YEAST) | 1.10 | 2.09 | 1.76 |
| SRV_00844_a_at | CHLORIDE INTRACELLULAR CHANNEL 1 | 1.15 | 1.95 | 2.10 |
| membrane | ||||
| SRV_03227_at | NIDOGEN 2 (OSTEONIDOGEN) | 1.42 | 3.69 | 4.29 |
| SRV_01179_a_at | CD63 ANTIGEN (MELANOMA 1 ANTIGEN) | 1.34 | 3.82 | 3.97 |
| SRV_02687_s_at | MANNOSE-6-PHOSPHATE RECEPTOR BINDING PROTEIN 1 | 1.30 | 4.82 | 3.55 |
| SRV_04888_a_at | UDP-GLCNAC:BETAGAL BETA-1,3-N-ACETYLGLUCOSAMINYLTRANSFERASE 5 | 2.41 | 4.44 | 3.50 |
| SRV_04819_a_at | TRANSMEMBRANE PROTEIN 49 | 1.46 | 3.40 | 3.20 |
| SRV_04070_a_at | LEUCINE RICH REPEAT CONTAINING 59 | 1.22 | 2.48 | 2.78 |
| SRV_03407_at | FER-1-LIKE 3, MYOFERLIN (C. ELEGANS) | 1.22 | 2.67 | 3.81 |
| SRV_05439_at | HYPOTHETICAL PROTEIN LOC441168 | 1.40 | 3.43 | 2.79 |
| SRV_02874_a_at | BRAIN ABUNDANT, MEMBRANE ATTACHED SIGNAL PROTEIN 1 | 1.33 | 2.80 | 2.31 |
| SRV_04226_a_at | GTPASE, IMAP FAMILY MEMBER 5 | 1.13 | 2.05 | 2.02 |
| transport | ||||
| SRV_00744_a_at | ADIPOSE DIFFERENTIATION-RELATED PROTEIN | 3.49 | 12.49 | 7.34 |
| SRV_00294_s_at | PROTECTIVE PROTEIN FOR BETA-GALACTOSIDASE (GALACTOSIALIDOSIS) | 1.53 | 5.23 | 4.73 |
| SRV_02592_a_at | LYSYL OXIDASE-LIKE 1 | 1.18 | 2.81 | 4.59 |
| SRV_03991_a_at | SOLUTE CARRIER FAMILY 15, MEMBER 3 | 1.36 | 5.33 | 3.88 |
| SRV_03562_at | ERO1-LIKE (S. CEREVISIAE) | 1.00 | 2.24 | 1.77 |
| SRV_04996_at | SOLUTE CARRIER FAMILY 7 (CATIONIC AMINO ACID TRANSPORTER, Y+ SYSTEM), MEMBER 3 | 1.07 | 1.75 | 2.11 |
| SRV_01134_at | ATPASE, H+ TRANSPORTING, LYSOSOMAL 56/58 KDA, V1 SUBUNIT B2 | 1.04 | 2.17 | 1.59 |
| SRV_01220_at | CYTOCHROME C OXIDASE SUBUNIT VIB POLYPEPTIDE 1 (UBIQUITOUS) | 1.15 | 4.51 | 4.18 |
| SRV_02133_a_at | GOLGI SNAP RECEPTOR COMPLEX MEMBER 2 | 1.05 | 2.24 | 1.88 |
| extracellular region | ||||
| SRV_02948_a_at | fibulin 1 | 0.93 | 1.65 | 2.24 |
| SRV_01275_at | fibulin 1 | 0.81 | 1.54 | 2.10 |
| SRV_02965_at | TISSUE FACTOR PATHWAY INHIBITOR 2 | 3.56 | 3.04 | 2.56 |
| SRV_03142_at | ELASTIN MICROFIBRIL INTERFACER 1 | 1.11 | 3.37 | 3.73 |
| ion binding | ||||
| SRV_00713_a_at | TRANSCOBALAMIN I (VITAMIN B12 BINDING PROTEIN, R BINDER FAMILY) | 2.55 | 23.02 | 12.98 |
| SRV_02456_at | GASTRIC INTRINSIC FACTOR (VITAMIN B SYNTHESIS) | 3.36 | 20.67 | 11.63 |
| SRV_07722_at | CHROMOSOME 17 OPEN READING FRAME 27 | 0.94 | 4.46 | 4.63 |
| SRV_05460_at | tripartite motif-containing 39 | 1.58 | 3.81 | 4.07 |
| SRV_05065_at | tripartite motif-containing 17 | 1.53 | 2.86 | 3.46 |
| SRV_00371_a_at | FRUCTOSE-1,6-BISPHOSPHATASE 1 | 2.40 | 5.01 | 3.14 |
| SRV_00741_a_at | ADENOSINE DEAMINASE, RNA-SPECIFIC | 1.44 | 3.76 | 2.86 |
| SRV_00562_a_at | PROSTAGLANDIN-ENDOPEROXIDE SYNTHASE 1 (PROSTAGLANDIN G/H SYNTHASE AND CYCLOOXYGENASE) | 1.29 | 2.05 | 2.54 |
| SRV_05448_at | ATPase, Ca++ transporting, cardiac muscle, slow twitch 2 | 0.87 | 2.16 | 2.13 |
| SRV_02724_at | METHIONINE ADENOSYLTRANSFERASE II, ALPHA | 1.66 | 2.06 | 1.56 |
| SRV_00449_a_at | LATENT TRANSFORMING GROWTH FACTOR BETA BINDING PROTEIN 1 | 1.05 | 1.79 | 3.15 |
| SRV_00131_a_at | SECRETED PROTEIN, ACIDIC, CYSTEINE-RICH (OSTEONECTIN) | 1.19 | 1.99 | 2.74 |
| SRV_04896_a_at | TRANSKETOLASE (WERNICKE-KORSAKOFF SYNDROME) | 1.44 | 4.02 | 2.52 |
| SRV_02047_at | ANNEXIN A2 | 1.29 | 2.15 | 2.45 |
| SRV_01345_at | INOSITOL 1,4,5-TRIPHOSPHATE RECEPTOR, TYPE 3 | 1.19 | 2.80 | 2.35 |
| SRV_12418_at | MYOSIN, LIGHT POLYPEPTIDE 9, REGULATORY | 1.01 | 1.99 | 2.20 |
| SRV_01649_at | RETICULOCALBIN 1, EF-HAND CALCIUM BINDING DOMAIN | 1.16 | 3.01 | 2.68 |
| Protein binding/transport | ||||
| SRV_03206_at | V-SET AND IMMUNOGLOBULIN DOMAIN CONTAINING 4 | 1.90 | 13.14 | 9.17 |
| SRV_00797_a_at | SERPIN PEPTIDASE INHIBITOR, CLADE H (HEAT SHOCK PROTEIN 47), MEMBER 1, (COLLAGEN BINDING PROTEIN 1) | 1.77 | 4.67 | 4.79 |
| SRV_04964_a_at | TUBULIN, BETA 6 | 1.06 | 2.53 | 2.55 |
| SRV_03477_a_at | TRANSMEMBRANE PROTEIN 4 | 1.59 | 2.22 | 2.39 |
| SRV_02085_at | FK506 BINDING PROTEIN 1B, 12.6 KDA | 1.29 | 1.71 | 2.18 |
| SRV_02652_a_at | PROTEIN DISULFIDE ISOMERASE FAMILY A, MEMBER 6 | 1.28 | 2.16 | 1.99 |
| SRV_02814_at | DNAJ (HSP40) HOMOLOG, SUBFAMILY B, MEMBER 1 | 2.35 | 4.29 | 1.73 |
| SRV_03255_a_at | AHA1, ACTIVATOR OF HEAT SHOCK 90 KDA PROTEIN ATPASE HOMOLOG 1 (YEAST) | 1.07 | 2.14 | 1.53 |
| SRV_05534_at | HYPOTHETICAL PROTEIN MGC16212 | 1.74 | 4.05 | 3.73 |
| SRV_00840_a_at | COLD INDUCIBLE RNA BINDING PROTEIN | 1.03 | 2.46 | 3.20 |
| SRV_01147_a_at | BIGLYCAN | 0.99 | 2.01 | 2.90 |
| SRV_05461_x_at | tripartite motif-containing 39 | 1.32 | 2.53 | 2.76 |
| SRV_02070_a_at | CYSTEINE AND GLYCINE-RICH PROTEIN 1 | 1.27 | 2.22 | 2.46 |
| SRV_00257_at | KERATIN 18 | 1.12 | 1.93 | 2.44 |
| SRV_04005_at | KDEL (LYS-ASP-GLU-LEU) ENDOPLASMIC RETICULUM PROTEIN RETENTION RECEPTOR 3 | 0.90 | 2.07 | 2.06 |
| SRV_02647_a_at | ARP2 ACTIN-RELATED PROTEIN 2 HOMOLOG (YEAST) | 1.23 | 2.33 | 1.93 |
| SRV_01234_a_at | CATENIN (CADHERIN-ASSOCIATED PROTEIN), ALPHA 1, 102 KDA | 0.98 | 1.43 | 2.05 |
| SRV_01504_a_at | PHOSPHOGLUCONATE DEHYDROGENASE | 1.19 | 2.20 | 1.50 |
| SRV_05174_a_at | THREE PRIME REPAIR EXONUCLEASE 2 | 1.57 | 5.55 | 5.02 |
| protein modification | ||||
| SRV_04305_a_at | GLYCINE N-METHYLTRANSFERASE | 1.24 | 1.84 | 3.49 |
| SRV_01832_a_at | UBIQUITIN-CONJUGATING ENZYME E2L 3 | 1.04 | 2.09 | 1.99 |
| SRV_00309_at | TRANSGLUTAMINASE 1 (K POLYPEPTIDE EPIDERMAL TYPE I, PROTEIN-GLUTAMINE-GAMMA-GLUTAMYLTRANSFERASE) | 3.22 | 16.60 | 14.36 |
| SRV_02093_a_at | HEAT SHOCK 70 KDA PROTEIN 9B (MORTALIN-2) | 1.35 | 3.91 | 2.79 |
| SRV_02989_at | HEAT SHOCK 70 KDA PROTEIN 8 | 2.28 | 6.93 | 2.73 |
| SRV_01225_at | CRYSTALLIN, ALPHA B | 1.27 | 3.35 | 2.38 |
| SRV_05456_a_at | UBIQUITIN SPECIFIC PEPTIDASE 2 | 1.27 | 2.56 | 2.00 |
| SRV_05457_a_at | UBIQUITIN SPECIFIC PEPTIDASE 2 | 1.26 | 2.28 | 1.89 |
| SRV_11417_a_at | MATRIX METALLOPEPTIDASE 1 (INTERSTITIAL COLLAGENASE) | 5.26 | 13.96 | 3.65 |
| SRV_04306_at | GLYCINE N-METHYLTRANSFERASE | 1.03 | 2.15 | 4.66 |
| SRV_00327_a_at | CATHEPSIN K (PYCNODYSOSTOSIS) | 1.37 | 3.23 | 3.94 |
| cellular process | ||||
| SRV_11663_a_at | TIMP METALLOPEPTIDASE INHIBITOR 1 | 1.96 | 24.74 | 23.31 |
| SRV_04387_at | RETINOIC ACID RECEPTOR RESPONDER (TAZAROTENE INDUCED) 1 | 1.64 | 6.63 | 9.22 |
| SRV_03285_at | RELATED RAS VIRAL (R-RAS) ONCOGENE HOMOLOG 2 | 1.76 | 5.07 | 4.97 |
| SRV_04911_at | SIMILAR TO THIOREDOXIN DOMAIN-CONTAINING 2 | 1.34 | 3.15 | 3.20 |
| SRV_01534_at | PROTEIN PHOSPHATASE 1, CATALYTIC SUBUNIT, ALPHA ISOFORM | 1.15 | 2.04 | 2.18 |
| SRV_04858_at | POLY (ADP-RIBOSE) POLYMERASE FAMILY, MEMBER 9 | 0.97 | 2.36 | 2.15 |
| SRV_03421_a_at | LR8 PROTEIN | 1.31 | 1.95 | 2.02 |
| SRV_11406_at | V-YES-1 YAMAGUCHI SARCOMA VIRAL RELATED ONCOGENE HOMOLOG | 1.37 | 2.46 | 2.12 |
| other | ||||
| SRV_03887_at | DYNEIN, CYTOPLASMIC 1, LIGHT INTERMEDIATE CHAIN 1 | 1.31 | 2.42 | 2.20 |
| SRV_01920_at | poly (ADP-ribose) glycohydrolase | 1.31 | 1.95 | 2.23 |
| SRV_00155_a_at | COAGULATION FACTOR XIII, A1 POLYPEPTIDE | 1.20 | 2.46 | 2.35 |
| SRV_01367_a_at | KERATIN 8 | 1.19 | 2.90 | 3.29 |
| SRV_00775_at | ARGINASE, TYPE II | 1.44 | 4.08 | 6.06 |
| SRV_11767_a_at | INTERFERON INDUCED TRANSMEMBRANE PROTEIN 5 | 1.17 | 2.74 | 4.24 |
| SRV_07726_a_at | MACROPHAGE EXPRESSED GENE 1 | 1.69 | 4.25 | 3.18 |
| SRV_01302_at | GUANYLATE BINDING PROTEIN 4 | 1.07 | 2.39 | 2.64 |
| SRV_02761_at | ARGININE-RICH, MUTATED IN EARLY STAGE TUMORS | 1.10 | 2.17 | 1.99 |
| SRV_03758_a_at | ARRESTIN DOMAIN CONTAINING 2 | 0.90 | 5.48 | 8.72 |
Table 2.
Genes which were significantly down-regulated at any time point. Numbers indicate fold change at that time point.
| ID | NAME | 24 hr | 72 hr | 144 hr |
| transcription | ||||
| SRV_04230_at | CHROMOSOME X OPEN READING FRAME 15 | 0.73 | 0.44 | 0.50 |
| SRV_01344_a_at | INTERFERON REGULATORY FACTOR 2 | 1.02 | 0.47 | 0.50 |
| SRV_01768_a_at | TAF9 RNA POLYMERASE II, TATA BOX BINDING PROTEIN (TBP)-ASSOCIATED FACTOR, 32 KDA | 0.84 | 0.44 | 0.50 |
| SRV_03843_a_at | MEDIATOR OF RNA POLYMERASE II TRANSCRIPTION, SUBUNIT 31 HOMOLOG (YEAST) | 0.95 | 0.50 | 0.45 |
| SRV_01892_at | ZINC FINGER PROTEIN 282 | 0.98 | 0.39 | 0.42 |
| translation | ||||
| SRV_03800_a_at | MITOCHONDRIAL RIBOSOMAL PROTEIN S7 | 1.13 | 0.50 | 0.54 |
| SRV_03598_at | MITOCHONDRIAL RIBOSOMAL PROTEIN L19 | 0.73 | 0.49 | 0.53 |
| SRV_04607_at | PEPTIDE DEFORMYLASE-LIKE PROTEIN | 1.01 | 0.46 | 0.50 |
| SRV_04925_a_at | HYPOTHETICAL PROTEIN MGC11102 | 1.01 | 0.43 | 0.48 |
| SRV_01958_at | EUKARYOTIC TRANSLATION INITIATION FACTOR 4E BINDING PROTEIN 3 | 1.05 | 0.32 | 0.31 |
| Natural Killer cell mediated cytotoxicity | ||||
| AE_at | TUBULIN, BETA 2C | 0.88 | 0.52 | 0.49 |
| Apoptosis | ||||
| SRV_11815_at | CASP2 AND RIPK1 DOMAIN CONTAINING ADAPTOR WITH DEATH DOMAIN | 0.70 | 0.45 | 0.52 |
| SRV_01489_at | PRKC, APOPTOSIS, WT1, REGULATOR | 0.88 | 0.43 | 0.44 |
| ion binding/transport | ||||
| SRV_03020_at | TRAF-TYPE ZINC FINGER DOMAIN CONTAINING 1 | 0.85 | 0.49 | 0.53 |
| SRV_01742_at | SPECTRIN, ALPHA, NON-ERYTHROCYTIC 1 (ALPHA-FODRIN) | 0.82 | 0.46 | 0.52 |
| SRV_02131_a_at | PEPTIDASE (MITOCHONDRIAL PROCESSING) BETA | 0.80 | 0.48 | 0.51 |
| SRV_02733_at | MITOCHONDRIAL INTERMEDIATE PEPTIDASE | 0.59 | 0.39 | 0.40 |
| SRV_04112_at | HYPOTHETICAL PROTEIN FLJ20699 | 0.93 | 0.42 | 0.39 |
| SRV_00559_a_at | PRIMASE, POLYPEPTIDE 1, 49 KDA | 0.79 | 0.42 | 0.39 |
| SRV_03126_at | RING FINGER PROTEIN 113A | 0.95 | 0.39 | 0.39 |
| SRV_03759_at | ATP SYNTHASE, H+ TRANSPORTING, MITOCHONDRIAL F0 COMPLEX, SUBUNIT S (FACTOR B) | 0.91 | 0.30 | 0.25 |
| SRV_01177_a_at | ECTONUCLEOSIDE TRIPHOSPHATE DIPHOSPHOHYDROLASE 1 | 1.19 | 0.52 | 0.49 |
| SRV_04638_a_at | MEMBRANE-ASSOCIATED RING FINGER (C3HC4) 7 | 0.78 | 0.44 | 0.47 |
| SRV_03403_at | MAKORIN, RING FINGER PROTEIN, 1 | 1.02 | 0.55 | 0.48 |
| SRV_02137_at | GUANINE DEAMINASE | 0.93 | 0.36 | 0.36 |
| SRV_12156_at | TUMOR PROTEIN D52 | 0.93 | 0.58 | 0.45 |
| SRV_02173_at | CHONDROITIN SULFATE PROTEOGLYCAN 3 (NEUROCAN) | 1.38 | 0.57 | 0.20 |
| metabolic process | ||||
| SRV_02346_a_at | GLUTATHIONE S-TRANSFERASE OMEGA 1 | 1.04 | 0.54 | 0.47 |
| SRV_04215_at | PHOSPHOGLUCOMUTASE 2 | 1.08 | 0.57 | 0.46 |
| SRV_04397_at | NITRILASE FAMILY, MEMBER 2 | 0.86 | 0.49 | 0.46 |
| SRV_03369_at | NON-METASTATIC CELLS 7, PROTEIN EXPRESSED IN (NUCLEOSIDE-DIPHOSPHATE KINASE) | 1.00 | 0.55 | 0.43 |
| SRV_00123_at | AMINOLEVULINATE, DELTA-, DEHYDRATASE | 0.71 | 0.49 | 0.31 |
| SRV_00160_s_at | FUMARYLACETOACETATE HYDROLASE (FUMARYLACETOACETASE) | 0.83 | 0.61 | 0.49 |
| SRV_00135_at | ASPARTOACYLASE (CANAVAN DISEASE) | 0.92 | 0.30 | 0.22 |
| SRV_01499_at | 6-PHOSPHOFRUCTO-2-KINASE/FRUCTOSE-2,6-BIPHOSPHATASE 1 | 0.88 | 0.65 | 0.47 |
| SRV_11745_at | ACYL-COENZYME A OXIDASE 3, PRISTANOYL | 0.87 | 0.51 | 0.47 |
| SRV_03094_at | LIPOIC ACID SYNTHETASE | 0.83 | 0.47 | 0.47 |
| SRV_05217_a_at | SERINE DEHYDRATASE-LIKE | 1.03 | 0.52 | 0.33 |
| transport | ||||
| SRV_03906_at | HEMATOPOIETIC STEM/PROGENITOR CELLS 176 | 0.81 | 0.49 | 0.58 |
| SRV_04743_a_at | HYPOTHETICAL PROTEIN FLJ22028 | 0.98 | 0.54 | 0.50 |
| SRV_02065_a_at | ADAPTOR-RELATED PROTEIN COMPLEX 2, MU 1 SUBUNIT | 0.90 | 0.59 | 0.48 |
| SRV_03218_a_at | GABA(A) RECEPTOR-ASSOCIATED PROTEIN-LIKE 2 | 0.93 | 0.28 | 0.37 |
| SRV_05300_a_at | SFT2 DOMAIN CONTAINING 2 | 0.91 | 0.31 | 0.29 |
| SRV_05537_a_at | TRAFFICKING PROTEIN PARTICLE COMPLEX 6B | 0.95 | 0.49 | 0.34 |
| SRV_02033_a_at | SELENIUM BINDING PROTEIN 1 | 1.05 | 0.58 | 0.45 |
| protein binding/modification | ||||
| SRV_04235_at | hypothetical protein FLJ11280 | 0.68 | 0.44 | 0.56 |
| SRV_02678_a_at | M-PHASE PHOSPHOPROTEIN 6 | 0.84 | 0.45 | 0.51 |
| SRV_02198_a_at | GLUTAMYL-PROLYL-TRNA SYNTHETASE | 0.94 | 0.52 | 0.48 |
| SRV_01481_at | PHOSPHATIDYLETHANOLAMINE BINDING PROTEIN 1 | 1.05 | 0.56 | 0.49 |
| SRV_01495_at | PYRUVATE DEHYDROGENASE KINASE, ISOZYME 2 | 1.04 | 0.41 | 0.31 |
| SRV_04077_a_at | UBIQUITIN-CONJUGATING ENZYME E2R 2 | 0.78 | 0.51 | 0.47 |
| SRV_04977_s_at | CNDP DIPEPTIDASE 2 (METALLOPEPTIDASE M20 FAMILY) | 1.27 | 0.49 | 0.22 |
| SRV_04977_at | CNDP DIPEPTIDASE 2 (METALLOPEPTIDASE M20 FAMILY) | 1.20 | 0.46 | 0.22 |
| SRV_01825_at | UBIQUITIN-CONJUGATING ENZYME E2B (RAD6 HOMOLOG) | 0.90 | 0.47 | 0.51 |
| RNA binding/processing | ||||
| SRV_03823_at | RNA BINDING MOTIF PROTEIN, X-LINKED 2 | 0.80 | 0.47 | 0.54 |
| SRV_03721_at | SYF2 HOMOLOG, RNA SPLICING FACTOR (S. CEREVISIAE) | 0.96 | 0.46 | 0.49 |
| SRV_03417_at | MITOCHONDRIAL RIBOSOMAL PROTEIN S28 | 0.86 | 0.51 | 0.47 |
| SRV_03836_at | EXOSOME COMPONENT 1 | 1.03 | 0.46 | 0.46 |
| cell cycle/cell division | ||||
| SRV_05218_a_at | COILED-COIL DOMAIN CONTAINING 5 (SPINDLE ASSOCIATED) | 0.68 | 0.36 | 0.46 |
| SRV_03244_a_at | FREQUENTLY REARRANGED IN ADVANCED T-CELL LYMPHOMAS 2 | 0.89 | 0.38 | 0.46 |
| SRV_05024_at | ZW10 INTERACTOR | 0.96 | 0.41 | 0.44 |
| SRV_00804_at | CDC6 CELL DIVISION CYCLE 6 HOMOLOG (S. CEREVISIAE) | 0.70 | 0.50 | 0.42 |
| SRV_03256_at | TPX2, MICROTUBULE-ASSOCIATED, HOMOLOG (XENOPUS LAEVIS) | 0.91 | 0.41 | 0.51 |
| SRV_04156_at | CELL DIVISION CYCLE ASSOCIATED 8 | 0.71 | 0.43 | 0.50 |
| SRV_03593_at | DISCS, LARGE HOMOLOG 7 (DROSOPHILA) | 0.66 | 0.39 | 0.49 |
| SRV_14350_at | NIMA (NEVER IN MITOSIS GENE A)-RELATED KINASE 3 | 0.96 | 0.42 | 0.30 |
| SRV_02556_at | SMC4 STRUCTURAL MAINTENANCE OF CHROMOSOMES 4-LIKE 1 (YEAST) | 0.69 | 0.43 | 0.47 |
| SRV_03257_at | TPX2, MICROTUBULE-ASSOCIATED, HOMOLOG (XENOPUS LAEVIS) | 0.79 | 0.35 | 0.45 |
| SRV_02235_at | KINESIN FAMILY MEMBER 11 | 0.53 | 0.31 | 0.44 |
| SRV_01290_at | FERRITIN, HEAVY POLYPEPTIDE 1 | 1.00 | 0.54 | 0.42 |
| SRV_02151_a_at | CENTRIN, EF-HAND PROTEIN, 2 | 0.65 | 0.39 | 0.39 |
| SRV_04253_a_at | NUCLEOLAR AND SPINDLE ASSOCIATED PROTEIN 1 | 0.62 | 0.28 | 0.37 |
| SRV_05141_at | CYCLIN-DEPENDENT KINASE INHIBITOR 2C (P18, INHIBITS CDK4) | 0.85 | 0.57 | 0.37 |
| SRV_00033_copy4_at | T-cell acute lymphocytic leukemia 1 | 1.02 | 0.47 | 0.36 |
| SRV_00033_at | T-cell acute lymphocytic leukemia 1 | 0.97 | 0.44 | 0.35 |
| SRV_00033_copy2_at | T-cell acute lymphocytic leukemia 1 | 0.96 | 0.46 | 0.34 |
| SRV_00033_copy1_at | T-cell acute lymphocytic leukemia 1 | 0.96 | 0.44 | 0.33 |
| SRV_00033_copy3_at | T-cell acute lymphocytic leukemia 1 | 0.94 | 0.44 | 0.33 |
| membrane | ||||
| SRV_04260_at | CHROMOSOME 9 OPEN READING FRAME 46 | 1.05 | 0.56 | 0.47 |
| SRV_04763_at | CHROMOSOME 10 OPEN READING FRAME 57 | 1.24 | 0.46 | 0.42 |
| SRV_04650_a_at | TRANSMEMBRANE 6 SUPERFAMILY MEMBER 1 | 1.00 | 0.47 | 0.32 |
| SRV_05571_a_at | OXIDATION RESISTANCE 1 | 0.77 | 0.37 | 0.42 |
| SRV_03611_a_at | TRANSLOCASE OF OUTER MITOCHONDRIAL MEMBRANE 70 HOMOLOG A (YEAST) | 0.97 | 0.55 | 0.48 |
| kinase activity | ||||
| SRV_05333_at | RIO kinase 3 (yeast) | 1.06 | 0.47 | 0.52 |
| SRV_05450_a_at | INTEGRIN BETA 1 BINDING PROTEIN 3 | 0.87 | 0.53 | 0.46 |
| SRV_01863_at | VACCINIA RELATED KINASE 1 | 0.61 | 0.39 | 0.51 |
| pinocytosis/endocytosis | ||||
| SRV_00866_at | DISABLED HOMOLOG 2, MITOGEN-RESPONSIVE PHOSPHOPROTEIN (DROSOPHILA) | 0.84 | 0.49 | 0.43 |
| DNA damage | ||||
| SRV_04199_at | NEI ENDONUCLEASE VIII-LIKE 3 (E. COLI) | 0.75 | 0.41 | 0.37 |
| SRV_02222_at | HUS1 CHECKPOINT HOMOLOG (S. POMBE) | 0.72 | 0.45 | 0.57 |
| muscle development/contraction | ||||
| SRV_01033_a_at | INTERFERON-RELATED DEVELOPMENTAL REGULATOR 1 | 1.18 | 0.38 | 0.53 |
| SRV_05143_a_at | MYOSIN, LIGHT POLYPEPTIDE 1, ALKALI; SKELETAL, FAST | 0.79 | 0.50 | 0.49 |
| SRV_00058_s_at | tropomyosin | 0.89 | 0.53 | 0.48 |
| other | ||||
| SRV_01932_a_at | FICOLIN (COLLAGEN/FIBRINOGEN DOMAIN CONTAINING) 3 (HAKATA ANTIGEN) | 1.03 | 0.58 | 0.46 |
| SRV_05356_s_at | FAMILY WITH SEQUENCE SIMILARITY 58, MEMBER A | 0.89 | 0.46 | 0.47 |
| SRV_02972_at | GLUTAREDOXIN 5 HOMOLOG (S. CEREVISIAE) | 0.97 | 0.49 | 0.49 |
| SRV_05356_at | FAMILY WITH SEQUENCE SIMILARITY 58, MEMBER A | 1.09 | 0.58 | 0.58 |
| SRV_05263_at | SOLUTE CARRIER FAMILY 39 (ZINC TRANSPORTER), MEMBER 3 | 0.73 | 0.45 | 0.51 |
| SRV_04739_a_at | ZINC FINGER PROTEIN 403 | 0.97 | 0.49 | 0.51 |
| SRV_03830_at | SHWACHMAN-BODIAN-DIAMOND SYNDROME | 0.94 | 0.47 | 0.46 |
| SRV_03448_at | COILED-COIL DOMAIN CONTAINING 59 | 0.89 | 0.42 | 0.44 |
| SRV_02223_a_at | ISOPENTENYL-DIPHOSPHATE DELTA ISOMERASE 1 | 0.89 | 0.37 | 0.43 |
| SRV_04160_at | SDA1 DOMAIN CONTAINING 1 | 0.88 | 0.48 | 0.42 |
| SRV_05216_at | SERUM AMYLOID A-LIKE 1 | 0.82 | 0.42 | 0.42 |
| SRV_04991_a_at | MYC INDUCED NUCLEAR ANTIGEN | 0.90 | 0.41 | 0.39 |
| SRV_00134_a_at | ARGININOSUCCINATE LYASE | 1.10 | 0.44 | 0.36 |
| SRV_05376_at | WILLIAMS BEUREN SYNDROME CHROMOSOME REGION 27 | 0.84 | 0.36 | 0.31 |
Figure 2.
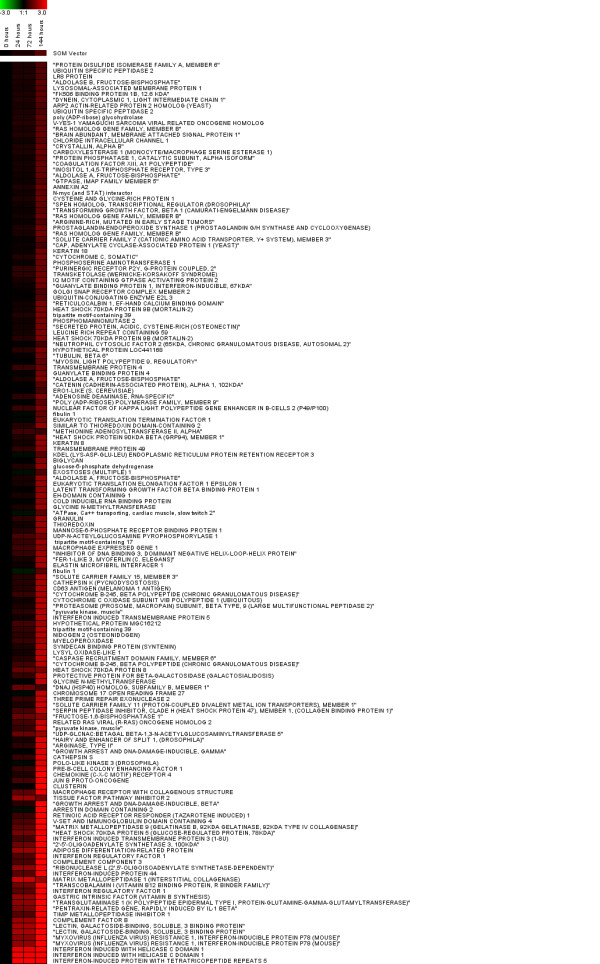
Expression profiles for cluster 1. Each row represents an individual gene, and each column a post-infection time point. Red coloration indicates increased expression of a gene relative to uninfected animals, and green indicates decreased expression. Genes (Cluster 1, n = 158) identified to be significantly up-regulated in response to ATV infection.
Figure 3.
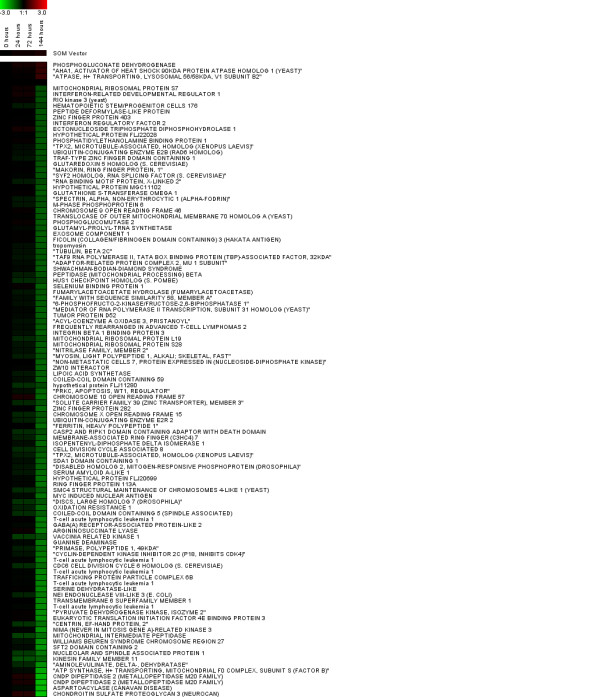
Expression profiles for cluster 2. Each row represents an individual gene, and each column a post-infection time point. Red coloration indicates increased expression of a gene relative to uninfected animals, and green indicates decreased expression. Genes (Cluster 2, n = 105) identified to be significantly down-regulated in response to ATV infection.
Table 3.
Significant (p ≤ 0.05 geometric mean p-value) functional groups obtained from functional annotation using DAVID.
| Ontology | Number of Genes | p-value | Ontology | Number of Genes | p-value | ||
| Functional Group 1 | response to biotic stimulus | 25 | <0.001 | Functional Group 5 | water-soluble vitamin metabolism | 4 | 0.02 |
| <0.001 | immune response | 21 | <0.001 | 0.033 | vitamin metabolism | 4 | 0.03 |
| defense response | 22 | <0.001 | pyridine nucleotide metabolism | 3 | 0.07 | ||
| Functional Group 2 | cation binding | 34 | 0.001 | Functional Group 6 | di-, tri-valent inorganic cation transport | 5 | 0.006 |
| 0.002 | ion binding | 36 | 0.004 | 0.042 | metal ion transport | 5 | 0.06 |
| metal ion binding | 36 | 0.004 | cation transport | 6 | 0.22 | ||
| Functional Group 3 | innate immunity | 4 | 0.001 | Functional Group 7 | bcr protein | 3 | 0.02 |
| 0.005 | immune response | 5 | 0.004 | 0.045 | molecular chaperone | 4 | 0.02 |
| innate immune response | 4 | 0.007 | Heat shock protein Hsp70 | 3 | 0.03 | ||
| complement activation | 3 | 0.02 | Heat shock protein 70 | 3 | 0.03 | ||
| antigen processing and presentation | 4 | 0.09 | |||||
| cell surface | 3 | 0.20 | |||||
| Functional Group 4 | lysosome | 7 | 0.002 | ||||
| 0.008 | lysosome | 7 | 0.009 | Functional Group 8 | response to unfolded protein | 5 | 0.02 |
| lytic vacuole | 7 | 0.009 | 0.048 | response to protein stimulus | 5 | 0.02 | |
| vacuole | 7 | 0.02 | chaperone | 6 | 0.26 |
Genes Up-regulated in Response to ATV
Across all time points, the majority of up-regulated genes were related to immune response or other related functions, such as inflammation and apoptosis. Other up-regulated genes pertained to gene functions such as ion binding and transport, membrane related functions, and protein binding and modification. Twenty-three genes (represented by 26 probe sets) demonstrated 2-fold or greater changes at 24 hours post-infection, all of which were up-regulated. Ten of these 23 have functions pertaining to immune response. Of the remaining highly expressed genes, one was associated with inflammation, two to regulation of apoptosis, three to ion binding, three to protein binding and modification, one to transport, one to the extracellular constituent, and one to membrane and glycolipids. Many of these genes showed increasing transcript abundances over time. At 72 hours post infection, 43 genes had a greater than 5-fold change, and 40 genes had a greater than 5-fold change at 144 hours. The highest expression level, 91-fold increase at 144 hours, was observed for interferon-induced protein with tetracopeptide repeats 5 (IFIT5).
Genes Down-regulated in Response to ATV
In contrast to the very high fold changes observed among up-regulated genes, the largest fold change observed among down-regulated genes was approximately 4.9-fold, in chondroitin sulfate proteoglycan (NCAN). Five down-regulated genes each code for regulation of transcription and translation. An additional 15 down-regulated genes correspond to 20 probe sets that have functions associated with cell division and mitosis, which was not observed in the up-regulated genes. Other notable down-regulated gene ontologies include one gene corresponding to pinocytosis and endocytosis, and one gene related to natural killer cell mediated cytotoxicity.
Validation of Microarray Results Using Quantitative Real-time PCR
We used qPCR to estimate fold changes for nine genes to verify our microarray data (Table 4). For five of the nine genes investigated (56%; Myxovirus resistance 1, Macrophage receptor with collagenous structure, Complement component 3, Cyclin dependant kinase inhibitor 1B, Vaccinia related kinase 1) there is good agreement between the microarray and qPCR data. In genes where the microarray estimates of fold change were modest (Serine dehydratase like, Hemoglobin gamma alpha, Glycogen synthase kinase, Programmed cell death 8) there is poorer agreement between fold change estimates from these two technologies. However, for this latter group of genes with modest fold change values, the microarray and qPCR data were always within four fold of each other. These results demonstrate that we were able to verify robust differences that were suggested by the microarray data.
Table 4.
Fold changes obtained from microarray and from quantitative real-time PCR.
| Gene name | Microarray | qPCR | ||
| 24 | 72 | 24 | 72 | |
| Myxovirus resistance 1 MX1 | 3.13 | 29.23 | 5.97 | 24.44 |
| Macrophage receptor with collagenous structure MARCO | 2.17 | 8.20 | 3.36 | 15.24 |
| Complement component 3 C3 | 1.80 | 9.79 | 2.14 | 14.78 |
| Cyclin dependant kinase inhibitor 1B CDKN1B | -1.17 | -1.74 | -2.26 | -3.16 |
| Vaccinia related kinase 1 VRK1 | -1.64 | -2.58 | -1.23 | -1.88 |
| Serine dehydratase like SDSL | 1.03 | -1.92 | -1.35 | -1.01 |
| Hemoglobin gamma alpha HBG1 | -1.01 | -1.02 | -1.54 | -1.87 |
| Glycogen synthase kinase GSK3A | -1.07 | -1.08 | -1.13 | 2.76 |
| Programmed cell death 8 PDCD8 | 1.13 | -1.10 | 1.30 | 1.85 |
Analyses to identify proliferation gene expression signatures
Comparison of gene expression after ATV and tail amputation identified 25 genes that are significantly up-regulated in both experimental frameworks (Table 5). No significantly down-regulated genes were identified in common. Several of the commonly up-regulated genes appear to be related to humoral immunity, and membrane and extracellular matrix related functions. Additionally, general stress response genes such as heat shock 70 kDa protein 5 were similarly regulated. None of the cell cycle genes that are significantly up-regulated during tail regeneration were identified in this study. Thus, there was no evidence of cell proliferation by spleen cells after ATV infection.
Table 5.
Genes expressed in both ATV infection and spinal cord injury
| Gene ID | Gene Name | Gene Ontology |
| SRV_00294_s_at | protective protein for beta-galactosidase (galactosialidosis) | proteolysis, protein transport |
| SRV_00309_at | transglutaminase 1 (K polypeptide epidermal type I, protein-glutamine-gamma-glutamyltransferase) | membrane, cell envelope, protein modification |
| SRV_00327_a_at | cathepsin K (pycnodysostosis) | proteolysis |
| SRV_00330_at | cytochrome b-245, beta polypeptide (chronic granulomatous disease) | humoral response, inflammatory response |
| SRV_00371_a_at | fructose-1,6-bisphosphatase 1 | metal ion binding (zinc) |
| SRV_00442_at | solute carrier family 11 (proton-coupled divalent metal ion transporters), member 1 | immune response, ion transport |
| SRV_00713_a_at | transcobalamin I (vitamin B12 binding protein, R binder family) | ion transport/binding (cobalt) |
| SRV_00744_a_at | adipose differentiation-related protein | fatty acid transport, extracellular region |
| SRV_01179_a_at | CD63 antigen (melanoma 1 antigen) | endosome, membrane |
| SRV_01342_at | interferon regulatory factor 1 | immune response, transcription |
| SRV_01351_at | jun B proto-oncogene | transcription |
| SRV_01818_at | thioredoxin | signal transduction |
| SRV_02399_a_at | matrix metalloproteinase 9 (gelatinase B, 92 kDa gelatinase, 92 kDa type IV collagenase) | extracellular matrix, apoptosis, proteolysis |
| SRV_02456_at | gastric intrinsic factor (vitamin B synthesis) | ion transport/binding (cobalt) |
| SRV_02516_at | heat shock 70 kDa protein 5 (glucose-regulated protein, 78 kDa) | anti-apoptosis, endoplasmic reticulum |
| SRV_02586_at | lectin, galactoside-binding, soluble, 3 binding protein | cell adhesion, cellular defense response, signal transduction |
| SRV_03054_at | macrophage receptor with collagenous structure | signal transduction |
| SRV_04604_at | interferon induced with helicase c domain 1 | innate immune response, regulation of apoptosis, response to virus |
| SRV_04819_a_at | transmembrane protein 49 | membrane, endoplasmic reticulum |
| SRV_04888_a_at | UDP-GlcNAc:betaGal beta-1,3-N-acetylglucosaminyltransferase 5 | membrane, CNS development |
| SRV_04911_at | thioredoxin domain containing 2 (spermatozoa) | cell redox homeostasis |
| SRV_04964_a_at | tubulin beta MGC4083 | nucleotide binding, protein polymerization |
| SRV_07726_a_at | macrophage expressed gene 1 | none |
| SRV_11417_a_at | matrix metalloproteinase 1 (interstitial collagenase) | proteolysis, ion binding (zinc) |
| SRV_11663_a_at | tissue inhibitor of metalloproteinase 1 (erythroid potentiating activity, collagenase inhibitor) | enzyme inhibitor, cell proliferation |
| SRV_00294_s_at | protective protein for beta-galactosidase (galactosialidosis) | proteolysis, protein transport |
Discussion and conclusion
Emerging infectious diseases are implicated in the global decline of amphibians and other animals [3,49-51]. There is urgent need to develop understanding of amphibian immunological responses to pathogens and to identify host genes that may be important in disease resistance. Our study shows that functional genomics provides a means to rapidly meet these needs. We infected Mexican axolotls from the Ambystoma Genetic Stock Center with a viral pathogen that is clearly affecting tiger salamander populations in nature [10,13-15,19]. Our results show that ATV infection induces transcriptional changes of genes that are known to function in vertebrate immunity. Below we discuss the transcriptional response in more detail and suggest hypotheses to explain why ATV is often lethal to axolotls and other tiger salamanders.
We detected significant gene expression changes 24 hours post infection. Many of these gene expression changes likely reflect transcription within lymphocytes, as they are the predominant cell type in the spleen of juvenile and adult axolotls [52]. Indeed, the functions of many of these genes are associated with neutrophil, dendritic, and macrophage cell functions, including cytokine signaling (chemokine (C-X-C motif) receptor 4), phagocytosis and destruction of phagocytised particles (disabled homolog 2, mitogen-responsive phosphoprotein, neutrophil cytosolic factor 2, lysosomal-associated membrane protein 1, RAS homolog gene family, member B), complement (complement factor B, complement component 3), and inflammation (pentraxin related gene, rapidly induced by IL-1 beta, cytochrome B-245 beta polypeptide, n-myc and STAT interactor). Up-regulation of complement components that are known to function in the removal of viral particles, and up-regulation of the stress-associated transcription factor jun-b, clearly shows that ATV induced a humoral gene expression response in the axolotl. Further support for this idea was obtained by comparing ATV-induced gene expression changes to changes identified from a previous microarray experiment using A. mexicanum and the same microarray platform. Twenty-five genes that were up-regulated in response to ATV infection were also identified as significantly up-regulated during regeneration [31]. In both microarray studies, blood was not perfused from tissues prior to tissue collection and it is known that leukocyctes express genes during the early wound-healing phase of spinal cord and limb regeneration. Thus, it seems likely that many of the early gene expression changes that we observed in response to ATV-infection reflect a general, humoral transcriptional response to stress.
In addition to this general humoral response, the gene expression patterns that we observed suggest that the Mexican axolotl manifests an antiviral transcriptional response that is not unlike that observed in other vertebrates. For example, ATV infection clearly induces an interferon-mediated, antiviral response. Although probe sets for interferon genes are not represented on the GeneChip, we estimate based upon literature surveys that at least 20% of the significant genes that we identified are known in other systems (in vitro and in vivo) to be involved in interferon-mediated transcription [53-55]. These genes exhibited some of the largest fold-changes and include two primary transcription factors that compete to activate (interferon regulatory factor 1, up-regulated) and repress (interferon regulatory factor 2, down-regulated) transcription of interferon-alpha and beta (Type 1 interferon), and inferon-inducible genes that recognize and degrade intra-cellular viral nucleic acid (interferon induced with helicase C domain 1). Considering further that four of the most highly enriched functional groups also contained genes relating to the immune response and pathogen response, the results show that axolotls mount a robust anti-viral response from 24–144 hours post-infection.
Given the robust immunological transcription response that we observed, it is curious why ATV is so virulent to tiger salamanders. In the closely related Ranavirus frog virus 3 (FV3), larval Xenopus laevis succomb to FV3 but adults effectively clear virons and develop lasting resistance to future infection [56]. Adult resistance in X. laevis is correlated with a significant proliferation of cytotoxic CD8+ T cells in the spleen upon infection (within 6 days), as well as increased mortality upon CD8+ T cell depletion [30,57]. Mortality events due to ATV are more significant among larvae in natural tiger salamander populations, however metamorphosed adult tiger salamanders are more susceptible than larvae to ATV infection in the lab [18]. It is well established that Mexican axolotls have a less complicated immune system and never develop the type of mature immune response typical of amniote vertebrates [21-29,52]. We did not observe any gene expression changes that would indicate proliferative leukocyte responses in axolotl spleen. Perhaps this is because we used juvenile axolotls that are incapable of such a response. However, it is also possible that ATV maybe more resistant to the immune response mounted by A. mexicanum than FV3 is to the Xenopus immune response. Phylogenetic analyses indicate ATV is more closely related to iridoviruses found in fish than to FV3, which suggests a relatively recent host switch occurring with the introduction of sportfish to areas of the southwestern United States [15]. Iridoviruses found in sportfish have a larger genome and contain more ORFs related to immune evasion than FV3, which could also be related to improved performance of this virus on the salamander host [15]. Further studies are needed to better understand the ontogeny of immunological responses in axolotls, the virulence of different ranaviruses, and the role of innate versus adaptive immunity in ATV infection.
Our study has identified hundreds of new candidate genes for laboratory and field studies of stress and disease in tiger salamanders. Significantly more gene candidates will undoubtedly be discovered using a higher content, 2nd generation microarray that is currently under development. Genomic and bioinformatics tools make Ambystoma a powerful system for wildlife disease research. In particular, molecular information can be quickly cross-referenced from a genetically homogeneous strain that is available for laboratory studies (Mexican axolotl), to other closely related tiger salamander species in North America [20]. Such power is needed to quickly understand how ATV and other pathogens are overwhelming amphibian immune responses and causing population declines in nature.
Competing interests
The authors declare that they have no competing interests.
Authors' contributions
JDC performed infections and surgeries and drafted the manuscript. RBP performed microarray statistical and bioinformatic analyses. AS, CKB, and SRV contributed to experimental design and manuscript editing.
Supplementary Material
Appendix A. Primer sequences used for qPCR verification of microarray data.
Acknowledgments
Acknowledgements
We acknowledge funding to SRV from NSF (DBI0443496) and NCRR-NIH-CM (R24RR16344), to AS from NSF DEB-0548145 and to CKB from NCRR-NIH-INBRE (P20RR016741). We acknowledge J. Kerby for help with animal care and surgeries, J. Eastman for statistical assistance, J. Monaghan and J. Smith for assistance with analyses and real time PCR, and J. Walker for molecular assistance.
Contributor Information
Jennifer D Cotter, Email: jdstewart@wsu.edu.
Andrew Storfer, Email: astorfer@wsu.edu.
Robert B Page, Email: robert.page@uky.edu.
Christopher K Beachy, Email: christopher.beachy@minotstateu.edu.
S Randal Voss, Email: srvoss@uky.edu.
References
- Berns DS, Rager B. Emerging infectious diseases: a cause for concern. Isr Med Assoc J. 2000;2:919–923. [PubMed] [Google Scholar]
- Rachowicz LJ, Hero JM, Alford RA, Taylor JW, Morgan JAT, Vredenburg VT, Collins JP, Briggs CJ. The novel and endemic pathogen hypotheses: competing explanations for the origin of emerging infectious diseases of wildlife. Conserv Biol. 2005;19:1441–1448. [Google Scholar]
- Daszak P, Cunningham AA, Hyatt AD. Emerging infectious diseases of wildlife: threats to biodiversity and human health. Science. 2000;287:443–449. doi: 10.1126/science.287.5452.443. [DOI] [PubMed] [Google Scholar]
- Hudson P, Rizzoli JA, Grenfell BT, Heesterbeek H, Dobson AP. The ecology of wildlife diseases. Oxford, United Kingdom: Oxford University Press; 2000. [Google Scholar]
- Scherbik SV, Kluetzman K, Perelygin AA, Brinton MA. Knock-in of the Oas1b(r) allele into a flavivirus-induced disease susceptible mouse generates the resistant phenotype. Virology. 2007;368:232–237. doi: 10.1016/j.virol.2007.08.017. [DOI] [PubMed] [Google Scholar]
- Glass EJ, Jensen K. Resistance and susceptibility to a protozoan parasite of cattle – Gene expression differences in macrophages from different breeds of cattle. Vet Immunol Immunopathol. 2007;120:20–30. doi: 10.1016/j.vetimm.2007.07.013. [DOI] [PubMed] [Google Scholar]
- Tumpey TM, Szretter KJ, Van Hoeven N, Katz JM, Kochs G, Haller O, Garcia-Sastre A, Staeheli P. The Mx1 gene protects mice against the pandemic 1918 and highly lethal human H5N1 influenza viruses. J Virol. 81:10818–10821. doi: 10.1128/JVI.01116-07. [DOI] [PMC free article] [PubMed] [Google Scholar]
- Woodhams DC, Voyles J, Lips KR, Carey C, Rollins-Smith LA. Predicted disease susceptibility in a panamanian amphibian assemblage based on skin peptide defenses. J Wildl Dis. 2006;42:207–218. doi: 10.7589/0090-3558-42.2.207. [DOI] [PubMed] [Google Scholar]
- Chinchar VG. Ranaviruses (family Iridoviridae): emerging cold-blooded killers. Arch Virol. 2002;147:447–470. doi: 10.1007/s007050200000. [DOI] [PubMed] [Google Scholar]
- Collins JP, Jones TR, Berna HJ. Conserving genetically distinctive populations: the case of the Huachuca tiger salamander (Ambystoma tigrinum stebbinsi Lowe) In: Szaso RL, Stevenson KC, Patton DR, editor. Management of amphibians, reptiles and small mammals in North America. US Department of Agriculture/Forest Service General Technical Report RM-166, Rocky Mountain Forest and Range Experiment Station, Fort Collins, CO; 1988. pp. 45–53. [Google Scholar]
- Cunningham AA, Langton TES, Bennett PM, Lewin JF, Drury SEN, Gough RE, Macgregor Pathological and microbiological findings from incidents of unusual mortality of the common frog (Rana temporaria) Philos Trans R Soc Lond B Biol Sci. 1996;351:1539–1557. doi: 10.1098/rstb.1996.0140. [DOI] [PubMed] [Google Scholar]
- Green DE, Converse KA, Schrader AK. Epizootiology of sixty-four amphibian morbidity and mortality events in the USA, 1996–2001. Ann NY Acad Sci. 2002;969:323–339. doi: 10.1111/j.1749-6632.2002.tb04400.x. [DOI] [PubMed] [Google Scholar]
- Bollinger TK, Mao J, Schock D, Brigham RM, Chinchar VG. Pathology, isolation and preliminary molecular characterization of a novel iridovirus from tiger salamanders in Saskatchewan. J Wildl Dis. 1999;35:413–429. doi: 10.7589/0090-3558-35.3.413. [DOI] [PubMed] [Google Scholar]
- Jancovich JK, Davidson EW, Morado JF, Jacobs BL, Collins JP. Isolation of a lethal virus from the endangered tiger salamander Ambystoma tigrinum stebbinsi. Dis Aquat Organ. 1997;31:161–167. [Google Scholar]
- Jancovich JK, Davidson EW, Parameswaran N, Mao J, Chinchar VG, Collins JP, Jacobs BL, Storfer A. Evidence for emergence of an amphibian iridoviral disease because of human-enhanced spread. Mol Ecol. 2005;14:213–224. doi: 10.1111/j.1365-294X.2004.02387.x. [DOI] [PubMed] [Google Scholar]
- Docherty DE, Meteyer CU, Wang J, Mao JH, Case ST, Chinchar VG. Diagnostic and molecular evaluation of three iridovirus-associated salamander mortality events. J Wildl Dis. 2003;39:556–566. doi: 10.7589/0090-3558-39.3.556. [DOI] [PubMed] [Google Scholar]
- Jancovich JK, Davidson EW, Seiler A, Jacobs BL, Collins JP. Transmission of the Ambystoma tigrinum virus to alternate hosts. Dis Aquat Organ. 2001;46:159–163. doi: 10.3354/dao046159. [DOI] [PubMed] [Google Scholar]
- Brunner JL, Richards K, Collins JP. Dose and host characteristics influence virulence of ranavirus infections. Oecologia. 2005;144:399–406. doi: 10.1007/s00442-005-0093-5. [DOI] [PubMed] [Google Scholar]
- Storfer A, Alfaro ME, Ridenhour BJ, Jancovich JK, Mech SG, Parris MJ, Collins JP. Phylogenetic concordance analysis shows an emerging pathogen is novel and endemic. Ecol Lett. 2007;10:1075–1083. doi: 10.1111/j.1461-0248.2007.01102.x. [DOI] [PubMed] [Google Scholar]
- Putta S, Smith JJ, Walker JA, Rondet M, Weisrock DW, Monaghan J, Samuels AK, Kump K, King DC, Maness NJ, Habermann B, Tanaka E, Bryant SV, Gardiner DM, Parichy DM, Voss SR. From biomedicine to natural history research: EST resources for Ambystomatid salamanders. BMC Genomics. 2004;5:54. doi: 10.1186/1471-2164-5-54. [DOI] [PMC free article] [PubMed] [Google Scholar]
- Kaufman J, Voik H, Wallny HJ. A "minimal essential MHC" and an "unrecognized MHC"; two extremes in selection for polymorphism. Immunol Rev. 1995;143:63–88. doi: 10.1111/j.1600-065x.1995.tb00670.x. [DOI] [PubMed] [Google Scholar]
- Tournefier A, Laurens V, Chapusot C, Ducoroy P, Padros MR, Salvadori F, Sammut B. Structure of MHC class I and class II cDNAs and possible immunodeficiency linked to class II expression in the Mexican axolotl. Immunol Rev. 1998;166:259–277. doi: 10.1111/j.1600-065x.1998.tb01268.x. [DOI] [PubMed] [Google Scholar]
- Fellah JS, Charlemagne J. Characterizations of an IgY-like low molecular weight immunoglobulin class in the Mexican axolotl. Mol Immunol. 1998;25:1377–1386. doi: 10.1016/0161-5890(88)90054-5. [DOI] [PubMed] [Google Scholar]
- Tournefier A, Fellah S, Charlemagne J. Monoclonal antibodies to axolotl immunoglobulins specific for different heavy chains isotypes expressed by independent lymphocyte subpopulations. Immunol Lett. 1988;18:145–148. doi: 10.1016/0165-2478(88)90055-7. [DOI] [PubMed] [Google Scholar]
- Charlemagne J, Tournefier A. Anti-horse red blood cells antibody synthesis in the Mexican axolotl (Ambystoma mexicanum) In: salomon JB, Horton JD, editor. Developmental Immunology. North Holland: Elsevier; 1977. pp. 267–275. [Google Scholar]
- Kaufman J, Ferrone S, Flajnik M, Kilb M, Volk H, Parisot R. MHC-like molecules in some non mammalian vertebrates can be detected by some cross-reactive monoclonal antibodies. J Immunol. 1990;144:2273–2280. [PubMed] [Google Scholar]
- Koniski AD, Cohen N. Reproducible proliferative responses of salamander (Ambystoma mexicanum) lymphocytes cultured with mitogens in serum-free medium. Dev Comp Immunol. 1992;16:441–451. doi: 10.1016/0145-305x(92)90028-b. [DOI] [PubMed] [Google Scholar]
- Charlemagne J. Thymus independent antihorse erythrocyte antibody response and suppressor T cells in the Mexican axolotl (Amphibia. Urodela, Ambystoma mexicanum) Immunology. 1979;36:643–648. [PMC free article] [PubMed] [Google Scholar]
- Charlemagne J. Regulation of antibody synthesis in the X-irradiated Mexican axolotl. Eur J Immunol. 1981;11:717–721. doi: 10.1002/eji.1830110909. [DOI] [PubMed] [Google Scholar]
- Morales HD, J Robert. Characterization of primary and memory T cell responses against Ranavirus (FV3) in Xenopus laevis. J Virol. 2007;81:2240–2248. doi: 10.1128/JVI.01104-06. [DOI] [PMC free article] [PubMed] [Google Scholar]
- Monaghan JR, Walker JA, Page RB, Putta S, Beachy CK, Voss SR. Early gene expression during natural spinal cord regeneration in the salamander Ambystoma mexicanum. J Neurochem. 2007;101:27–40. doi: 10.1111/j.1471-4159.2006.04344.x. [DOI] [PubMed] [Google Scholar]
- Page RB, Monaghan JR, Samuels AK, Smith JJ, Beachy CK, Voss SR. Microarray analysis identifies keratin loci as sensitive biomarkers for thyroid hormone disruption in the salamander Ambystoma mexicanum. Comp Biochem Physiol C Toxicol Pharmacol. 2007;145:15–27. doi: 10.1016/j.cbpc.2006.06.003. [DOI] [PubMed] [Google Scholar]
- Ihaka R, Gentleman R. R: A language for data analysis and graphics. J Comp Graph Stat. 1996;5:299–314. [Google Scholar]
- Bolstad BM, Irizarry RA, Gautier L, Wu Z. Preprocessing high density oligonucleotide assays. In: Gentleman R, Huber W, Irizarry R, Dudoit S, editor. Bioinformatics and Computational Biology Solutions using R and Bioconductor. 2005. pp. 13–16. [Google Scholar]
- Bolstad B, Collin F, Brettschneider J, Simpson K, Cope L, Irizarry RA, Speed TP. Quality assessment of Affymetrix GeneChip data. In: Gentleman R, Huber W, Irizarry R, Dudoit S, editor. Bioinformatics and Computational Biology Solutions Using R and Bioconductor. New York: Springer; 2005. pp. 33–47.http://www.bioconductor.org [Google Scholar]
- Irizarry RA, Hobbs B, Collin F, Beazer-Barclay YD, Antonellis KJ, Scherf U, Speed TP. Exploration, normalization and summaries of high density oligonucleotide array probe level data. Biostatistics. 2003;4:249–264. doi: 10.1093/biostatistics/4.2.249. [DOI] [PubMed] [Google Scholar]
- Draghici S, Khatri P, Eklund AC, Szallasi Z. Reliability and reproducibility issues in DNA microarray measurements. Trends Genet. 2006;22:101–109. doi: 10.1016/j.tig.2005.12.005. [DOI] [PMC free article] [PubMed] [Google Scholar]
- Smyth GK. Linear models and empirical Bayes methods for assessing differential expression in microarray experiments. Stat Appl Genet Mol Biol. 2004;3:Article 3. doi: 10.2202/1544-6115.1027. [DOI] [PubMed] [Google Scholar]
- Smyth GK. Limma: linear models for microarray data. In: Gentleman R, Carey V, Dudoit S, Irizarry R, Huber W, editor. Bioinformatics and Computational Biology Solutions using R and Bioconductor. New York: Springer; 2005. pp. 397–420. [Google Scholar]
- Benjamini Y, Hochberg Y. Controlling the false discovery rate: a practical and powerful approach to multiple testing. J Roy Stat Soc B Met. 1995;57:289–300. [Google Scholar]
- Sturn A, Quackenbush J, Trajanoski Z. Genesis: cluster analysis of microarray data. Bioinformatics. 2002;18:207–208. doi: 10.1093/bioinformatics/18.1.207. [DOI] [PubMed] [Google Scholar]
- Sturn A. Masters Thesis. Institute for Biomedical Engineering, Graz University of Technology, Graz, Austria; 2000. Cluster analysis for large scale gene expression studies. [Google Scholar]
- Dennis G, Jr, Sherman BT, Hosack DA, Yang J, Gao W, Lane HC, Lempicki RA. DAVID: Database for Annotation, Visualization and Integrated Discovery. Genome Biol. 2003;4:P3. [PubMed] [Google Scholar]
- Livak KJ, Schmittgen TD. Analysis of relative gene expression data using real-time quantitative PCR and the 2(-Delta Delta C(T)) method. Methods. 2001;25:402–408. doi: 10.1006/meth.2001.1262. [DOI] [PubMed] [Google Scholar]
- Forson DD, Storfer A. Atrazine increases Ranavirus susceptibility in the Tiger Salamander, Ambystoma tigrinum. Ecol Appl. 2006;16:2325–2332. doi: 10.1890/1051-0761(2006)016[2325:airsit]2.0.co;2. [DOI] [PubMed] [Google Scholar]
- Hefti HP, Frese M, Landis H, Di Paolo C, Aguzzi A, Haller O, Pavlovic J. Human MxA protein protects mice lacking a functional alpha/beta interferon system against La crosse virus and other lethal viral infections. J Virol. 1999;73:6984–6991. doi: 10.1128/jvi.73.8.6984-6991.1999. [DOI] [PMC free article] [PubMed] [Google Scholar]
- Laan LJW van der, Kangas M, Dopp EA, Broug-Holub E, Elomaa O, Tryggvason K, Kraal G. Macrophage scavenger receptor MARCO: in vitro and in vivo regulation and involvement in the anti-bacterial host defense. Immunol Lett. 1997;57:203–208. doi: 10.1016/s0165-2478(97)00077-1. [DOI] [PubMed] [Google Scholar]
- Grassadonia A, Tinari N, Fiorentino B, Suzuki K, Nakazato M, De Tursi M, Giuliani C, Napolitano G, Singer DS, Iacobelli S, Kohn LD. The 90 k protein increases major histocompatibility complex class I expression and is regulated by hormones, gamma-interferon, and double-strand polynucleotides. Endocrinology. 2004;145:4728–4736. doi: 10.1210/en.2004-0506. [DOI] [PubMed] [Google Scholar]
- Stuart SN, Chanson JS, Cox NA, Young BE, Rodrigues ASL, Fischman DL, Waller RW. Status and trends of amphibian declines and extinctions worldwide. Science. 2004;306:1783–1786. doi: 10.1126/science.1103538. [DOI] [PubMed] [Google Scholar]
- Daszak P, Cunningham AA, Hyatt AD. Infectious disease and amphibian declines. Divers Distrib. 2003;9:141–150. [Google Scholar]
- Williams ES, Yuill T, Artois M, Fisher J, SA Haigh. Emerging infectious diseases in wildlife. Rev Sci Tech OIE. 2002;21:139–157. doi: 10.20506/rst.21.1.1327. [DOI] [PubMed] [Google Scholar]
- Charlemagne J, Tournefier A. Immunology of amphibians. In: Pastoret P-P, Griebel P, Bazin H, Govaerts A, editor. Handbook of vertebrate immunology. Academic Press, San Diego; 1998. pp. 63–72. [Google Scholar]
- Hossain H, Tchatalbachev S, Chakraborty T. Host gene expression profiling in host-pathogen interactions. Curr Opin Immunol. 2006;18:422–429. doi: 10.1016/j.coi.2006.05.018. [DOI] [PubMed] [Google Scholar]
- Manger ID, Relman DA. How the host 'sees' pathogens: global gene expression responses to infection. Curr Opin Immunol. 2000;12:215–218. doi: 10.1016/s0952-7915(99)00077-1. [DOI] [PubMed] [Google Scholar]
- Jenner RG, Young RA. Insights into host responses against pathogens from transcriptional profiling. Nat Rev Microbiol. 2005;3:281–294. doi: 10.1038/nrmicro1126. [DOI] [PubMed] [Google Scholar]
- Maniero GD, Morales H, Gantress J, Robert J. Generation of a long-lasting, protective and neutralizing antibody response to the ranavirus FV3 by Xenopus. Dev Comp Immunol. 2006;30:649–657. doi: 10.1016/j.dci.2005.09.007. [DOI] [PubMed] [Google Scholar]
- Robert J, Morales H, Buck W, Cohen N, Marr S, Gantress J. Adaptive immunity and histopathology in frog virus 3-infected Xenopus. Virology. 2005;332:667–675. doi: 10.1016/j.virol.2004.12.012. [DOI] [PubMed] [Google Scholar]
Associated Data
This section collects any data citations, data availability statements, or supplementary materials included in this article.
Supplementary Materials
Appendix A. Primer sequences used for qPCR verification of microarray data.