

Abstract
Background
New technology allows more precise definition of structural alterations of all retinal layers although it has not been used previously in cases of optic disc drusen.
Methods
Using Stratus and Fourier domain (FD) optical coherence tomography (OCT) and adaptive optics (AO) through a flood-illuminated fundus camera, we studied the retinas of a patient with long-standing optic disc drusen and acute visual loss at high altitude attributed to ischemic optic neuropathy.
Results
Stratus OCT and FD-OCT confirmed severe thinning of the retinal nerve fiber layer (RNFL). FD-OCT revealed disturbances in the photoreceptor layer heretofore not described in optic disc drusen patients. AO confirmed the FD-OCT findings in the photoreceptor layer and also showed reduced cone density at retinal locations associated with reduced visual sensitivity.
Conclusions
Based on this study, changes occur not only in the RNFL but also in the photoreceptor layer in optic nerve drusen complicated by ischemic optic neuropathy. This is the first reported application of FD-OCT and the AO to this condition. Such new imaging technology may in the future allow monitoring of disease progression more precisely and accurately.
Optic nerve drusen are calcified prelaminar concretions that are visible at the disc surface or buried beneath it (1,2). A range of visual field defects is associated with optic nerve drusen (3–5). As drusen enlarge, the optic disc tends to become pale and the surrounding nerve fiber layer becomes thin. Nerve fiber loss has been demonstrated histologically and by optical coherence tomography (OCT) (6–8).
This report describes a case of presumed ischemic optic neuropathy causing vision loss in an unusually young man with optic nerve drusen, in which high-resolution Fourier domain (FD)-OCT and adaptive optics (AO) through a flood-illuminated fundus camera were used 36 years after loss of vision to evaluate the retina at resolutions that could not have been achieved with conventional imaging instruments. This is the first report of the use of this new technology to study optic nerve drusen complicated by ischemic optic neuropathy.
Methods and Results
Clinical Features
A previously healthy 19-year-old man awoke while camping at over 11,000 feet elevation in September 1969 with sudden painless loss of vision in both eyes and severely constricted visual fields with the right eye most constricted. The day before losing vision eyes he felt somewhat sick with flu-like symptoms, did a fair amount of hiking and backpacking, and was dehydrated. He had been smoking 5–10 cigarettes daily. His blood pressure had been in the low 100s (systolic) and mid-60s (diastolic) for many years. There was no history of trauma, eye pain, glaucoma, double vision, headache, vertigo, dysarthria, tremor, paralysis, or loss of sensation. The patient did not have diabetes mellitus, hypertension, or other cardiovascular disease.
On neuro-ophthalmic examination in October 1969, visual acuity was 20/20 in both eyes with a low myopic correction. Visual field testing showed preservation of 10 degrees of central field in both eyes, surrounded by a ring scotoma interspersed with patchy islands of intact peripheral field. The pupils, extraocular motility, and cranial nerves were normal, and there was no afferent pupillary defect. Dilated ophthalmoscopic examination showed marked drusen in both optic nerves, with diffuse elevation of the optic nerve. There were no other fundus abnormalities. Results of general medical and neurologic examinations performed were normal. Results of standard laboratory testing, pneumoencephalography, electroencephalography, and spinal fluid examination were unremarkable.
Although the patient's severe visual field loss was thought to be related to his optic nerve drusen, the etiology of the sudden new visual loss was unclear to investigators, in part due to the lack of published reports in 1969 of drusen associated with sudden vision loss.
Neuro-ophthalmic examination by the University of California Davis Neuro-Ophthalmology service in March 2005, when the patient was 54 years old, revealed best-corrected visual acuities of 20/15 and 20/15 in both eyes. Visual fields were constricted when measured by kinetic or automated static perimetry but expanded appropriately on confrontation testing. Color vision testing showed correct responses on 4/6 American Optical Hardy-Rand-Rittler pseudoisochromatic plates with the right eye and 6/6 plates with the left eye. The pupils, extraocular motility, cranial nerves, stereoacuity, exophthalmometry, and slit lamp examination were normal. Intraocular pressures were 11 mm Hg in the right eye and 13 mm Hg in the left eye. The dilated fundus examination showed optic nerve drusen in both eyes with severe loss of the nerve fiber layer (Fig. 1) and a normal macula.
FIG. 1.
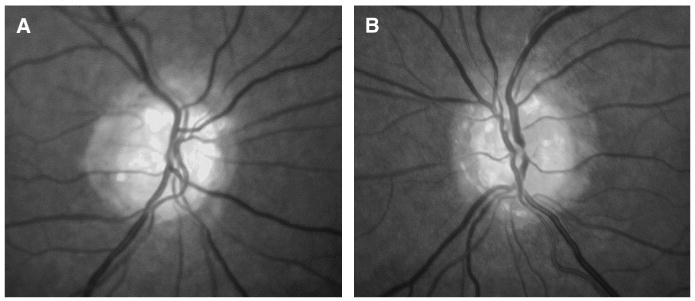
Fundus photographs performed in 2005 show optic nerve drusen. (A) right eye, (B) left eye.
Ancillary Studies: Electroretinography (ERG)
A conventional Ganzfeld electroretinogram (ERG) obtained in 2005 showed normal amplitude and latency in both eyes under photopic, scotopic, and flicker conditions. Visual field tests have been performed on several occasions since 1984 and have shown consistency and no change. Multifocal visual evoked potentials in 2005 demonstrated the same pattern of visual field loss (Fig. 2).
FIG. 2.

Visual fields performed in 1984, 1990, and 2005 show marked constriction but stability. Kinetic Goldmann visual fields performed in 1984 (A, F) and 2005 (C, H). Humphrey visual field grayscale and total deviation plots using stimulus size III/white performed in 1990 (B, G) and 2005 (D, I). Multifocal visual evoked potential (MfVEP) amplitude deviation plots obtained in 2005 for the right eye (E) and left eye (J).
Ancillary Studies: Optial Coherence Tomography (OCT)
The patient's retinal nerve fiber layer was evaluated in 2005 with Stratus OCT images (Fig. 3) and with FD-OCT (9,10) constructed at University of California, Davis. Because of its high acquisition speed (20–40 times faster than Stratus OCT) and the broad spectral bandwidth of the light source used for imaging, FD-OCT allows volumetric imaging of retinal structures at 3 times higher axial resolution than does Stratus OCT (FD-OCT provides ∼4.5 μm; Stratus OCT provides ≥10 μm) (11). Three-dimensional (3D) images of the retina (6 mm × 6 mm × 2 mm) were acquired in about 11 seconds (12). All images were taken with the pupil dilated, and a bite bar and forehead rest were used to minimize head movement. FD-OCT 6 mm B-scans of the patient's right and left optic nerve heads acquired with this system are shown (Fig. 4), along with the FD-OCT B-scans of normal optic nerves from an age-matched and two younger subjects (aged 32 and 38 years) for direct comparison.
FIG. 3.

Stratus optical coherence tomography (OCT) 6 mm line B-scans performed in 2005 through the center of the optic nerve.
FIG. 4.

High-resolution Fourier domain optical coherence tomography (FD-OCT) B-scans through the center of the optic nerve in an age-matched left eye (A), the patient's right eye (B), and the patient's left eye (C). The retinal nerve fiber layer (RNFL) is indicated (arrow). The photoreceptor layer is highlighted with a dashed-line box (– – –) at the nasal aspect and a solid-line box (——) at the temporal aspect of the optic nerve. The photoreceptor layer in A has three distinct lines corresponding to the retinal pigment epithelium (RPE) (arrow 1), Verhoeff's membrane (arrow 2), and the inner and outer photoreceptor segment junction IS/OS (arrow 3). Altered photoreceptor layers are shown in B–C, each with two broad bands corresponding to the RPE (arrow 1) and indistinct Verhoeff's membrane and IS/OS (arrow 2). N, nasal; T, temporal.
Scans were made through the center of the optic nerve in all cases. The OCT scans of the normal eye showed a normal optic nerve, RNFL, and photoreceptor layers (Fig. 4A, boxes). There were three distinct lines corresponding to the retinal pigment epithelial layer (RPE), Verhoeff's membrane, and the junction between the inner and outer photoreceptor segments (Fig. 4A, arrows). We tentatively identified Verhoeff's membrane as a distinctive band visible between the photoreceptor inner and outer segment junction and the RPE (13,14), a change in refractive index likely to derive from the area where the cone outer segments are enveloped by the apical processes of the RPE (15). Similar outer retinal layers in FD-OCT images of normal retina have previously been described in FD-OCT systems built in research laboratories (9,16-18).
The OCT scans of the patient's eyes showed prominent drusen inside the optic nerve, almost no RNFL in the nasal retina, relatively thinned RNFL in the temporal retina, and an altered photoreceptor layer. That is, there were two broad bands rather than three distinct lines (arrows) in both the nasal and temporal retina (Fig. 4B–C, boxes). The photoreceptor layer at the temporal aspect of the patient's left optic nerve appeared to be healthier, showing more defined layers.
Ancillary Studies: Adaptive Optics (AO)
To investigate the integrity of cone photoreceptors in more detail, an adaptive optics (AO) flood-illuminated fundus camera was used to image the cone photoreceptor mosaic in vivo. This system, described in detail elsewhere (19), provides lateral resolution of 2.5 μm and makes it possible to resolve individual cone photoreceptors in living eyes. The eye's aberrations were measured and corrected by a Hartmann-Shack wavefront sensor and a deformable mirror (Itek, 109 actuators), respectively. The imaging wavelength of 650 ± 40 nm was used to acquire images of 1 degree field of view. Cone density was then measured using a custom program (20) and compared with typical cone photoreceptor histology (21). All images were taken with the pupil dilated, and a bite bar and forehead rest were used to stabilize the head. AO en-face images from two retinal locations in the right eye are shown in Figure 5 as an example. The retina at 2° nasal 2° superior represents a location with normal retinal sensitivity by Humphrey visual field (HVF) testing, whereas 6° temporal 6° superior retina represents an area of scotoma on HVF testing (Fig. 5A). The cone mosaic at 2° nasal 2° superior retina (Fig. 5B) was densely packed with a cone density measured at 87% of expected value from histology (which is within the standard deviation of normal cone density at the corresponding retinal location). However, the cone mosaic at 6° temporal 6° superior retina contained areas of dark space and had a reduced cone density measured at 56% of expected indicating altered and/or missing cone photoreceptors at this location (19,22).
FIG. 5.

A. Humphrey visual field 10-2 protocol of our patient's right eye. B–C. Adaptive optics (AO) en-face images of cone photoreceptors of our patient's right eye. In A, 1 indicates where AO image in B (cone density : 87%) was taken; 2 indicates where AO image in C (cone density : 56%) was taken.
Discussion
Our patient presented with sudden and severe loss of peripheral vision with preservation of central vision and visual acuity. The diagnosis of optic nerve drusen was made because of the characteristic finding of refractile deposits at the optic disc. However, the acute vision loss was not adequately explained by the drusen
We suppose that the acute visual loss was caused by drusen with the addition of strenuous physical activity at an altitude of more than 11,000 feet, dehydration, a flu-like syndrome, nocturnal hypotension, smoking, and a history of low blood pressure, which combined to produce nonarteritic anterior ischemic optic neuropathy (NAION) in both eyes. The optic disc swelling of NAION was not observed on neuro-ophthalmic examination because too much time had elapsed (23). We had the opportunity to evaluate this patient with advanced imaging techniques 35 years after the NAION to see if there had been structural changes in the retina and optic nerve after this long time interval.
Our high-resolution FD-OCT system (24) confirmed the Stratus OCT findings of RNFL thinning and disclosed thinning of the photoreceptor layer not previously described (arrows in Fig 4). The RNFL is clearly present in the temporal retina, but it appears thin compared with normal RNFL at this location. The thicker temporal retina and relatively preserved papillomacular bundle most likely explain the patient's good visual acuity. The altered appearance of the photoreceptor layer on FD-OCT results from inability to distinguish the inner and outer photoreceptor segment junction from Verhoeff's membrane and blurring in the photoreceptor outer segment layer, creating the appearance of two broad bands in our patient's eyes (Fig. 4B–C, arrows) rather than three distinct layers in the normal eyes (Fig. 4A, arrows). The observation of three distinct layers in the outer retina has been also documented by other groups (Fig. 4A) (9,16–18). These photoreceptor changes cannot be seen with Stratus OCT.
The AO en-face images demonstrated altered and/or missing cone photoreceptors at areas of vision loss (Fig. 5). The cone mosaic from an area of more intact retina shows densely packed cones with normal cone density, whereas the cone mosaic from an area of scotoma shows some dark spaces with cone density reduced nearly by half. Our imaging indicates that such changes in cone photoreceptors occur in conjunction with expected changes at the inner retina in optic nerve drusen. Further investigation is necessary to better characterize these dark spaces in the cone mosaic. From these images, one cannot differentiate a loss of cones from changes in structural integrity, such as swelling or shortening of the outer segment of cones, which may decrease cone reflectivity and produce similar findings.
Acknowledgments
We thank Mingtao T. Zhao, Bradley A. Bower, and Joseph A. Izatt from the Department of Biomedical Engineering at Duke University for assistance in FD-OCT development and Bioptigen Inc. (Durham, NC) for providing real-time FD-OCT data acquisition software.
The study was supported by the National Eye Institute (grant 014743), an unrestricted grant from Research to Prevent Blindness (RPB), and an RPB Jules and Doris Stein Professorship.
References
- 1.Auw-Haedrich C, Staubach F, Witschel H. Optic disk drusen. Surv Ophthalmol. 2002;47:515–32. doi: 10.1016/s0039-6257(02)00357-0. [DOI] [PubMed] [Google Scholar]
- 2.Brodsky MC. Congenital anomalies of the optic disc. In: Miller NR, Newman NJ, Biousse V, et al., editors. Walsh and Hoyt's Clinical Neuro-Ophthalmology. 6th. Philadelphia: Lippincott Williams & Wilkins; 2005. pp. 151–95. [Google Scholar]
- 3.Lansche RK, Rucker CW. Progression of defects in visual fields produced by hyaline bodies in optic discs. AMA Arch Ophthalmol. 1957;58:115–21. doi: 10.1001/archopht.1957.00940010127011. [DOI] [PubMed] [Google Scholar]
- 4.Savino PJ, Glaser JS, Rosenberg MA. A clinical analysis of pseudopapilledema. II Visual field defects. Arch Ophthalmol. 1979;97:71–5. doi: 10.1001/archopht.1979.01020010011002. [DOI] [PubMed] [Google Scholar]
- 5.Mustonen E. Pseudopapilledema with and without verified optic disc drusen: a clinical analysis II: visual fields. Acta Ophthalmol. 1983;61:1057–66. doi: 10.1111/j.1755-3768.1983.tb01493.x. [DOI] [PubMed] [Google Scholar]
- 6.Schuman JS, Pedut-Kloizman T, Hertzmark E, et al. Reproducibility of nerve fiber layer thickness measurements using optical coherence tomography. Ophthalmology. 1996;103:1889–98. doi: 10.1016/s0161-6420(96)30410-7. [DOI] [PMC free article] [PubMed] [Google Scholar]
- 7.Roh S, Noecker RJ, Schuman JS, et al. Effect of optic nerve head drusen on nerve fiber layer thickness. Ophthalmology. 1998;105:878–85. doi: 10.1016/S0161-6420(98)95031-X. [DOI] [PMC free article] [PubMed] [Google Scholar]
- 8.Katz BJ, Pomeranz HD. Visual field defects and retinal nerve fiber layer defects in eyes with buried optic nerve drusen. Am J Ophthalmol. 2006;141:248–53. doi: 10.1016/j.ajo.2005.09.029. [DOI] [PubMed] [Google Scholar]
- 9.Wojtkowski M, Srinivasan V, Fujimoto JG, et al. Three-dimensional retinal imaging with high-speed ultrahigh-resolution optical coherence tomography. Ophthalmology. 2005;112:1734–46. doi: 10.1016/j.ophtha.2005.05.023. [DOI] [PMC free article] [PubMed] [Google Scholar]
- 10.Nassif N, Cense B, Park BH, et al. In vivo human retinal imaging by ultrahigh-speed spectral domain optical coherence tomography. Opt Lett. 2004;29:480–2. doi: 10.1364/ol.29.000480. [DOI] [PubMed] [Google Scholar]
- 11.Pierre-Kahn V, Tadayoni R, Haouchine B, et al. Comparison of optical coherence tomography models OCT1 and Stratus OCT for macular retinal thickness measurement. Br J Ophthalmol. 2005;89:1581–5. doi: 10.1136/bjo.2005.069815. [DOI] [PMC free article] [PubMed] [Google Scholar]
- 12.Zawadzki RJ, Fuller AR, Zhao M, et al. 3D OCT imaging in clinical settings: toward quantitative measurements of retinal structures. Proc Soc Photo Opt Instrum. 2006;6138:8–18. [Google Scholar]
- 13.Zawadzki RJ, Jones SM, Olivier SS, et al. Adaptive-optics optical coherence tomography for high-resolution and high-speed 3D retinal in vivo imaging. Opt Express. 2005;13:8532–46. doi: 10.1364/opex.13.008532. [DOI] [PMC free article] [PubMed] [Google Scholar]
- 14.Rodieck RW. The Vertebrate Retina: Principles of Structure and Function. San Francisco: WH Freeman; 1973. [Google Scholar]
- 15.Anderson DH, Fisher SK, Steinberg RH. Mammalian cones: disc shedding, phagocytosis, and renewal. Invest Ophthalmol Vis Sci. 1978;17:117–33. [PubMed] [Google Scholar]
- 16.Mujat M, Chan RC, Cense B, et al. Retinal nerve fiber layer thickness map determined from optical coherence tomography images. Opt Express. 2005;13:9480–91. doi: 10.1364/opex.13.009480. [DOI] [PubMed] [Google Scholar]
- 17.Nassif NA, Cense B, Park BH, et al. In vivo high-resolution video-rate spectral-domain optical coherence tomography of the human retina and optic nerve. Opt Express. 2004;12:367–76. doi: 10.1364/opex.12.000367. [DOI] [PubMed] [Google Scholar]
- 18.Wojtkowski M, Srinivasan VJ, Ko TH, et al. Ultrahigh-resolution, high-speed, Fourier domain optical coherence tomography and methods for dispersion compensation. Opt Express. 2004;12:2404–22. doi: 10.1364/opex.12.002404. [DOI] [PubMed] [Google Scholar]
- 19.Choi SS, Doble N, Hardy JL, et al. In vivo imaging of the photoreceptor mosaic in retinal dystrophies and correlations with visual function. Invest Ophthalmol Vis Sci. 2006;47:2080–92. doi: 10.1167/iovs.05-0997. [DOI] [PMC free article] [PubMed] [Google Scholar]
- 20.Xue B, Choi SS, Doble N, et al. Photoreceptor counting and montaging of en-face retinal images from an adaptive optics fundus camera. J Opt Soc Am A Opt Image Sci Vis. 2007;24:1364–72. doi: 10.1364/josaa.24.001364. [DOI] [PMC free article] [PubMed] [Google Scholar]
- 21.Curcio CA, Sloan KR, Kalina RE, et al. Human photoreceptor topography. J Comp Neurol. 1990;292:497–523. doi: 10.1002/cne.902920402. [DOI] [PubMed] [Google Scholar]
- 22.Wolfing JI, Chung M, Carroll J, Roorda A, et al. High resolution retinal imaging of cone rod dystrophy. Ophthalmology. 2006;113:1014–9. doi: 10.1016/j.ophtha.2006.01.056. [DOI] [PubMed] [Google Scholar]
- 23.Arnold AC. Ischemic optic neuropathy. In: Miller NR, Newman NJ, Biousse V, et al., editors. Walsh and Hoyt's Clinical Neuro-Ophthalmology. 6th. Philadelphia: Lippincott Williams & Wilkins; 2005. pp. 349–84. [Google Scholar]
- 24.Alam S, Zawadzki RJ, Choi SS, et al. Clinical application of rapid serial Fourier-domain optical coherence tomography for macular imaging. Ophthalmology. 2006;113:1425–31. doi: 10.1016/j.ophtha.2006.03.020. [DOI] [PMC free article] [PubMed] [Google Scholar]