

Abstract
A fundamental question about human perception is how the speech perceiving brain combines auditory and visual phonetic stimulus information. We assumed that perceivers learn the normal relationship between acoustic and optical signals. We hypothesized that when the normal relationship is perturbed by mismatching the acoustic and optical signals, cortical areas responsible for audiovisual stimulus integration respond as a function of the magnitude of the mismatch. To test this hypothesis, in a previous study, we developed quantitative measures of acoustic-optical speech stimulus incongruity that correlate with perceptual measures. In the current study, we presented low incongruity (LI, matched), medium incongruity (MI, moderately mismatched), and high incongruity (HI, highly mismatched) audiovisual nonsense syllable stimuli during fMRI scanning. Perceptual responses differed as a function of the incongruity level, and BOLD measures were found to vary regionally and quantitatively with perceptual and quantitative incongruity levels. Each increase in level of incongruity resulted in an increase in overall levels of cortical activity and in additional activations. However, the only cortical region that demonstrated differential sensitivity to the three stimulus incongruity levels (HI > MI > LI) was a subarea of the left supramarginal gyrus (SMG). The left SMG might support a fine-grained analysis of the relationship between audiovisual phonetic input in comparison with stored knowledge, as hypothesized here. The methods here show that quantitative manipulation of stimulus incongruity is a new and powerful tool for disclosing the system that processes audiovisual speech stimuli.
1. Introduction
1.1. Audiovisual phonetic perception
A fundamental question about human perception is how the speech perceiving brain combines auditory and visual phonetic stimulus information. Phonetic information comprises the physical stimulus cues used to discriminate and identify the phonemes (consonants and vowel segments) and prosody of a spoken language. That the speech perceiving brain has learned and uses relationships between acoustic and optical phonetic cues is demonstrated by perceptual gains with audiovisual speech, such as enhanced word identification in acoustic noise (Sumby and Pollack, 1954) and under conditions of hearing loss (Lamoré et al., 1998; Moody-Antonio et al., 2005). Perceivers are sensitive to subtle alterations that distort the natural acoustic-optical cue relationships (e.g., Green and Kuhl, 1989; Green and Kuhl, 1991), as well as to gross phoneme mismatches (McGurk and MacDonald, 1976). Physiological (EEG and MEG) and fMRI studies have demonstrated neural effects associated with presentation of normal (matched) versus artificial (mismatched) pairings of acoustic and optical speech signals (Bernstein et al., 2008; Miller and d’Esposito, 2005; Mottonen et al., 2002; Ojanen et al., 2005; Pekkola et al., 2006).
In the perceptual domain, mismatched audiovisual speech stimuli produce several types of effects, including, fusion, combination, audio correct, and video correct percepts. Perceptual fusion (the McGurk effect) (McGurk and MacDonald, 1976) occurs, for example, when a visual “ga” and an auditory “ba” stimulus are presented together, and perceivers report hearing “da,” a different syllable. That is, fusion results in a percept different from the auditory and visual stimuli. A combination effect occurs when both of the consonants are perceived sequentially. For example, pairing auditory /gi/ with a visual /bi/ might can result in the perceived combination “bgi” (Green and Norrix, 1997). Mismatched stimuli can also result in audio correct and video correct responses. Different types of percepts can occur with different recordings of the same audiovisual stimulus combinations. Variations in perceptual effects and underlying neural processes might be predicted to be related to physical stimulus properties (cf., Skipper et al., 2007b). The goal of the current study was to link, within one experiment, results on (1) physical acoustic-optical phonetic signal relationships for audiovisual speech stimuli, (2) the perceptual responses to those stimuli, and (3) the neural activations that support their perception.
1.2. Acoustic-optical speech stimulus relationships
Only recently have natural acoustic-optical phonetic signal relationships been quantified, demonstrating that acoustic and optical signals are normally highly predictive of each other (Barker and Berthommier, 1999; Jiang et al., 2002; Sugamura and Itakura, 1986; Yehia et al., 1998). The levels of signal correspondence are not necessarily surprising, considering that both types of speech signals are produced by the same biomechanical speech production activities.
Jiang et al. (2005; in preparation) investigated how quantified acoustic-optical signal relationships for matched and mismatched audiovisual nonsense syllables are related to perceptual identification of the same syllables. Their results showed that physical acoustic-optical measures of incongruity can account for perceptual effects. Because the stimuli in the current study were selected on the basis of the Jiang-et-al. results and extracted from their previous study, several details of their study are described here (see Methods and Appendix for additional details).
In the Jiang-et-al. study (2005; in preparation), ten participants identified 384 matched and mismatched audiovisual nonsense syllable tokens that were the result of combining audio syllables /bA/ or /lA/ and video syllables /bA, dA, gA, vA, zA, lA, wA/ or /ΔA/, spoken by four talkers, and represented by two tokens of each combination (within talkers). Ten participants identified each of the stimuli ten times in an open set perceptual identification paradigm. The participants were instructed to report what they heard following each audiovisual stimulus.
Jiang et al. used acoustic (i.e., line spectral pairs), optical (i.e., 3-dimensional movements of optical markers), and magnetometry (i.e., jaw, lip, and tongue movements) signals to compute several different measures of acoustic-optical relationships (see Methods). Because there was no a priori basis for defining the dimensions of the physical measurement structure, exploratory factor analysis (Kim and Mueller, 1985) was used. Factor analysis resulted in three underlying dimensions, scales, that accounted for 75% of the variance in the physical signal data structure.
In order to show that the obtained factor scales are perceptually relevant, the individual stimulus factor scale component values (i.e., the x, y, and z, components for the stimuli in factor space) were correlated with proportions of fusion, combination, audio only, and visual only responses for each of the 384 stimuli in the study. The results in Table 1 show the correlations for the stimuli and responses in the current study (see Results), which were obtained following the methods in the Jiang-et-al. study (2005; in preparation). These correlations essentially replicate those from the Jiang-et-al. study. The correlations in the table show that the physical scales capture reliable proportions of the variance in perceptual effects with matched and mismatched audiovisual nonsense syllables.
Table 1.
Correlations between factor components on the three factor scales and the proportions of response types for the stimuli in the current study. Perceptual results were obtained from open set identification following scanning.
| Perceptual Response Categories
|
||||
|---|---|---|---|---|
| Factors | Combination | Visual Correct | Audio Correct | Fusion |
| - | ||||
| Correspondence | −0.07 | −0.17** | 0.51** | 0.40** |
| Consonant identity | −0.38** | 0.36** | −0.48** | 0.51** |
| Mutual information | −0.15** | −0.14* | 0.14** | 0.05 |
Correlation is significant at the 0.01 level (2-tailed).
Correlation is significant at the 0.05 level (2-tailed).
1.3. Neural activity as a function of quantified incongruity
For the current study, we hypothesized that differences in scaled acoustic-optical signal relationships, associated with differences in perceptual effects, would be associated with quantitative regional differences in neural responses measured using the BOLD (blood oxygenation level-dependent) response of fMRI. Our stimuli were selected to define three acoustic-optical and perceptual incongruity levels, while using the same audio stimuli in an fMRI block design. Low incongruity (LI) stimuli comprised matched audiovisual stimuli for which perceptual responses were almost exclusively correct. These stimuli resided in a distinct and compact region of signal factor space (see Figure 1). Medium incongruity (MI) stimuli comprised moderate dissimilarity between the presented acoustic stimulus and the acoustic stimulus that had been recorded with the presented video. MI stimuli had produced relatively large numbers of fusion responses in the Jiang-et-al. study. These stimuli also resided in a distinct region of factor space (see Figure 1). High incongruity (HI) stimuli comprised high dissimilarity between the presented acoustic stimulus and the acoustic stimulus that had been recorded with the presented video. They occupied a distinct region of factor space, and they resulted in many audio correct percepts. The mismatch was such that perceivers frequently reported having detected it.
Figure 1.
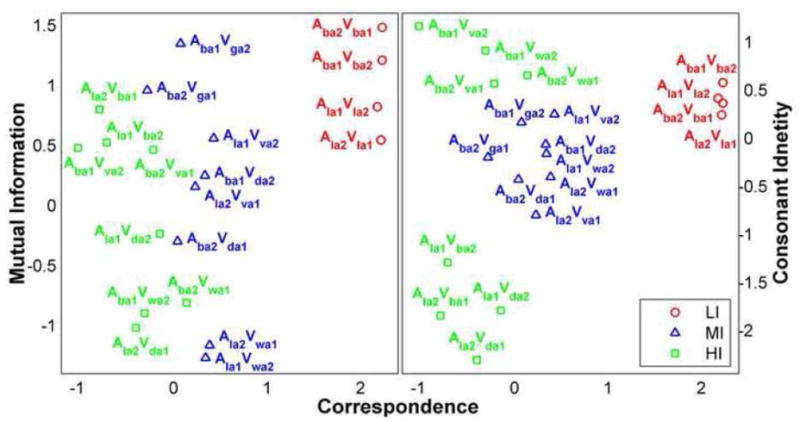
Stimuli in the factor space used to generate the stimulus conditions. Low incongruity (LI) matched stimuli with two different tokens of AbAVbA and AlAVlA are shown in red. Medium incongruity (MI), moderately mismatched stimuli, with two different tokens each of AbAVdA, AlAVvA, AbAVgA, and AlAVwA are shown in blue. High incongruity (HI), highly mismatched, stimuli with two different tokens each of AbAVvA, AlAVbA, AbAVwA, and AlAVdA are shown in green.
The current study sought evidence for differential cortical activations in relationship to both quantified acoustic-optical relationships and perceptual effects. Of particular interest were activations in the superior temporal sulcus (STS), Broca’s area (pars opercularis—po, and pars triangularis-pt), and the supramarginal gyrus (SMG), areas that have been implicated previously in the integration of audiovisual speech stimuli (Bernstein et al., 2008; Callan et al., 2003; Calvert et al., 2000; Jones and Callan, 2003; Miller and d’Esposito, 2005; Ojanen et al., 2005; Pekkola et al., 2006; Skipper et al., 2007b; Szycik et al., 2007; Wright et al., 2003).
2. Results
2.1. Perceptual testing
Figure 2 shows post-scanning perceptual identification responses to the stimuli that were presented in the scanner. The figure shows that LI (matched) stimuli were mostly correctly identified. MI (moderately mismatched) stimuli produced the largest number of fusion responses but also produced responses in the other three categories. HI (highly mismatched) stimuli produced responses in all categories also, but fewer in the fusion category and a high proportion in the audio correct category. These results from perceptual testing suggest that the different conditions presented during scanning were associated with qualitative perceptual differences. Also, these results suggest that perception varied across defined incongruity levels, while holding the auditory stimuli the same.
Figure 2.
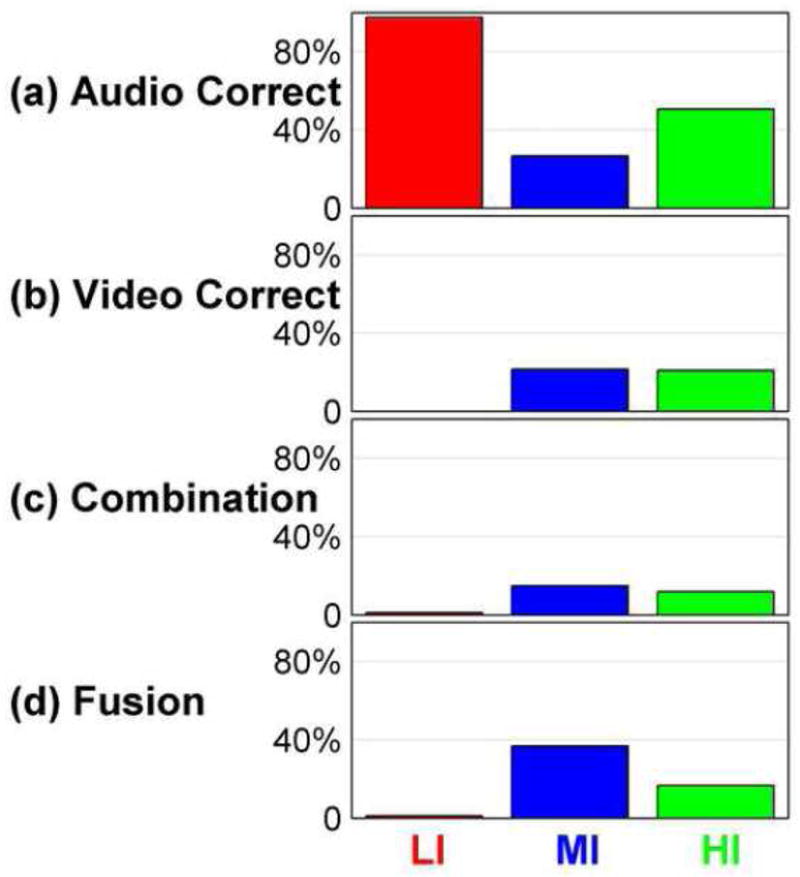
The number (y-axis) of (a) audio correct, (b) video correct, (c) combination, and (d) fusion responses in the three incongruity levels for the stimuli in the scanning sessions. Results are pooled across the participants.
Table 1 shows the relationship between the distribution of perceptual response categories and stimulus factor component scores (Figure 1), without regard for the LI, MI, and HI designations. The correlations in Table 1 are very close in magnitude to those obtained in the Jiang-et-al. study (2005; in preparation), in which many more responses were collected. The correspondence factor in Table 1 represents measures of distance between acoustic and optical signals. High correspondence resulted in large numbers of audio correct responses. Low correspondence resulted in large numbers of fusion responses. The consonant identity factor represents measures of the acoustic-optical duration ratio and the Euclidean distance between the line spectral pairs in the presented acoustic signal versus the one recorded with the presented video stimulus. The audio /l/ was arbitrarily on the negative end of the consonant identity scale. Combination and audio correct responses were correlated with audio /l/, and fusion and video correct were correlated with audio /b/. The mutual information factor represents the information shared across signals. Mutual information was less strongly related to perceptual effects. Low mutual information was modestly correlated with combination and visual correct responses, and high mutual information was modestly correlated with audio correct responses. Overall, the correlations suggest that the component scores based on physical stimulus measures are perceptually relevant.
During scanning, the participants were required to detect a single /zA/ stimulus in each stimulus block. The task was designed to be invariant across stimulus conditions and require active participation during scanning. One participant’s responses were lost due to a computer failure, but detection rate for the /zA/ stimulus was virtually error-free among the other participants, with only one /zA/ undetected at the end of one run.
2.2. Whole-head BOLD activation for stimulus conditions versus rest
At the first level of statistical analysis of the functional images, a random-effects GLM was used to extract the BOLD activation levels for each stimulus condition in each hemisphere. An FDR of 0.05 across both hemispheres was applied to each stimulus condition contrasted with rest (Figure 3).
Figure 3.

Whole head analyses for each stimulus condition versus rest, that is, LI-rest, MI–rest, and HI–rest. The threshold significance level was the false discover rate (FDR) of 0.05. The cluster size threshold was 15 for visualization in the figure.
The union of all voxels with positive suprathreshold t-values was used as a mask to extract the activity in each of the three conditions and the two hemispheres. A univariate ANOVA with Bonferroni corrections (p < 0.001) showed that at the first and most general level of analysis, the whole head level of suprathreshold BOLD response increased as a function of incongruity level. The right hemisphere was significantly more active than the left hemisphere. There was also a significant interaction between hemisphere and incongruity level, which notably involved greater differences across conditions in the left hemisphere. Figure 3 shows that the left hemisphere activation pattern increased in extent with increased incongruity.
Regional activity decreases were also obtained (see Figure 3). These varied somewhat in relationship to each of the stimulus conditions. These regional decreases could represent attenuation of ongoing activity during stimulus processing (Raichle and Mintun, 2006; Raichle and Snyder, 2007). But they were unlikely to have been related to the detection task, which did not vary across incongruity levels. All activity decreases were removed from consideration in the subsequent comparisons across stimulus conditions.
2.3. Conjunction analyses
At the second level of analysis, logical conjunction (Nichols et al., 2005) was computed among the three stimulus conditions, each versus rest, in order to show all of the areas that were active independent of the condition (Figure 4A). An overall significance level was based on the false discovery rate (FDR) of 0.05. Activity was subsequently visualized with the cluster size threshold set at 15.
Figure 4.

(4A) Conjunction analyses. Three contrasts were tested, each versus rest. Overall significance was set at FDR = 0.05, and the cluster size was 15. (4B) Comparisons across conditions. Each of the conditions was compared with the others on a per-voxel basis. An uncorrected p-value was 0.02, and a cluster size threshold of 15 was used for the figure.
Common bilateral activity was observed in the visual cortex, the superior temporal gyrus (STG), the superior temporal sulcus (STS), the middle temporal gyrus (MTG), and the primary auditory cortex (PAC). Areas with lateralized activity were the right middle precentral gyrus (preCG), the right pars opercularis/pars triangularis (po/pt), the right cingulate gyrus (CingG), the left inferior precentral gyrus (preCG), the left postcentral gyrus (postCG), and the left supramarginal gyrus (SMG). These areas were, thus, reliably activated by audiovisual speech stimuli, independent of the incongruity level.
2.4. Condition Contrasts
In order to determine differences in activation in relation to incongruity levels, a mask that preserved only the significant positive activations from the second-level analyses was applied on a per-voxel basis to comparisons among Beta values for the contrasts MI>LI, HI>LI, and HI>MI, and the reversed directions. An uncorrected p-value of 0.02 was used, and activity was subsequently visualized with the cluster size threshold set at 15 for the suprathreshold voxels. The p-value was uncorrected, because the comparisons were applied only to those voxels that survived the first-level threshold. Table 1 lists all the significant contrasts (also see Figure 4B). None of the reversed direction contrasts (i.e., LI > MI, LI > HI, and MI > HI) resulted in significant activations. The direction of all the significant differences (i.e., MI > LI, HI > LI, and HI > MI) was consistent with the scales computed for the stimuli (see Figure 1).
In general, the most extreme incongruity difference across conditions, HI > LI, produced the largest areas of significant left hemisphere activity differences, in the po/pt, the preCG/preCS, the SMG, the plT, and the temporal cortex (STG, STS, MTG). The less extreme condition difference of MI > LI produced significant left hemisphere activity differences that were in the temporal cortex (STG, STS, MTG) and the SMG. Only the left SMG was significantly differentially activated for the relationship, HI > MI > LI. Additional areas of significant HI > MI activity on the left were in preCG and SFG.
Thus, the left STS was shown to be differentially activated to both of the mismatched conditions versus matched but not differentially active when the two mismatched conditions were compared to each other directly. Broca’s area was differentially activated for the HI > LI contrast but not any other contrasts. The left SMG was differentially activated, in the direction of increased activity as a function of incongruity, to all the condition contrasts.
On the right, the most extreme incongruity difference across conditions, HI > LI, produced the largest areas of significant activity differences, which were in the po/pt, the planum temporale (plT), inferior postcentral gyrus (postCG), and the temporal cortex (STG, STS, MTG). The less extreme incongruity contrast, MI > LI, produced significant right hemisphere activity in the STG and the lingual gyrus (LingG). Only the right preCG/preCS produced a small contrast difference for HI > MI.
Participants used their left thumb to detect the /zA/ stimulus in each conditions. Therefore, the differential activations in the motor cortices cannot be explained by the button press response.
3. Discussion
We presupposed that a speech perceiving brain has learned naturally-occurring relationships between acoustic and optical phonetic stimulus information; and we hypothesized that when the normal relationship between acoustic and optical speech signals is perturbed by mismatching them in the stimuli, the speech perceiving brain registers the incongruity levels of the mismatched stimuli, not just the gross contrast between match and mismatch. In order to test this hypothesis, the incongruity level of acoustic-optical speech stimuli had to be quantified and systematically manipulated.
We were able to vary quantitatively acoustic-optical incongruity level while holding the audio stimuli the same across blocks during fMRI scanning. We chose stimuli from three physical incongruity levels that were also associated with different distributions of qualitative perceptual effects (Jiang et al., 2005; in preparation), and we obtained quantitatively and qualitatively different cortical activities across the three defined levels of incongruity. We also tested the participants on open set perceptual identification after scanning to confirm that their perception varied across the three scanning conditions. The perceptual results showed that the LI stimuli were almost exclusively perceived correctly in terms of their audiovisual identities. The MI stimuli resulted in the largest number of fusion (McGurk-type) responses. The HI stimuli produced a large proportion of auditory correct responses, in addition to other response types.
Therefore, the component scores of the stimuli, based on the quantitative scales derived from factor analysis, were shown to correlate with perceptual responses to those stimuli and to be associated with quantitative and regional differences in cortical activities. Future studies will be needed, as discussed below, to refine understanding of the quantitative acoustic-optical scales in relationship to neural and perceptual measures. In particular, event-related fMRI, MEG, and EEG designs can be used to study neural responses to individual audiovisual stimuli.
3.1. Audiovisual phonetic integration
Nonsense syllable stimuli were used in this study because of our focus on the integration of audiovisual phonetic information. Frequently, neuroimaging studies of audiovisual speech have used word, sentence, or text stimuli (Callan et al., 2003; Calvert et al., 1999; Calvert et al., 2000; Skipper et al., 2007b; Szycik et al., 2007; Wright et al., 2003). A problem with using stimuli comprising spoken words for research on phonetic processing is that words activate cortical areas responsible for many functions, including word recognition, semantic interpretation, and syntax (particularly, when the words are in connected speech). In addition, word intelligibility—that is, ease of word recognition—varies across unisensory versus multisensory conditions (Sumby and Pollack, 1954), and intelligibility affects cortical activity levels (Scott et al., 2000). Generally then, when stimuli comprise words, multisensory phonetic factors are confounded with other psycholinguistic factors. Here, due to our focus on phonetic processing, our results are discussed in relationship to other studies that also used nonsense syllables.
Left posterior STS has been hypothesized to be a primary audiovisual speech integration site (Calvert et al., 2000; Campbell, 2007). But results have been inconsistent concerning STS activation (Campbell, 2007). One explanation for the inconsistencies is the use of statistical analyses with different criteria (Beauchamp, 2005) (see below). But even with similar methods, results on the STS have not been consistent. For example, Jones and Callan (2003) using a stimulus-onset-asynchrony manipulation did not obtain STS activation related to integration. Miller and d’Esposito (2005), in a study that also used stimulus onset asynchrony did obtain STS activation.
In the current study, bilateral STS was activated for all levels of incongruity (see Figure 3). Right STS was differentially active in the contrast between HI and LI only (see Figure 4B). Left STS was differentially active to both HI and MI versus LI. But the contrast between HI versus MI did not achieve statistical significance. A limitation in the power of the experimental design could explain the failure to obtain a reliable contrast between HI and MI. Alternatively, the left STS is not involved in the detection of fine-grained relationships between auditory and visual phonetic representations or their comparison with stored representations.
A recent study by Skipper et al. (2007a), in which visual only, auditory only, and audiovisual stimuli were presented, showed little auditory only activity in posterior STS. Auditory phonetic processing has been reported to be carried out in STG and anterior STS, lateral to Heschl’s gyrus (Scott and Johnsrude, 2003). Lipreading and face motion do activate the posterior STS (Calvert et al., 2000; Hall et al., 2005; Ludman et al., 2000). Audiovisual activation of posterior STS might reflect modulation of visual representations due to feedback from auditory processing areas, rather than integration of auditory and visual speech features (Calvert, 2001).
Campbell (2007) hypothesizes that posterior STS is possibly specialized for processing correlations between auditory and visual stimuli, and not spatial face features. But if this is true, the different levels of correlation represented in the incongruity conditions in the current study would be expected to produce graded activity across levels in posterior STS, which was not obtained here. The use of an event-related design in combination with quantified incongruity and perceptual effects across different audiovisual stimuli could in the future provide a more powerful test of the sensitivity of STS to specific acoustic-optical speech relationships.
Broca’s area (po/pt) has been another focus of research on audiovisual speech integration, although it also has not been consistently reported to be active across studies (Szycik et al., 2007). Interpretation of Broca’s area activation with tasks involving word stimuli (Callan et al., 2003) is particularly problematic, given results showing semantic processing in the region (Skipper et al., 2007b). The current study obtained increased activation in the left and right po/pt and preCG/preCS regions for the contrast between HI and LI. But no left hemisphere voxels surpassed the threshold levels for po/pt activity in the LI condition (see Figure 3), although right hemisphere po/pt and preCG/preCS voxels did surpass threshold. The absence of activation in left frontal areas during the LI conditions implies that this area is not required for processing normal, unproblematic audiovisual stimuli. Miller and d’Esposito (2005) argue that Broca’s area is recruited when integration becomes difficult. In their results, the inferior frontal gyrus (IFG) was more active when their audiovisual stimuli were perceived as unfused versus fused.
Ojanen and colleagues (2005) presented matched and mismatched audiovisual vowel stimuli and a baseline still face condition. The mismatch was intentionally perceptually detectable, and the participants’ task was to detect changes of stimulus type across blocks. The IFG was the only area that was differentially activated (mismatch greater than match), disregarding activations in left prefrontal cortex, and bilateral inferior parietal lobule due to nonsignificant deactivations during matching vowels. Using the same stimuli, Pekkola and colleagues (2006) reported that the Broca’s area was significantly more active to mismatched versus matched vowels.
The recent discovery of “mirror neurons” in the monkey brain that respond both to the perception of an action and to the planning and execution of the action (Rizzolatti et al, 1996) has led to support for the motor theory of speech perception (Liberman and Mattingly, 1985). The basic idea is that there is a direct relation between speech and motor control generally, with language depending on pre-existing motor primitives coupled with the operation of motor equivalence (Allott, 1991; Fadiga et al., 2002) (Kohler et al., 2002; Rizzolatti, 1998). Hickok & Poeppel (2004) concluded that cortical processing of speech perception involves two separate streams, both initiating from the STG: (1) A dorsal stream that projects dorso-posteriorly toward the parietal lobe and ultimately to frontal regions, crucial for mapping between auditory representations of speech and motor representations of speech; and (2) A ventral stream that projects ventro-laterally and involves cortex in the STS and ultimately in the posterior inferior temporal lobe, crucial for mapping sound into semantics. Based on this body of work, Skipper et al. (2007a) proposed a model of audiovisual speech. In their model, audiovisual speech perception is mediated by a network of motor areas that are also involved in planning and executing speech production and in proprioception related to speech production. According to the model, STS multisensory speech representations are projected to the po, which computes a hypothesis via motor commands to be compared with the STS multisensory representation. Skipper et al. propose that, “…motor system activity is … an early hypothesis about the identity of sensory patterns. …patterns of activity during AV speech perception in frontal motor areas would correspond to the participants’ perceptual experience and not the physical stimuli transduced by sensory receptors” (p. 2389). In the current study, the MI stimuli were perceived frequently as fusions, differently from the LI stimuli, but no statistical difference was obtained for MI versus LI frontal activations. This result is not consistent with Skipper et al.’s hypothesis that audio-visual speech perception should correspond with BOLD activity in Broca’s area (cf., Hasson et al., 2007). Future studies with event-related designs could use stimuli with different physical incongruity and different qualitative perceptual effects to investigate in more detail the Skipper-et-al. model, particularly, its additional claim that the relationship between phonetic categories and signals is “non-deterministic.”
In the current study, the left SMG was unique in demonstrating differential activation across all of the conditions. Several studies have reported that right and not left SMG was more active for mismatched versus matched audiovisual stimuli (Jones and Callan, 2003; Miller and d’Esposito, 2005; Skipper et al., 2007b). However, in Hasson-et-al. (2007) a design that exploited neural repetition effects demonstrated activation from the anterior SMG to the posterior IFG in a comparison between participants’ with and without susceptibility to experiencing fusion percepts with the mismatched stimulus. The SMG activation patterns varied inversely across the two types of participants, suggesting that this activity might easily be missed if individual differences are not taken into account. All of the participants in the current study had been pre-screened to be susceptible to the fusion response, which would have increased the power to detect effects in both the SMG and posterior IFG. In Bernstein et al. (2008), also with participants pre-screened for fusion susceptibility, using EEG measures, the SMG was shown to be differentially active for audiovisual matched and mismatched stimuli. Kaiser et al. (2006) reported greater gamma band activity over the left SMG for mismatched versus matched stimuli for apparently unscreened participants.
The left SMG has been characterized as providing short-term phonological memory (Paulesu et al., 1993), participating in detecting a phonological change (Jacquemot et al., 2003), and supporting learning non-native phonemes (Golestani and Zatorre, 2004), among other phonological functions. The left SMG might support a fine-grained analysis of the relationship between auditory and visual phonetic input patterns as suggested here, and as such, might be more highly activated in participants who are more susceptible to fusion effects. The left SMG has also been hypothesized to be a “transmodal gateway” that binds or associates modality-specific representational patterns (Bernstein et al., 2004; Bernstein et al., 2008; Mesulam, 1998). This possibility is also compatible with the findings of the current study: the left SMG was unique in its differential activation to different levels of audio-visual incongruity and the distribution of perceptual categories. The sensitivity to multi-sensory incongruity could be implemented as a comparison of bottom-up auditory and visual perceptual representations with stored knowledge of the normal relationships between auditory and visual patterns.
3.2. Evaluating audiovisual integration
Differences in analysis methods across studies of audiovisual integration could be responsible for diverse findings on sites of audiovisual speech integration. The current study did not use the now-conventional approach to identifying multisensory processing sites, which has been to obtain activity to unisensory auditory and unisensory visual stimuli, so that their arithmetically combined evoked activity can be statistically compared with audiovisually evoked activity. Statistical criteria for multisensory processing have included super-additivity (multisensory > auditory + visual), sub-additivity (multisensory < auditory + visual), greater than maximum [multisensory > max(auditory) and max(visual)], and greater than the average [multisensory > mean(auditory+visual)] (Beauchamp, 2005). These computational strategies were modeled in part on single-cell recording methods (Stein and Meredith, 1993) and have been subjected to criticisms stemming from problems of analogizing measures across single cells to relatively large cortical patches (Laurienti et al., 2005). The different statistical tests have been shown to result in different cortical areas being identified as integration sites (Beauchamp, 2005).
A different problem with the statistical approach to integration site identification is that it focuses on stimulus-brain relationships and not brain-behavior relationships. In the current study, neural activity and quantitative stimulus incongruity measures were associated with qualitative perceptual differences. A valid goal is to specify the complete relationships among stimulus signals, perception, and neural responses. An element of the failure to converge on a consistent view of the audiovisual phonetic processing system is, in our view, due to the lack of a comprehensive model of the relationship between phonetic stimulus properties, phonetic perception, and brain processing. In particular, in both the neuroimaging literature and in the behavioral perception literature, there has been only sparse attention to the quantification and characterization of the acoustic-optical stimuli being used. Although there exists detailed knowledge about acoustic phonetics (Stevens, 1998), little is known about the visual speech stimulus in terms of its relevant optical characteristics (Bernstein, 2006; Jiang et al., 2007). Research on acoustic-optical signal relationships has not until now, to our knowledge, been applied to the study of cortical processing for audiovisual speech. The current results support the view that qualitative perceptual differences can be accounted for to a significant extent by stimulus measures, and that those measures are also relevant to neural responses.
3.3. Summary and Conclusions
Assuming that perceivers implicitly know the normal relationship between auditory and visual speech stimuli, the current study undertook to vary quantitatively and perceptually the level of incongruity in acoustic-optical speech stimuli and record associated BOLD responses. BOLD measures were found to vary regionally and quantitatively with perceptual and quantitative incongruity levels. However, the only cortical region that demonstrated differential sensitivity to the three levels of stimulus incongruity was a subarea of the left SMG. Each increase in level of incongruity also produced an increase in overall levels of cortical activity and in additional activated voxels. This effect might have been due to our having pre-screened our participants for susceptibility to fusion percepts. Quantitative manipulation of audiovisual stimulus incongruity is a new and powerful tool for disclosing the system that processes audiovisual speech stimuli. Future studies based on event-related fMRI designs are needed to obtain more detailed quantifications of the relationship among physical characteristics of the stimuli, human perception, and cortical activations.
4. Experimental Procedure
4.1. Participants
Seven students at the University of Southern California (age 22 to 28 years, mean age 25 years; 3 females) with normal-hearing, American English as a native language, normal or corrected-to-normal vision, and self-reported right-handedness were participants. They were screened for MRI safety and gave informed consent approved by the Institutional Review Boards of the University of Southern California and the House Ear Institute. Following fMRI scanning, behavioral testing showed that they were all susceptible to the McGurk effect.
4.2. Stimuli
Stimuli for this study were derived from a previous large-scale study (Jiang et al., 2005; Jiang and Bernstein, in preparation) whose goal was to account for perceptual identification in terms of quantitative measures of acoustic-optical signals. In that study, every stimulus token, including matched audiovisual stimuli, resulted from dubbing an audio token from one utterance onto a video token from another utterance. The stimuli comprised audio syllables /bA/ or /lA/ dubbed to video syllables, /bA, dA, gA, vA, zA, lA, wA, ΔA/. The syllables had been spoken twice by four talkers, and after dubbing, there were 384 stimuli that were presented 10 times to 10 normal-hearing participants in an open-set identification task. Participants in the study were instructed to report what they heard. Then, quantitative scales were developed to characterize all of the physical acoustic-optical stimuli.
Stimuli in the current study were selected based on the scales and the perceptual results from the Jiang-et-al. study. As the modeling of acoustic-optical signal relationships in Jiang-et-al. is important here, it is described in some detail below (see Appendix also). Overall, the approach was to (1) obtain a variety of physical measurements on the 384 stimuli, (2) compute correlations among the measurements, with individual stimuli as items, (3) extract and rotate underlying factors using exploratory factor analysis based on principal components analysis (PCA) (Kim and Mueller, 1985), and (4) correlate perceptual measures per stimulus with the stimulus component scores in factor space.
Physical stimulus measurements were made on acoustic, mid-sagittal magnetometer, and three-dimensional optical signals. Acoustic signals were digitally recorded and down-sampled to 16 kHz, framed at 120 Hz, and represented by 16th-order line spectral pair (LSP) parameters. The mid-sagittal magnetometer (Carstens) signals were used to record lip, jaw, and tongue motion (recorded at the tongue tip, tongue middle, and tongue back) in two dimensions (see, Jiang et al., 2002, for more details about the recordings). The optical signals were the three-dimensional positions over time of retro-reflectors glued to the talkers’ faces. The three-dimensional data were recorded (simultaneously with the video) using a three-camera system (Qualisys) with a 120-Hz sampling rate.
The 3-dimensional optical data were previously shown to provide a characterization of the stimuli that is highly correlated with speech perception (Jiang et al., 2007). The use of midsaggital magnetometer measurements along with acoustic-optical measurements is multiply justified. Studies have shown that tongue and jaw motion is correlated with external face motion (Jiang et al., 2002; Yehia et al., 1998). In addition, when the lips are parted, perceivers have glimpses of the tongue, whose motions and positions give speech information (Bernstein et al., 2000). Therefore, the magnetometer data serve as a proxy for visible tongue information.
The measurements that were made on the signals were: (1) Acoustic distance, defined as the Euclidean distance between the dubbed acoustic signal and the original acoustic signal that was recorded with the video; (2) The log ratio of audiovisual consonant durations [i.e., log(optical duration/acoustic duration)]; (3) Four correspondence measures among acoustic, optical, and magnetometer quantities; and (4) Mutual information among signals. Measures were made in an analysis window from 30 ms before acoustic consonant onset to 250 ms post onset. The Appendix describes the mathematical basis for computing the four correspondence measures, that is, (1) correspondence of acoustic-to-optical, (2) optical-to-acoustic, (3) acoustic-to-optical+EMA, and (4) optical+EMA-to acoustic signals. Informally, the correspondence measures capture the natural relationships among signals versus the relationships among mismatched signals.
The mutual information I(A;V) of audio (A) and video (V) indicates how much information is shared between A and V (or how much information is learned about A when V is given, and vice versa). The mutual information between acoustic and optical speech signals was computed using a procedure modified from Nock et al. (2002). That is, the feature vectors derived from acoustic and optical measurements were considered to be samples from a multivariate Gaussian probability distribution. Then the mutual information I(A;V) was computed as:
, where ΣA, ΣV, and ΣA,V denote empirical estimates of covariance matrices for audio, video, and joint audiovisual distributions, respectively, and λ’s represent the eigenvalues of the covariance matrices.
Because a prior knowledge of the measurement dimensional structure was not available, exploratory factor analysis (Kim and Mueller, 1985) was applied to obtain an estimate of the underlying dimensional structure. Correlations among measurements are needed to define meaningful dimensions with factor analysis. Therefore, the measurements defined above were made on the 384 audiovisual nonsense stimuli, and correlations among measurements were carried out across individual stimuli. Three factors (dimensions) were obtained through the PCA method for factor analysis followed by rotation. Rotation is used to obtain a parsimonious result, without loss of information. The three factors were shown to account for 75% of the variance in the stimulus measurements.
The correspondence measures loaded on the first factor (loadings varied between .74 and .89), the audiovisual duration log ratio and the minimal acoustic distance loaded on the second factor (loadings of −.81 and .92) (referred to here as the consonant identity factor), and mutual information loaded on the third factor (with loadings of .76 and .83) (referred to here as the mutual information factor). Different numbers of variables load on different factors due to the correlation structure of the measurements. Figure 1 shows the stimuli for the current study in the rotated factor space from Jiang-et-al.
In the current study, the stimuli were spoken by one male talker. The same audio syllables were used across three defined incongruity levels: (1) Low incongruity (LI) matched stimuli, for which there were four stimuli, two tokens for each of AbAVbA (auditory / bA/ and visual / bA/) and AlAVlA; (2) Medium incongruity (MI), moderately mismatched stimuli, with two different tokens each of AbAVdA, AlAVvA, AbAVgA, and AlAVwA; and (3) Mismatched, high incongruity, HI, stimuli with two different tokens each of AbAVvA, AlAVbA, AbAVwA, and AlAVdA.
Each stimulus token was 2 seconds in duration. The original audiovisual recordings on BETACAM tapes made with a Sony DXC-D30 production quality digital and a Sony UVW 1800 video recorder were digitized using an ACCOM real-time digital disk recorder. Original video images were cropped to have a resolution of 720 × 480, and sounds were normalized (based on average A-weighted RMS levels). The sequence of video images for each stimulus was built into an AVI file (29.97 Hz) that was compressed using the LIGOS LSX MPEG-Compressor. These video clips and audio segments were concatenated to create a single large video and audio file, respectively. Audio concatenation was performed using custom software that ensured frame locked audio of 8008 samples per 5 video frames. The video and audio files were authored to a DVD using the SONIC ReelDVD. A different DVD with a new pseudo-randomization of tokens within blocks was made for each participant.
4.3. Stimulus Presentation
A Pioneer V7400 DVD player, controlled by a laptop computer, was used to present the stimuli. Scanner triggers controlled the computer, which also recorded participants’ button presses. The DVD video output was projected (CHRISTIE DLV1280-DX) onto a screen, whose resolution was 768 × 1024, behind the participant’s head and was viewed via a mirror with room lights off during scanning. The audio output was presented with a custom system at a comfortable listening level. EAR insert earphones were threaded through earplugs that were worn within noise-reducing earmuffs. The custom audio system contained two compensation filters and a power amplifier. Its resulting frequency response was evaluated to be substantially flat from 100 to 4000 Hz (using a Knowles Electronics DB-100 ear simulation coupler and by fitting the headphones on a KEMAR manikin). Temporal compensation was used to synchronize the acoustic and optical stimuli due to asynchronies among the laptop (about 8.5 ms), DVD player (about 73 ms), acoustic tube (about 25 ms), and the projector (about 51 ms). The display on the screen was approximately 34.5cm × 26 cm. The viewing distance was about 80 cm.
4.4. Procedure
Stimuli were presented in a block design during scanning. The three main stimulus conditions were each in their own block, and those blocks alternated with a rest condition comprising a blue background (same as stimuli) and a fixation cross. There were 135 tokens (in 15 stimulus blocks) in each run. For the LI condition, the four audiovisual tokens were presented twice per block. For the MI and HI conditions, the four audio tokens were presented the same number of times, but instead of two visual syllable types, there were four. An AzaVza foil was randomly located in each stimulus block, resulting in nine stimulus tokens in each of the LI, MI, and HI conditions (18 sec). Each rest block was also 18 sec. Two presentation orders were prepared for each participant, with pseudo-randomized stimuli within blocks: LI, rest, MI, rest, HI, rest (repeated 5 times; Order 1) and HI, rest, MI, rest, LI, rest (repeated 5 times; Order 2). Three participants were scanned with Order 1 first and four with Order 2 first. In each block of stimuli, participants were asked to press a button whenever they detected audiovisual /zA/. Participants were instructed to focus on the talker’s lip area and a fixation cross during rest conditions. An eye-tracking system was used to monitor participants’ alertness.
A behavioral, open-set perceptual identification task was presented to each of the participants after their scanning session. In that task, they identified each of the 384 audiovisual stimuli from Jiang et al. (2005). This was done to make sure that the participants performed similarly to those in the previous study from which the stimuli were obtained.
4.5. Imaging
Imaging was carried out in the Dana & David Dornsife Cognitive Neuroscience Imaging Center at the University of Southern California using a Siemens 3T MAGNETON Trio MRI system with TIM (Siemens Medical Systems, Erlangen, Germany). A localizer scan comprising five sagittal, one axial, and one coronal slice (22 sec; TE/TR, 5/20 ms; flip angle, 40°; in-plane resolution, 1.5×1.5 mm2; FOV, 280 × 280 mm2) was obtained to define 3-D anatomical positions and slice positions for the functional scans. A high-resolution 3-D structural scan was acquired using an MPRAGE sequence (TE/TR, 4.14/2070 ms; flip angle, 12°; 192 sagittal slices; matrix size, 256 × 256; voxel size, 1 × 1 × 1 mm3; FOV, 256 × 256 mm2; slice thickness, 1 mm; slice spacing, 0 mm). Then, a 3-volume dummy EPI scan (10 sec) was run as a quality check and for intra-session alignment of functional data.
Two, 276-volume functional scans were obtained with 25 transversal slices using an echo-planar imaging (EPI) sequence (9 min 16 sec; TE/TRslice/TR, 35/80/2000 ms; matrix size, 64 × 64; in-plane resolution, 3.5 × 3.5 mm2; slice thickness, 5 mm; slice spacing, 0.5 mm; slice order, ascending; FOV, 224 × 224 mm2; flip angle, 90°). The 25 slices roughly covered the whole brain. The sequence had built-in motion correction, and the first 6 volumes were for achieving T1 saturation, during which the rest condition was presented.
All of the scans were obtained in the same session, except for the first participant, for whom the two functional scans were recorded in two separate sessions due to a scanner problem. For that participant, two MPRAGE scans were recorded one in each session, and the same condition order with different pseudo-randomization of tokens was used in the two functional runs.
4.6. Image data pre-processing
Functional and anatomical images were analyzed using BrainVoyager QX 1.99 (Brain Innovation, Maastricht, The Netherlands) and custom MATLAB code. Inhomogenity correction and Talairach transformation were applied to the structural imaging data prior to intensity-based automatic cortex segmentation. One mesh for the left hemisphere and one for the right were obtained for each participant. The reconstructed and smoothed cortical surfaces (meshes) from the dilated version of the white/grey matter boundary were used in subsequent analyses.
However, for better cortex-based alignment, the surface meshes were refined by manually correcting the intermediate three-dimensional white/grey matter boundary segmentation results prior to reconstruction. To improve the co-registration across the brains of individual participants, cortex-based alignment was performed using curvature information reflecting the gyral/sulcal folding patterns on the reconstructed meshes (Fischl et al., 1999; van Atteveldt et al., 2004). The alignment was performed separately using BrainVoyager for the left and right hemispheres as follows. The curvature information for each mesh was generated and smoothed to preserve the gyral/sulcal folding pattern. The reconstructed folded cortical surface of each hemisphere was morphed with distortion-correction onto a spherical surface. The morphed sphere was then re-sampled into a regular/standard sphere that has 40962 vertices, providing common coordinates for alignment. For each hemisphere, the individual participant standardized spheres with curvature information were aligned to their mutual dynamic average. The alignment was performed iteratively in four different levels of smoothness (from highly smoothed curvature maps to slightly smoothed ones). To improve the alignment, Participant 2’s morphed sphere (left) was manually rotated before standardization to match curvature pattern of the other spheres; Participant 6’s morphed sphere (right) was morphed again for surface irregularity. These adjustments led to a good alignment. After alignment, an averaged hemisphere mesh was generated for displaying group results.
During data acquisition, real-time motion correction was applied to the functional data using 3D-PACE (Siemens). Additional, offline motion correction with three-dimensional, rigid-body-transformation with the first volume of the dummy EPI as reference was performed after slice timing correction in preprocessing. Spatial-domain three-dimensional smoothing was then applied with a full-width half-max (FWHM) Gaussian filter of 5 mm. The data were filtered in the temporal domain for linear trend removal and high-pass filtered with a cutoff frequency of 3 cycles per run. Temporal smoothing with a Gaussian kernel of 4 seconds was applied afterwards.
The dummy EPI scan for each participant was co-registered to their same-session high-resolution structural data. The resulting functional-to-structural transformation matrices, together with the Talairach transformation matrices, were used to warp the functional data into the Talairach space. For Subject 1, automatic 3-D to 3-D co-registration was applied to co-register the run in the second session to the structural data recorded in the first session. The normalized 3-D functional data were subsequently re-computed using the standardized mesh surfaces (40962 vertices; from −1 mm to 3 mm).
4.7. Statistical analyses
The BOLD responses were z-transformed and whitened by removing the serial correlation with a first-order autoregressive model. A random-effects GLM with a difference of Gamma function (BrainVoyager default) was used to extract the BOLD activation levels of each stimulus condition in each hemisphere. The individual subject data were from the standardized cortical surfaces that had been cortex-based aligned onto the averaged mesh space. The GLM design was applied to obtain four predictors (i.e., LI, MI, HI and rest) for each vertex on the average meshes. The random-effects model is less sensitive to individual extrema than a fixed-effects model, and effects with relatively small numbers of participants must be more consistent to achieve statistical significance with the random-effects models.
Then a second-level analysis was performed, using the BOLD activation levels from the GLM, to identify the active cortical areas with respect to incongruity level. Three contrasts were tested, LI-rest, MI–rest, and HI–rest. The threshold significance level was the false discover rate (FDR) of 0.05, and the activity was subsequently visualized with the cluster size threshold set at 15. The FDR thresholds were computed using a custom MATLAB program based on Genovese, Lazar, & Nichols (2002).
In order to examine differences in activation due to incongruity, a mask that preserved only the significant positive activations from the second-level analyses was applied to comparisons among Beta values for MI-LI, HI-LI, and LI-MI on a per-voxel basis. For these direct comparisons, an uncorrected p-value of 0.05 and a cluster size of 15 were used. Because these comparisons were applied only to the small pool of voxels that survived the first-level threshold, a correction for multiple comparisons was not applied (Beauchamp, 2005). Also, the differences among audiovisual conditions were expected to be subtle, relative to the differences between stimulus conditions and rest.
Table 2.
Contrasts among incongruity levels, HI > LI, MI > LI, and HI > MI. Anatomical regions are listed for which the contrast resulted in significant differences (indicated by “X”) with p-value of 0.02 and cluster size of 15. [LingG = lingual gyrus; MTG = middle temporal gyrus; po = pars opercularis;pt = pars triangularis;; plT = planum temporale; postCG = postcentral gyrus; preCG = precentral gyrus; preCS = precentral sulcus; SFG = superior frontal gyrus; SMG = supramarginal gyrus; STG = superior temporal gyrus; STS = superior temporal sulcus]
| Contrasts
(left) |
STG | STS | MTG | SMG | pt/po | preCG/
preCS |
postCG | plT | LingG | SFG |
|---|---|---|---|---|---|---|---|---|---|---|
| HI > LI | X | X | X | X | X | X | X | X | ||
| MI > LI | X | X | X | X | ||||||
| HI > MI | X | X | X | |||||||
|
| ||||||||||
| Contrasts
(right) |
||||||||||
|
| ||||||||||
| HI > LI | X | X | X | X | X | X | X | |||
| MI > LI | X | X | ||||||||
| HI > MI | ||||||||||
Acknowledgments
This research was supported in part by NIH/NIDCD (DC006035 and DC008308). We acknowledge the help of Edward T. Auer, Jr., Ph.D., Jiancheng Zhuang, Ph.D., John Jordan, Brian Chaney, and Ewen Chao.
Appendix: Correspondence Measures
The physical stimulus variables that comprised the underlying correspondence factor, obtained with factor analysis, were computed using the methods described here. There were three correspondence measures, acoustic-to-optical, optical-to-acoustic, acoustic-to-optical+EMA, and optical+EMA-to acoustic.
To illustrate how the acoustic-to-optical measure was computed, Ala1Vwa2 is used as an example. Let LSPAla be a matrix (row: LSP channels; column: frames), and let OVwa2 be a matrix (row: optical channels; column: frames), representing the acoustic signals for Ala1 and the optical signals for Vwa2 respectively.
The computation of acoustic-to-optical incongruity involves first establishing the normal correspondence between acoustic and optical speech information, that is, a weighting matrix weightsAla1→ Vla1 that transforms acoustic data into optical data using the least-squares linear estimation (Kailath et al., 2000),
where c is a constant vector, T represents transposition of the matrix, and weightsAla1→ Vla1 are the weights for transforming the acoustic signals into optical signals. After obtaining the optimal weights for the normal acoustic-optical signal relationship, a Pearson correlation was computed between the transformed signal and the presented optical signal . Thus, the Pearson correlation reflects the correspondence between the actually presented optical signals and the optical signals normally associated with the presented acoustic signals. Informally, the correlation captures the correspondence between what the participant sees and what the participant ordinarily would see, if the acoustic-optical signals were in their normal correspondence.
The CV syllables used in the present study were recorded using audio, video, and 3-dimensional optical recording systems, and also, independently by the same talkers, using magnetometry (Jiang et al., 2002). The magnetometry data were co-registered with the 3-dimensional optical data and scaled, and the three data streams (tongue motion, face motion, and acoustic) were synchronized and were processed to have the same feature frame rate (120 frame/second) (see Jiang et al., 2002). To compute the acoustic-to-optical incongruity with the addition of tongue (EMA) signals, EMA and optical data were first concatenated to form fused data . Then the four tokens of each syllable were concatenated. That is, for the example AlaVwa pair, the corresponding acoustic and optical data for computing acoustic-to-optical congruity were [(LSPAla)1 , (LSPAla)2 , (LSPAla)3 , (LSPAla)4 ], , and . Mutual information (see Methods) between acoustic and optical data was also computed with the addition of the tongue data using this data set.
Footnotes
Publisher's Disclaimer: This is a PDF file of an unedited manuscript that has been accepted for publication. As a service to our customers we are providing this early version of the manuscript. The manuscript will undergo copyediting, typesetting, and review of the resulting proof before it is published in its final form. Please note that during the production process errors may be discovered which could affect the content, and all legal disclaimers that apply to the journal pertain.
References
- Allott R. The motor theory of language. In: von Raffler-Engel W, Wind J, Jonker A, editors. Studies in Language Origins. II. Benjamins; Amsterdam: 1991. [Google Scholar]
- Barker JP, Berthommier F. Estimation of speech acoustics from visual speech features: a comparison of linear and non-linear models. In: Massaro DW, editor. AVSP 1999 International Conference on Auditory-Visual Speech Processing. Vol; Santa Cruz, CA. 1999. pp. 112–117. [Google Scholar]
- Beauchamp MS. Statistical criteria in FMRI studies of multisensory integration. Neuroinformatics. 2005;3:93–113. doi: 10.1385/NI:3:2:093. [DOI] [PMC free article] [PubMed] [Google Scholar]
- Bernstein LE, Demorest ME, Tucker PE. Speech perception without hearing. Perception & Psychophysics. 2000;62:233–52. doi: 10.3758/bf03205546. [DOI] [PubMed] [Google Scholar]
- Bernstein LE, Auer ET, Jr, Moore JK. Audiovisual Speech Binding: Convergence or Association? In: Calvert GA, Spence C, Stein BE, editors. Handbook of Multisensory Processing. MIT; Cambridge, MA: 2004. pp. 203–223. [Google Scholar]
- Bernstein LE. Visual speech perception. In: Vatikiotis-Bateson E, Bailly G, Perrier P, editors. Audio-Visual Speech Processing. Vol. MIT; Cambridge: 2006. [Google Scholar]
- Bernstein LE, Auer ET, Jr, Wagner M, Ponton CW. Spatio-temporal dynamics of audiovisual speech processing. NeuroImage. 2008;39:423–435. doi: 10.1016/j.neuroimage.2007.08.035. [DOI] [PMC free article] [PubMed] [Google Scholar]
- Callan DE, Jones JA, Munhall K, Callan AM, Kroos C, Vatikiotis-Bateson E. Neural processes underlying perceptual enhancement by visual speech gestures. NeuroReport. 2003;14:2213–2218. doi: 10.1097/00001756-200312020-00016. [DOI] [PubMed] [Google Scholar]
- Calvert GA, Brammer MJ, Bullmore ET, Campbell R, Iversen SD, David AS. Response amplification in sensory-specific cortices during crossmodal binding. NeuroReport. 1999;10:2619–23. doi: 10.1097/00001756-199908200-00033. [DOI] [PubMed] [Google Scholar]
- Calvert GA, Campbell R, Brammer MJ. Evidence from functional magnetic resonance imaging of crossmodal binding in the human heteromodal cortex. Current Biology. 2000;10:649–57. doi: 10.1016/s0960-9822(00)00513-3. [DOI] [PubMed] [Google Scholar]
- Calvert GA. Crossmodal processing in the human brain: insights from functional neuroimaging studies. Cerebral Cortex. 2001;11:1110–23. doi: 10.1093/cercor/11.12.1110. [DOI] [PubMed] [Google Scholar]
- Campbell R. The processing of audio-visual speech: empirical and neural bases. Philos Trans R Soc Lond B Biol Sci. 2007 doi: 10.1098/rstb.2007.2155. [DOI] [PMC free article] [PubMed] [Google Scholar]
- Fadiga LG, Craighero G, Buccino Rizzolatti G. Speech listening specifically modulates the excitability of tongue muscles: a TMS study. European Journal of Neuroscience. 2002;15:399–402. doi: 10.1046/j.0953-816x.2001.01874.x. [DOI] [PubMed] [Google Scholar]
- Fischl B, Sereno MI, Tootell RB, Dale AM. High-resolution intersubject averaging and a coordinate system for the cortical surface. Human Brain Mapping. 1999;8:272–284. doi: 10.1002/(SICI)1097-0193(1999)8:4<272::AID-HBM10>3.0.CO;2-4. [DOI] [PMC free article] [PubMed] [Google Scholar]
- Genovese CRALNTN. Thresholding of statistical maps in functional neuroimaging using the false discovery rate. NeuroImage. 2002;15:870–878. doi: 10.1006/nimg.2001.1037. [DOI] [PubMed] [Google Scholar]
- Golestani N, Zatorre RJ. Learning new sounds of speech: reallocation of neural substrates. Neuroimage. 2004;21:494–506. doi: 10.1016/j.neuroimage.2003.09.071. [DOI] [PubMed] [Google Scholar]
- Green KP, Kuhl PK. The role of visual information in the processing of place and manner features in speech perception. Perception & Psychophysics. 1989;45:34–42. doi: 10.3758/bf03208030. [DOI] [PubMed] [Google Scholar]
- Green KP, Kuhl PK. Integral processing of visual place and auditory voicing information during phonetic perception. Journal of Experimental Psychology: Human Perceptual Performance. 1991;17:278–88. doi: 10.1037//0096-1523.17.1.278. [DOI] [PubMed] [Google Scholar]
- Green KP, Norrix LW. Acoustic cues to place of articulation and the McGurk effect: the role of release bursts, aspiration, and formant transitions. Journal of Speech, Language, and Hearing Research. 1997;40:646–65. doi: 10.1044/jslhr.4003.646. [DOI] [PubMed] [Google Scholar]
- Hall DA, Fussell C, Summerfield AQ. Reading fluent speech from talking faces: typical brain networks and individual differences. Journal of Cognitive Neuroscience. 2005;17:939–953. doi: 10.1162/0898929054021175. [DOI] [PubMed] [Google Scholar]
- Hasson U, Skipper JI, Nusbaum HC, Small SL. Abstract coding of audiovisual speech: beyond sensory representation. Neuron. 2007;56:1116–26. doi: 10.1016/j.neuron.2007.09.037. [DOI] [PMC free article] [PubMed] [Google Scholar]
- Hickok G, Poeppel D. Dorsal and ventral streams: a framework for understanding aspects of the functional anatomy of language. Cognition. 2004;92:67–99. doi: 10.1016/j.cognition.2003.10.011. [DOI] [PubMed] [Google Scholar]
- Jacquemot C, Pallier C, LeBihan D, Dehaene S, Dupoux E. Phonological grammar shapes the auditory cortex: a functional magnetic resonance imaging study. J Neurosci. 2003;23:9541–6. doi: 10.1523/JNEUROSCI.23-29-09541.2003. [DOI] [PMC free article] [PubMed] [Google Scholar]
- Jiang J, Alwan A, Keating P, Auer ET, Jr, Bernstein LE. On the relationship between face movements, tongue movements, and speech acoustics. EURASIP Journal on Applied Signal Processing: Special issue on Joint AudioVisual Speech Processing. 2002;2002:1174–1188. [Google Scholar]
- Jiang J, Bernstein LE, Auer ET., Jr . Perception of congruent and incongruent audiovisual speech stimuli. In: Vatikiotis-Bateson E, Burnham D, Fels S, editors. AVSP ‘05. Causal Productions; British Columbia, Canada: 2005. [Google Scholar]
- Jiang J, Alwan A, Keating PA, Auer ET, Jr, Bernstein LE. Similarity structure in visual speech perception and optical phonetics. Perception & Psychophysics. 2007;69:1070–1083. doi: 10.3758/bf03193945. [DOI] [PubMed] [Google Scholar]
- Jiang J, Bernstein LE. Quantification of the physical relationships between acoustic and optical signals that drive audiovisual speech perception in preparation. [Google Scholar]
- Jones JA, Callan DE. Brain activity during audiovisual speech perception: An fMRI study of the McGurk effect. NeuroReport. 2003;14:1129–1133. doi: 10.1097/00001756-200306110-00006. [DOI] [PubMed] [Google Scholar]
- Kailath T, Sayed AH, Hassibi B. Linear Estimation, Vol. Prentice Hall; 2000. [Google Scholar]
- Kaiser J, Hertrich I, Ackermann H, Lutzenberger W. Gamma-band activity over early sensory areas predicts detection of changes in audiovisual speech stimuli. NeuroImage. 2006;30:1376–82. doi: 10.1016/j.neuroimage.2005.10.042. [DOI] [PubMed] [Google Scholar]
- Kim J-O, Mueller CW. IIntroduction to Factor Analysis: What it is and How to do it, Vol. 07-013. SAGE; Beverly Hills: 1985. [Google Scholar]
- Kohler E, Keysers C, Umilta MA, Fogassi L, Gallese V, Rizzolatti G. Hearing Sounds Understanding Actions: Action Representation in Mirror Neurons Science. 2002;297:846–848. doi: 10.1126/science.1070311. [DOI] [PubMed] [Google Scholar]
- Lamoré PJ, Huiskamp TM, van Son NJ, Bosman AJ, Smoorenburg GF. Auditory, visual and audiovisual perception of segmental speech features by severely hearing-impaired children. Audiology. 1998;37:396–419. doi: 10.3109/00206099809072992. [DOI] [PubMed] [Google Scholar]
- Laurienti PJ, Perrault TJ, Stanford TR, Wallace MT, Stein BE. On the use of superadditivity as a metric for characterizing multisensory integration in functional neuroimaging studies. Experimental Brain Research. 2005;166:289–297. doi: 10.1007/s00221-005-2370-2. [DOI] [PubMed] [Google Scholar]
- Liberman AM, Mattingly IG. The motor theory of speech perception revised. Cognition. 1985;21:1–36. doi: 10.1016/0010-0277(85)90021-6. [DOI] [PubMed] [Google Scholar]
- Ludman CN, Summerfield AQ, Hall D, Elliott M, Foster J, Hykin JL, Bowtell R, Morris PG. Lip-reading ability and patterns of cortical activation studied using fMRI. British Journal of Audiology. 2000;34:225–30. doi: 10.3109/03005364000000132. [DOI] [PubMed] [Google Scholar]
- McGurk H, MacDonald J. Hearing lips and seeing voices. Nature. 1976;264:746–748. doi: 10.1038/264746a0. [DOI] [PubMed] [Google Scholar]
- Mesulam MM. From sensation to cognition. Brain. 1998;121:1013–52. doi: 10.1093/brain/121.6.1013. [DOI] [PubMed] [Google Scholar]
- Miller LM, d’Esposito M. Perceptual fusion and stimulus coincidence in the cross-modal integration of speech. Journal of Neuroscience. 2005;25:5884–5893. doi: 10.1523/JNEUROSCI.0896-05.2005. [DOI] [PMC free article] [PubMed] [Google Scholar]
- Moody-Antonio S, Takayanagi S, Masuda A, Auer JET, Fisher L, Bernstein LE. Improved speech perception in adult prelingually deafened cochlear implant recipients. Otology and Neurotology. 2005;26:649–654. doi: 10.1097/01.mao.0000178124.13118.76. [DOI] [PubMed] [Google Scholar]
- Mottonen R, Krause CM, Tiippana K, Sams M. Processing of changes in visual speech in the human auditory cortex. Cognitive Brain Research. 2002;13:417–425. doi: 10.1016/s0926-6410(02)00053-8. [DOI] [PubMed] [Google Scholar]
- Nichols T, Brett M, Andersson J, Wager T, Poline JB. Valid conjunction inference with the minimum statistic. Neuroimage. 2005;25:653–60. doi: 10.1016/j.neuroimage.2004.12.005. [DOI] [PubMed] [Google Scholar]
- Nock HJ, Iyengar G, Neti C. Assessing face and speech consistency for monologue detection in video. Proceedings of the tenth ACM international conference on Multimedia; Juan-les-Pins, France. 2002. pp. 303–306. [Google Scholar]
- Ojanen V, Mottonen R, Pekkola J, Jaaskelainen IP, Joensuu R, Autti T, Sams M. Processing of audiovisual speech in Broca’s area. NeuroImage. 2005;25:333–8. doi: 10.1016/j.neuroimage.2004.12.001. [DOI] [PubMed] [Google Scholar]
- Paulesu E, Frith CD, Frackowiak RS. The neural correlates of the verbal component of working memory. Nature. 1993;362:342–5. doi: 10.1038/362342a0. [DOI] [PubMed] [Google Scholar]
- Pekkola J, Laasonen M, Ojanen V, Autti T, Jaaskelainen IP, Kujala T, Sams M. Perception of matching and conflicting audiovisual speech in dyslexic and fluent readers: an fMRI study at 3 T. Neuroimage. 2006;29:797–807. doi: 10.1016/j.neuroimage.2005.09.069. [DOI] [PubMed] [Google Scholar]
- Raichle ME, Mintun MA. Brain work and brain imaging. Annu Rev Neurosci. 2006;29:449–76. doi: 10.1146/annurev.neuro.29.051605.112819. [DOI] [PubMed] [Google Scholar]
- Raichle ME, Snyder AZ. A default mode of brain function: a brief history of an evolving idea. Neuroimage. 2007;37:1083–90. doi: 10.1016/j.neuroimage.2007.02.041. discussion 1097–9. [DOI] [PubMed] [Google Scholar]
- Rizzolatti GAM. Language within our grasp. Trends in Neuroscience. 1998;21:188–194. doi: 10.1016/s0166-2236(98)01260-0. Language within our grasp. [DOI] [PubMed] [Google Scholar]
- Scott SK, Blank CC, Rosen S, Wise RJ. Identification of a pathway for intelligible speech in the left temporal lobe. Brain. 2000;123 Pt 12:2400–6. doi: 10.1093/brain/123.12.2400. [DOI] [PMC free article] [PubMed] [Google Scholar]
- Scott SK, Johnsrude IS. The neuroanatomical and functional organization of speech perception. Trends in Neurosciences. 2003;26:100–107. doi: 10.1016/S0166-2236(02)00037-1. [DOI] [PubMed] [Google Scholar]
- Skipper JI, Goldin-Meadow S, Nusbaum HC, Small SL. Speech-associated gestures, Broca’s area, and the human mirror system. Brain Lang. 2007a;101:260–77. doi: 10.1016/j.bandl.2007.02.008. [DOI] [PMC free article] [PubMed] [Google Scholar]
- Skipper JI, van Wassenhove V, Nusbaum HC, Small SL. Hearing lips and seeing voices: how cortical areas supporting speech production mediate audiovisual speech perception. Cereb Cortex. 2007b;17:2387–99. doi: 10.1093/cercor/bhl147. [DOI] [PMC free article] [PubMed] [Google Scholar]
- Stein BE, Meredith MA. The Merging of the Senses, Vol. MIT; Cambridge, MA: 1993. [Google Scholar]
- Stevens KN. Acoustic Phonetics, Vol. MIT Press; Cambridge, MA: 1998. [Google Scholar]
- Sugamura N, Itakura F. Speech analysis and synthesis methods developed at ECL in NTT - from LPC to LSP. Speech Communication. 1986;5:199–215. [Google Scholar]
- Sumby WH, Pollack I. Visual contribution to speech intelligibility in noise. Journal of the Acoustical Society of America. 1954;26:212–215. [Google Scholar]
- Szycik GR, Tausche P, Munte TF. A novel approach to study audiovisual integration in speech perception: Localizer fMRI and sparse sampling. Brain Res. 2007 doi: 10.1016/j.brainres.2007.08.027. [DOI] [PubMed] [Google Scholar]
- van Atteveldt NM, Formisano E, Goebel R, Blomert L. Integration of letters and speech sounds in the human brain. Neuron. 2004;43:271–282. doi: 10.1016/j.neuron.2004.06.025. [DOI] [PubMed] [Google Scholar]
- Wright TM, Pelphrey KA, Allison T, McKeowin MJ, McCarthy G. Polysensory interactions along lateral temporal regions evoked by audiovisual speech. Cerebral Cortex. 2003;13:1034–1043. doi: 10.1093/cercor/13.10.1034. [DOI] [PubMed] [Google Scholar]
- Yehia H, Rubin P, Vatikiotis-Bateson E. Quantitative association of vocal-tract and facial behavior. Speech Communication. 1998;26:23–43. [Google Scholar]