

Abstract
Over the past 30 years researchers have learned a great deal about the development of object processing in infancy. In contrast, little is understood about the neural mechanisms that underlie this capacity, in large part because there are few techniques available to measure brain functioning in human infants. The present research examined the extent to which near-infrared spectroscopy (NIRS), an optical imaging technique, could be used to assess the relation between object processing and brain functioning. Infants aged 6.5 months were presented with an occlusion event involving objects that differed on many feature dimensions (multi-featural change), differed on shape only (shape change) or color only (color change), or did not differ (control). NIRS data were collected in the occipital and inferior temporal cortex. In the occipital cortex a significant increase in oxyhemoglobin (HbO2) was observed in response to all four events and these responses did not differ significantly from each other. In the inferior temporal cortex, a significant increase in HbO2 was observed in the multi-featural and the shape change condition but not in the control condition. An increase was also observed in the color change condition but this increase did not differ significantly different from 0 nor did it differ significantly from the response obtained in the control condition. These data were discussed in terms of (a) what they suggest about the neural basis of feature processing in infants and (b) the viability of using NIRS to study brain-behavior relations in infants.
Over the past 30 years, cognitive scientists have learned a great deal about the development of object processing in infants. For example, soon after birth infants attend to the boundaries of objects as determined by areas of high contrast and motion-related information (Adams & Maurer, 1984; Arterberry & Yonas, 2000; Slater & Morison, 1985; Stephens & Banks, 1987) and then use those boundaries to segregate objects from other surfaces (Slater, Morison, Somers, Mattock, Brown, & Taylor, 1990; Slater, Morison, Town, & Rose, 1985; Spelke, 1985). By 4 months infants reliably scan the entire object (Colombo, Mitchell, Coldren, & Freeseman, 1991; Maurer & Salapatek, 1976) and attend to the featural properties of objects, such as shape, color, and pattern. However, discrepancies sometimes exist between infants' capacity to detect a featural property and the extent to which infants use that feature to interpret events involving objects. For example, by 4.5 months infants use form features, such as shape and size, to determine whether an object currently in view is the same object, or a different object, than seen previously (Wilcox, 1999). However, it is not until much later that infants use color information to individuate objects (Wilcox, 1999; Wilcox & Chapa, 2004; Wilcox, Woods, Chapa, & McCurry, in press). Similar findings have been observed in studies of object segregation and identification (Needham, 199; Tremoulet, Leslie, & Hall, 2001). These findings are intriguing because by 4.5 months infants have relatively good color vision and can detect color differences. However, they do not use these differences to segregate and individuate objects.
In contrast, little is known about the underlying neural mechanisms that are responsible for the developmental changes that have been observed in object processing tasks. One reason for this gap in knowledge is that there are a limited number of non-invasive neuroimaging techniques available for use with human infants. Brain-imaging methods that can be used to identify the neural areas activated, such as functional magnetic resonance imaging (fMRI) and positron emission tomography (PET), are difficult to apply in awake infants. Other techniques, such as electroencephalography (EEG), event-related brain potentials (ERP), and magnetoencephalography (MEG), provide important information about the timing of neural responses but are limited in identifying the location from which the responses were generated. There is, therefore, a critical need to identify new strategies to assess the functional development of object processing in the human brain.
Near-infrared Spectroscopy
One method currently under development for use with infants in the experimental setting is near-infrared spectroscopy (NIRS) (Baird et al., 2002; Bortfeld, Wruck, & Boas, 2007; Peña et al., 2003; Taga, Asakawa, Maki, Konishi, & Koizumi, 2003; Wilcox, Bortfeld, Woods, Wruck, & Boas, 2005), an optical imaging technique that uses changes in blood volume and hemoglobin oxygenation as an index of neural activation. The rationale for this approach rests on the concept that neural activation in response to a stimulus results in increased energy demands in the area activated. To accommodate the demand for energy, cerebral blood flow (CBF) increases to the activated brain areas bringing oxygen and glucose. Changes in blood flow lead to an increase in blood volume and can be assessed by measuring local concentrations of oxyhemoglobin (oxygenated blood) and deoxyhemoglobin (deoxygenated blood). Typically, during cortical activation local concentrations of oxyhemoglobin (HbO2) increase, whereas concentrations of deoxyhemoglobin (HbR) decrease. However, the HbR response tends to be much smaller in magnitude and less reliable than the HbO2 response (Bartocci et al., 2001; Chen et al., 2002; Hoshi & Tamura 1993; Jasdzewski et al., 2003; Kato, Kamei, Takashima, & Ozaki, 1993; Sakatani et al., 1999; Strangman, Culver, Thompson, & Boas, 2002; Strangman, Franceschini, & Boas, 2003). Finally, from the summated changes in HbR and HbO2 total hemoglobin (HbT) can be computed.
To measure changes in oxyhemoglobin and deoxyhemoglobin, near-infrared light between approximately 650 and 900 nm is projected through the skull and into the brain. At these wavelengths, light is differentially absorbed by oxygenated and deoxygenated blood (Gratton, Sarno, Maclin, Corballis, & Fabiani, 2000; Villringer & Chance, 1997). Below 800 nm light is relatively more sensitive to deoxygenated blood and above 800 nm it is relatively more sensitive to oxygenated blood. Hence, measuring the light intensity modulation during stimulus presentation, and comparing it to the light intensity during a baseline event in which no stimulus is presented, provides important information about the hemodynamic response to brain activation. Evidence that there is a linear relationship between hemodynamics and neural activity (Gratton, Goodman-Wood, & Fabiani, 2001), and that NIRS produces results consistent with other imaging techniques (i.e., fMRI and PET) used simultaneously (Kleinschmidt et al., 1996; Strangman et al., 2002; Villringer et al., 1997), provides converging evidence that NIRS can provide a reliable measure of brain function.
Application of NIRS to Object Processing
Recently, Wilcox et al. (2005) used NIRS to explore the neural basis of infants' sensitivity to featural information in an occlusion event. Infants aged 6.5 months were shown an event in which a box and a ball emerged successively to opposite sides of an occluder. There is evidence from looking time and reaching tasks (McCurry, Wilcox, & Woods, 2006; Wilcox & Baillargeon, 1998a,b; Wilcox & Schweinle, 2002) that infants as young as 4.5 months attend to the featural differences between the box and the ball and use those differences to interpret the event as involving two separate and distinct objects. There is also evidence from research with adult monkeys (De Yoe & Van Essen, 1988; Desimone & Ungerlieder, 1989; Livingstone & Hubel, 1987, 1988; Mishkin, Ungerleider, & Macko, 1983; Tanaka, 1997, 2000; Tsunoda, Yamane, Nishkzaki, & Tanifuji, 2001; Ungerleider & Mishkin, 1982; Van Essen, Anderson, & Felleman, 1992; Wang, Tanifuji, & Tanaka, 1998; Wang, Tanaka, Tanifuji, 1996) and adult humans (Boucart et al., 2000; Clark et al., 1997; Grill-Spector et al., 1998; Kraut, Hart, Soher, Gordon, 1997) that the occipital (O) and inferior temporal (IT) cortex are critical components of the neural system that mediates object processing. Whereas occipital cortex is important for the processing of individual features, inferior temporal cortex is important for integrating features into whole object representations and for identifying objects on the basis of the features included in those representations.
Wilcox et al. (2005) assessed the extent to which O and IT would be activated during a task that is known to engage these processes in infants. NIRS data revealed a significant increase in HbO2 in O and IT in response to the box-ball event, suggesting that both neural areas were activated during the object processing task. These results, which were some of the first to be reported with infants in an experimental setting, broke new ground in the developmental neurosciences by demonstrating that it is feasible to assess the neural basis of object processing in human infants using NIRS technology. At the same time there are limitations to the conclusions that can be drawn from these data alone. For example, the box and the ball varied on many feature dimensions, including shape, color, and pattern. The extent to which any one of these differences, alone, would activate O and IT cortex is unknown. In light of recent evidence that infants are more sensitive to shape than color differences in object processing tasks (Needham, 1999; Tremoulet et al., 2001; Wilcox, 1999), we thought it possible that differential patterns of neural activation would be observed in response to events involving shape and color differences.
Present Research
The present research was designed to assess the extent to which neural activation would be observed in O and IT in response to events in which the objects differed on one or more feature dimensions. Infants aged 6.5 months were assigned to one of four conditions: multi-featural change, shape change, color change, or control. In the multi-featural change condition, infants saw an occlusion sequence (Figure 1) in which a ball and a box emerged successively to opposite sides of a screen. These were the same objects used by Wilcox et al. (2005) and they varied on many feature dimensions, including shape and color. There is converging evidence, from multiple behavioral paradigms, that infants use the featural differences to individuate the ball and the box (McCurry et al., 2006; Wilcox & Baillargeon, 1998a,b; for a review see Wilcox & Woods, in press). In the shape change and the color change condition the objects seen to opposite sides of the screen were identical except for their shape (green ball-green box) or their color (green ball-red ball). Previous research indicates that 6.5-month-olds use the shape but not the color difference to individuate objects (Wilcox, 1999). In the control condition, the same object (green ball-green ball) was seen to both sides of the screen. Two hypotheses were made. First, neural activation as measured by an increase in HbO2 would be observed in O in response to all four events (i.e., any visual event should activate the occipital cortex). Second, neural activation would be observed in IT in response to the multi-feature and the shape change event but not the color change or the control event. We reasoned that only those features that are fully integrated into infants' object representations and to which infants are sensitive in object processing tasks would activate IT. Although this is a relatively bold prediction, the outcome of the present experiment will shape the approach we take in future NIRS experiments. Hence, we thought it best to test these critical hypotheses.
Figure 1.
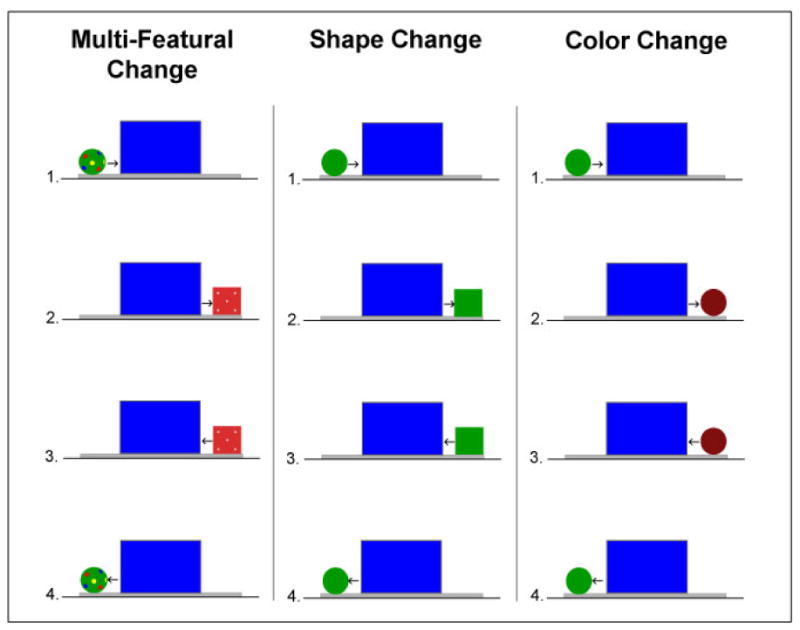
Schematic representation of the test events. In the ball-box test event (multi-featural condition), prior to the start of each trial the screen stood upright at the center of the platform; the ball sat at the left edge of the platform and the box was hidden behind the right side of the screen. When the computer signaled the start of the test trial, the ball moved behind the left edge of the screen (2 s) and then the box emerged from behind the right edge and moved to the right end of the platform (2 s); the box paused (1 s) and then the event was seen in reverse. The entire 10 s ball-box cycle then repeated until the end of the trial. The test trial was 30 s in duration, hence infants saw three complete cycles of the ball-box event during each test trial. When in motion, the objects moved at a rate of 12 cm/s. The green ball-green box test event (shape change condition) and the green ball-red ball test event (color change condition) were identical to the ball-box test event except that the dotted ball and the red decorated box were replaced with the green ball and the green box or the green ball and the red ball, respectively. The green ball-green ball test event (control condition, not shown here), was produced the same way as the other test events except using two identical green balls.
Method
Participants
Thirty-five 6.5-month-olds, 21 M (M age = 6 months, 17 days, range = 5 months, 12 days to 7 months, 22 days). Twelve additional infants were tested but eliminated from analysis because they failed to contribute any NIRS data for one of the following reasons: large motion artifacts in the signals (N = 6), obstruction by hair (N = 2), or procedural problems (N = 4). Another group of infants (N = 6) were tested but eliminated because data were available for only one of the two brain regions (i.e., the signal-to-noise ratio was prohibitive in the other area). Infants were randomly assigned to one of the four conditions: multi-featural change (N = 8), shape change (N = 8), color change (N = 10), or control (N = 9).
Apparatus and Stimuli
The apparatus consisted of a wooden cubicle 213 cm high, 105 cm wide and 43.5 cm deep. The infant sat on a parent's lap facing an opening 51 cm high and 93 cm wide in the front wall of the apparatus; the infant's head was approximately 78 cm from the objects on the platform. The floor and the walls of the apparatus were cream or covered with lightly-patterned contact paper. A platform 1.5 cm high, 60 cm wide, and 19 cm deep lay 4.5 cm from the back wall and centered between the left and right walls. A slit in the back wall, concealed by cream fringe, enabled the experimenter to reach into the apparatus and move the objects along the platform.
The ball used in the ball-box event was 10.25 cm in diameter and painted green with yellow, blue, and red dots. The box was 10.25 cm square, red, and decorated with silver thumbtacks. The objects used in the green ball-green box event were identical to those of the ball-box event except that both were green, without pattern or decoration. The balls used in the green ball-red ball event were green and red, respectively, without pattern or decoration and were equal in luminance (35 cd/m2). The two green balls used in the control condition were identical to the green ball just described. The screen was 21.5 cm high and 30 cm wide and made of blue cardboard.
A muslin-covered shade was lowered in front of the opening in the front wall of the apparatus at the end of each trial and remained lowered until the beginning of the next trial. Two muslin-covered wooden frames, each 213 cm high and 68 cm wide, stood at an angle on either side of the apparatus. These frames isolated the infant from the experimental room. To illuminate the stage, a 20-watt fluorescent bulb was affixed inside each wall of the apparatus. No other lighting was used.
The amount of time infants spent looking at the test event was recorded and looking time data were time-locked to the NIRS data. Looking behavior was monitored by two observers who watched the infant through peepholes in the muslin-covered frames on either side of the apparatus. Interobserver agreement was measured for 24 of the infants and averaged 94%.
Infants were presented with four test trials appropriate for their condition. Each trial was 30 s in duration. Because analysis of the NIRS data requires baseline recordings of the measured intensity of refracted light, prior to each trial infants were also presented with a 10 s silent pause during which time no event was presented. A final 10 s silent pause followed the last trial. Finally, because failure to visually attend to the event could result in a decrease in hemodynamic response in O and/or IT, the looking time data were inspected for trials in which the infant accumulated less than 20 s looking time. There were 5 trials (of 140 possible) that failed to meet the behavioral criteria and were eliminated from analysis.
Instrumentation
The imaging equipment contained three major components: (1) two fiber optic cables that delivered near-infrared light to the scalp of the participant (i.e., emitters); (2) four fiber optic cables that detected the diffusely reflected light at the scalp (i.e., detectors); and (3) an electronic control box that served both as the source of the near-infrared light and the receiver of the reflected light.
The electronic control box produced light at 690 and 830 nm wavelengths with two laser-emitting diodes (Boas et al., 2002. TechEn Inc.). Laser power emitted from the end of the diode was 4 mW. Light was square wave modulated at audio frequencies of approximately 4 to 12 kHz. Each laser had a unique frequency so that synchronous detection could uniquely identify each laser source from the photodetector signal. Ambient illumination from the testing room did not interfere with the laser signals because environmental light sources modulate at a different frequency. The two fiber optic cables that delivered the light from the control box to the headgear (see below) were 1 mm in diameter and 5 m in length. The four fiber optic cables that detected the diffusely reflected light at the scalp and transmitted it to the control box were also 1 mm in diameter and 5 m in length. Each emitter delivered both wavelengths of light (690 and 830 nm) and each detector responded to both wavelengths. The signals received by the electronic control box were processed and relayed to a DELL Inspiron 7000™ laptop computer. A custom computer program recorded and analyzed the signal. Additional details about the NIRS equipment can be found in Franceschini, Joseph, Huppert, Diamond. & Boas (2006) and Joseph, Huppert, Franceschini, & Boas (2006), who used a similar instrument except with a larger number of emitters and detectors.
Prior to presentation of the test events, infants were fitted with custom-made headgear that secured the fiber optics to the scalp. The ends of the fiber optic cables were arranged in two triads. Each triad consisted of one emitter and two detectors embedded in non-elastic rubberized material. Detectors were positioned equidistant, in the horizontal plane, from the emitters with an emitter-detector distance of 2 cm. The triads were then attached to an elasticized terry cloth headband. Triad placement was based on the International 10/20 system for EEG recording (Figure 2) and was identical to that of Wilcox et al. (2005). (See Okamoto et al. (2004) for evidence that this is a reliable method for locating targeted neural areas from the surface of the skull.) The emitter of the triad used to assess O activation was positioned midway between O1 and O2 (directly above the inion). The emitter of the triad used to assess IT activation was positioned at T3 (directly above, and slightly behind, the left ear).
Figure 2.
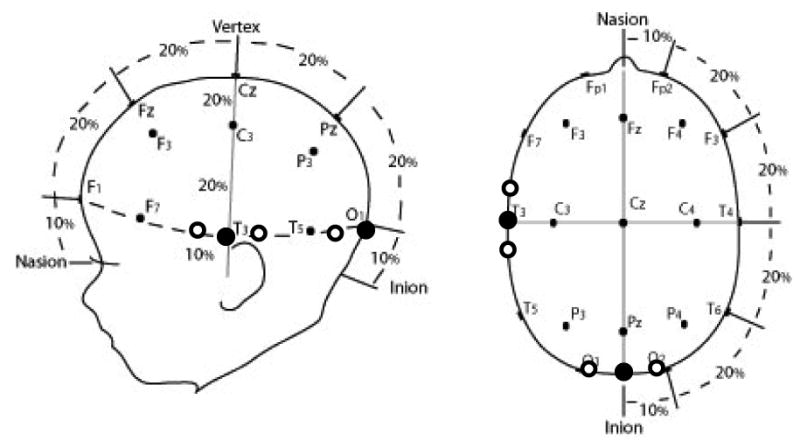
Locations at which the two emitters and their corresponding detectors were placed on the infant's skull using the International 10-20 system for electrophysiological recordings. Enclosed circles represent emitters and open circles detectors.
Analysis of the NIRS Data
The NIRS data were analyzed, for each neural area separately, using a procedure similar to that of Wilcox et al. (2005). Briefly, the raw signals were acquired at the rate of 200 samples per second, digitally low-pass-filtered at 10.0 Hz, a principal components analysis was used to design a filter for systemic physiology and motion artifacts, and the data were converted to relative concentrations of oxygenated (HbO2) and deoxygenated (HbR) blood using the modified Beer-Lambert law (Strangman, Boas, & Sutton, 2002). Changes in HbO2 and HbR were analyzed using 45 s time epochs composed of the following components: the 5 s immediately prior to the onset of the test event, the entire 30 s test event, and the 10 s immediately following the test event. The optical signals during the 45 s epoch were first averaged across the two detectors at each location. They were then averaged across the 4 test trials for each participant and across participants for each condition. Trials that were objectively categorized as containing motion artifacts (Wilcox et al., 2005) were eliminated from the mean. A total of 5 trials (of 135 remaining) were eliminated.
Results
Looking Time Data
The infants' looking times during the test trials were averaged across trial and infant for each condition (multi-featural change, M = 28.04, SD = 1.86; shape change, M = 27.81, SD = 1.47, color change, M = 27.64, SD = 2.37; control, M = 26.84, SD = 1.62). The infants in all four conditions looked almost continuously throughout the test trials, suggesting that they found all four events engaging.
NIRS Data
The hemoglobin concentration response curves are shown in Figure 3. Given evidence that HbO2 is a more robust and reliable measure of neural activation than HbR or HbT (Bartocci et al., 2001; Chen et al., 2002; Hoshi &Tamura, 1993; Jasdzewski et al., 2003; Kato et al., 1993; Sakatani et al., 1999; Strangman et al., 2002, 2003), we focused on HbO2 in our statistical analyses. For comparison purposes, however, the mean HbO2, HbR and HbT responses are reported in Table 1. Relative changes in HbO2 concentration from 5 to 30 s following initiation of the event (prior to 5 s the hemodynamic response is still being initiated) were compared to the baseline from -1 to 0 s (Figure 4). As predicted, the infants in all four conditions demonstrated a significant increase in HbO2 in occipital cortex in response to the occlusion event (see figure caption). A one-way analysis of variance (ANOVA) was conducted with condition as the between-subjects factor. The effect of condition was not significant, F(1, 31) < 1. Planned comparisons revealed that the mean HbO2 response observed in the control condition did not differ reliably from that observed in the multi-featural, shape, and color change conditions, all Fs(1,31) < 1. Although qualitative inspection of the data suggests that the response magnitude observed in the color change condition was lower than that observed in the other three conditions, this outcome was not predicted nor did it reach significance. Follow-up research will be needed to establish the extent to which this outcome is reliably observed in object processing tasks.
Figure 3.
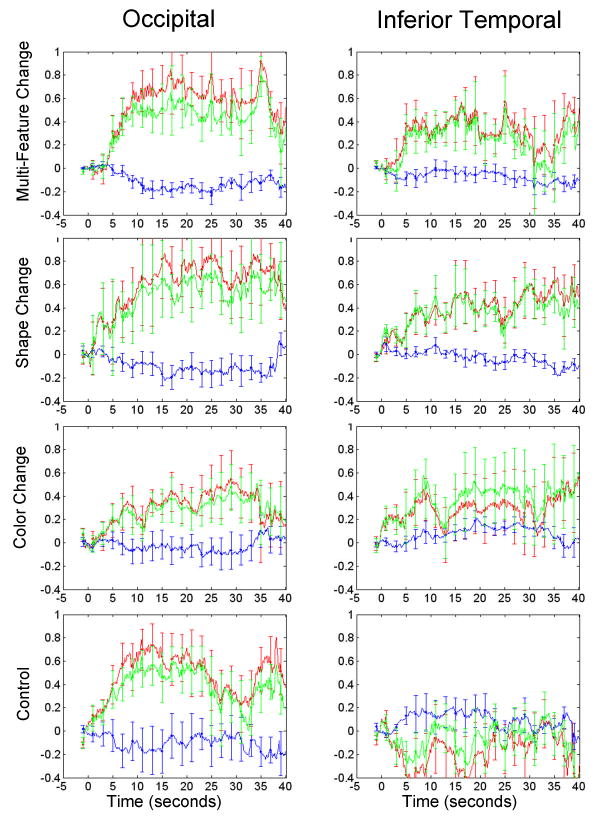
Hemoglobin response curves averaged across subjects and trials (with SE bars) for the occipital and inferior temporal cortices. Each row shows the response curves, in optical density units, for the indicated condition. The event began at time 0 and continued for 30 seconds. HbO2, HbR, and HbT are indicated by the red, blue, and green lines respectively.
Table 1.
Relative changes in HbO2, HbR and HbT concentration following initiation of the test event, by neural region and condition. Cells contain M (SE) optical density units averaged from 5 to 30 s.
| Neural Region | Condition | |||
|---|---|---|---|---|
| Multi-Featural Change | Shape Change | Color Change | Control | |
| Occipital | ||||
| HbO2 | .599 (.15) | .651 (.25) | .353 (.14) | .552 (.17) |
| HbR | -.147 (.05) | -.119 (.08) | -.051 (.10) | -.102 (.16) |
| HbT | .470 (.14) | .531 (.25) | .301 (.14) | .450 (.17) |
| Inferior Temporal | ||||
| HbO2 | .367 (.14) | .398 (.15) | .288 (.22) | -.203 (.22) |
| HbR | -.049 (.06) | -.010 (.04) | .105 (.06) | .127 (.11) |
| HbT | .318 (.16) | .387 (.14) | .394 (.25) | -.075 (.16) |
Figure 4.
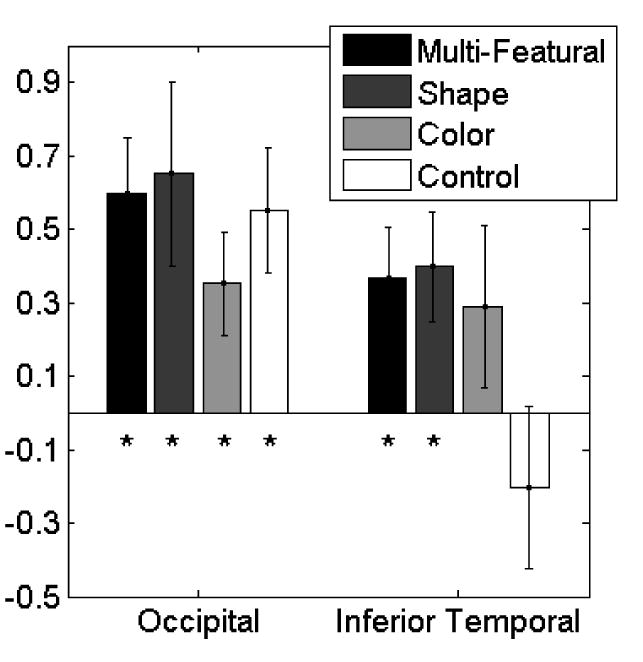
The mean (and SE) oxyhemoglobin (HbO2) response for each condition and brain region, reported in optical density units. Responses were compared to a mean value of 0. The ‘*” indicates those responses that are significantly different from 0 using a two-tailed t-test and an alpha level of .05. For occipital cortex: box-ball, t = 4.01, df = 7, p = .005, green ball-green box, t = 2.62, df = 7, p = .035, red ball-green ball, t = 2.44, df = 9, p = .037, and green ball-green ball, t = 3.18, df = 8, p = .013. For inferior temporal cortex: box-ball, t = 2.55, df = 7, p = .038, green ball-green box, t = 2.58, df = 7, p = .037, red ball-green ball, t = 1.32, df = 9, p = .220, and green ball-green ball, t < 1, df = 8.
A different pattern of responses were observed in IT (Figure 3). The infants in the multi-featural and the shape change condition evidenced a significant increase in HbO2 (Figure 3). The infants in the color change condition also evidenced an increase in HbO2 but this increase did not differ significantly from 0. In contrast, the infants in the control condition evidenced a small, non-significant decrease in HbO2. A one-way ANOVA did not yield a significant effect of condition, F(1, 31) = 2.06, p = .127, ŋp2 = .17. However, planned comparisons indicated that the hemodynamic response observed in the control condition differed from that observed in the shape condition, F(1,31) = 4.54, p = .041, and the multi-featural condition, F(1,31) = 4.10, p = .052, although the latter was only marginally significant. In contrast, the hemodynamic response observed in the control condition did not differ reliably from that observed in the color condition, F(1,31) = 3.40, p = .075. A final comparison revealed that that the hemodynamic response observed in the shape condition did not differ significantly from that observed in the color condition, F (1,31) < 1.
Together, these results suggest several conclusions. First, neural activation, as measured by the hemodynamic response, is observed in O in response to occlusion events involving objects, regardless of whether the objects seen to each side of the screen are identical or vary on one or more feature dimensions. Second, the degree of neural activation observed in IT depends on the feature dimension manipulated. When the objects seen to each side of the screen differ on many dimensions or on shape only, a significant increase in neural activation is observed and these responses differ from those observed when the same object is seen to both sides of the screen. When the objects differ in color only, an increase in neural activation is observed but this increase does not differ significantly from baseline. Qualitative inspection of the data suggests that a color change does lead to some degree of activation in IT as compared to no change, but that the magnitude of the response is not as great as that observed in response to a shape change. However, statistical tests comparing the responses of the infants in the color change condition to those of the infants in the shape change and the control condition were not significant.
This outcome leads to the third conclusion, which is that between-subjects' designs do not offer sufficient power to test the type of hypotheses we proposed. We employed a between-subjects design because this is the design we typically use in our behavioral studies, with sample sizes similar to those reported here, and we typically have sufficient power to test for differences between conditions. However, the NIRS data contain greater between-subject variability than that typically observed in our behavioral work. We anticipate that as we improve on probe and headband design the quality of the data will improve, resulting in greater statistical power. At the same time, there are some factors over which we have little control that also contribute to between-subject variability. For example, given what we know about the structural organization of the adult brain, we expect that there are individual differences in the size and location of the neural regions under study. Although we use the most reliable system currently available for probe positioning, there is no guarantee that the location of the underlying cortical structures, in relation to external (e.g., skull) markers is the same for each infant. Until more accurate methods become available, we plan to continue to use the 10-system and employ within-subjects designs to decrease one source of variability.
Discussion
A significant increase in HbO2 was observed in the occipital cortex in response to all four occlusion sequences: ball-box, green ball-green box, green ball-red ball, and green ball-green ball. These results, along with those of Wilcox et al. (2005), are consistent with other reports that robust hemodynamic responses can be obtained in occipital cortex in response to visual stimuli (Taga et al., 2003) and suggest that NIRS can be used reliably to assess neural activation in the occipital cortex during visual object processing tasks. One direction for future research is to investigate the extent to which areas within the visual cortex respond selectively to specific features. For example, it is possible that V4, which is important to color perception (McKeefry & Zeki, 1997; Zeki, 1980), would respond more robustly to color than shape differences. This type of approach would allow us to map the functional development of visual cortical areas and the role they play in object processing during the first year of life.
A different pattern of results was obtained in the inferior temporal cortex. A significant increase in HbO2 was observed in response to the multi-featural and the shape change event and this increase differed from that observed in response to the control event. An increase in HbO2 was also observed in response to the color change event but this outcome did not differ significantly from baseline nor did it differ significantly from that observed in response to the control event. Although statistical analyses involving the color data failed to reach significance, this negative outcome needs to be interpreted with caution. First, the infants in the color change condition also evidenced a lesser magnitude of HbO2 increase in visual cortex than the infants in the multi-featural and shape change condition. Second, statistical power was limited by the methodological design employed. A within-subjects design would offer greater statistical power with which to test subtle differences in the hemodynamic response.
In summary, although our hypotheses were not fully supported and questions remain about the extent to which IT is involved in the processing of color differences in occlusion events, these findings demonstrate for the first time that the hemodynamic response observed in IT is selective (i.e., a response was observed when the objects seen to opposite sides of an occluder differed in their featural properties but not when they were identical). Hence, it appears that NIRS is sufficiently sensitive to assess the neural basis of object processing in infants. We are confident that as our methodology improves we will continue to advance towards our long-term goal, which is to identify localized, functional development of visual object processing systems in the human infant.
Acknowledgments
This research was supported by HD 48943 to TW, the James S. McDonnell Foundation 21st Century Research Award, Bridging Brain, Mind, and Behavior and HD 046533 to HB, and P41-RR14075 to DB. We would like to thank Abby Howell, Sarah McCurry, Erin Miller, Brenna Walker, and the undergraduate assistants in the Infant Cognition Laboratory at Texas A&M University for their help with data collection and the parents who so graciously agreed to have their infants participate in the research.
Contributor Information
Teresa Wilcox, Texas A&M University.
Heather Bortfeld, Texas A&M University.
Rebecca Woods, Texas A&M University.
Eric Wruck, Texas A&M University.
David A. Boas, Anthinoula A. Martinos Center for Biomedical Imaging, Massachusetts General Hospital, Harvard Medical School
References
- Adams RJ, Maurer D. Detection of contrast by the newborn and 2-monthold infant. Infant Behavior and Development. 1984;7:415–422. [Google Scholar]
- Aguiar A, Baillargeon R. Developments in young infants' reasoning about occluded objects. Cognitive Psychology. 2002;45:267–336. doi: 10.1016/s0010-0285(02)00005-1. [DOI] [PMC free article] [PubMed] [Google Scholar]
- Arterberry ME, Yonas A. Perceptionof structure from motion by 8-week-old infants. Perception and Psychophysics. 2000;62:550–556. doi: 10.3758/bf03212106. [DOI] [PubMed] [Google Scholar]
- Baird AA, Kagan J, Gaudette T, Walz KA, Hershlag N, Boas DA. Frontal lobe activation during object permanence: Data from near-infrared spectroscopy. NeuroImage. 2002;16:1120–1126. doi: 10.1006/nimg.2002.1170. [DOI] [PubMed] [Google Scholar]
- Boucart M, Meyer ME, Pins D, Humphreys GW, Scheiber C, Gounod D, Foucher J. Automatic object identification: an fMRI study. Brain Imaging. 2000;11:2379–2383. doi: 10.1097/00001756-200008030-00009. [DOI] [PubMed] [Google Scholar]
- Bortfeld H, Wruck E, Boas DA. Assessing infants' cortical response to speech using near-infrared spectroscopy. Neuroimage. 2007;34:407–415. doi: 10.1016/j.neuroimage.2006.08.010. [DOI] [PMC free article] [PubMed] [Google Scholar]
- Chen S, Sakatani K, Lichty W, Ning P, Zhao S, Zuo H. Auditory-evoked cerebral oxygenation changes in hypoxic-ischemic encephalopathy of newborn infants monitored by near infrared spectroscopy. Early Human Development. 2002;67:113–21. doi: 10.1016/s0378-3782(02)00004-x. [DOI] [PubMed] [Google Scholar]
- Colombo J, Mitchell DW, Coldren JT, Freeseman LJ. Individuation differences in infant visual attention: Are short lookers faster processors or featural processors? Child Development. 1991;6:1247–1257. [PubMed] [Google Scholar]
- Clark VP, Parasuraman R, Keil K, Kulansky R, Fannon S, Maisog JM, Ungerleider LG, Haxby JV. Selective attention to face identity and color studied with fMRI. Human Brain Mapping. 1997;5:293–297. doi: 10.1002/(SICI)1097-0193(1997)5:4<293::AID-HBM15>3.0.CO;2-F. [DOI] [PubMed] [Google Scholar]
- Desimone R, Ungerleider LG. Neural mechanisms of visual processing in monkeys. In: Boller F, Grafman J, editors. Handbook of Neuropsychology. Vol. 2. Elsevier; NY: 1989. pp. 267–299. [Google Scholar]
- De Yoe EA, Van Essen DC. Concurrent processing streams in monkey visual cortex. Trends in Neuroscience. 1988;11:219–226. doi: 10.1016/0166-2236(88)90130-0. [DOI] [PubMed] [Google Scholar]
- Franceschini MA, Joseph DK, Huppert TJ, Diamond SG, Boas DA. Diffuse optical imaging of the whole head. Journal of Biomedical Optics. 2006;11(5):054007. doi: 10.1117/1.2363365. [DOI] [PMC free article] [PubMed] [Google Scholar]
- Gratton G, Goodman-Wood MR, Fabiani M. Comparison of neuronal and hemodynamic measures of the brain response to visual stimulation: An optical imaging study. Human Brain Mapping. 2001;13:13–25. doi: 10.1002/hbm.1021. [DOI] [PMC free article] [PubMed] [Google Scholar]
- Gratton G, Sarno A, Maclin E, Corballis PM, Fabiani M. Toward noninvasive 3-D imaging of the time course of cortical activity: Investigation of the depth of the event-related optical signal. NeuroImage. 2000;11:491–504. doi: 10.1006/nimg.2000.0565. [DOI] [PubMed] [Google Scholar]
- Grill-Spector K, Kushnir T, Hendler T, Edelman S, Itzchak Y, Malach R. A sequence of object-processing stages revealed by fMRI in the human occipital lobe. Human Brain Mapping. 1998;6:316–328. doi: 10.1002/(SICI)1097-0193(1998)6:4<316::AID-HBM9>3.0.CO;2-6. [DOI] [PMC free article] [PubMed] [Google Scholar]
- Hoshi Y, Tamura M. Dynamic multichannel near-infrared optical imaging of human brain activity. Journal of Applied Physiology. 1993;75:1842–1846. doi: 10.1152/jappl.1993.75.4.1842. [DOI] [PubMed] [Google Scholar]
- Jasdzewski G, Strangman G, Wagner J, Kwong KK, Poldrack RA, Boas DA. Differences in the hemodynamic response to event-related motor and visual paradigms as measured by near-infrared spectroscopy. NeuroImage. 2003;20:479–488. doi: 10.1016/s1053-8119(03)00311-2. [DOI] [PubMed] [Google Scholar]
- Joseph DK, Huppert TJ, Franceschini MA, Boas DA. Diffuse optical tomography system to image brain activation with improved spatial resolution and validation with functional magnetic resonance imaging. Applied Optics. 2006;45:8142–8151. doi: 10.1364/ao.45.008142. [DOI] [PubMed] [Google Scholar]
- Kato T, Kamei A, Takashima S, Ozaki T. Human visual cortical function during photic stimulation monitoring by means of near-infrared spectroscopy. Journal of Cerebral Blood Flow and Metabolism. 1993;13:516–520. doi: 10.1038/jcbfm.1993.66. [DOI] [PubMed] [Google Scholar]
- Kleinschmidt A, Obrig H, Requardt M, Merboldt KD, Dirnagl U, Villringer A, Frahm J. Simultaneous recording of cerebral blood oxygenation changes during human brain activation by magnetic resonance imaging and near-infrared spectroscopy. Journal of Cerebral Blood Flow and Metabolism. 1996;16:817–826. doi: 10.1097/00004647-199609000-00006. [DOI] [PubMed] [Google Scholar]
- Kraut M, Hart J, Soher BJ, Gordon B. Object shape processing in the visual system evaluated using functional MRI. Neurology. 1997;48:1416–1420. doi: 10.1212/wnl.48.5.1416. [DOI] [PubMed] [Google Scholar]
- Livingstone M, Hubel D. Psychophysical evidence for separate channels for the perception of form, color, movement, and depth. Journal of Neuroscience. 1987;7:3416–3468. doi: 10.1523/JNEUROSCI.07-11-03416.1987. [DOI] [PMC free article] [PubMed] [Google Scholar]
- Livingstone M, Hubel D. Segregation of form, color, movement, and depth: Anatomy, physiology, and perception. Science. 1988;240:740–749. doi: 10.1126/science.3283936. [DOI] [PubMed] [Google Scholar]
- Maurer D, Salapatek P. Developmental changes in the scanning of faces by young infants. Child Development. 1976;47:523–527. [PubMed] [Google Scholar]
- McCurry S, Wilcox T, Woods R. Beyond the search barrier: New evidence for object individuation in young infants. 2006 doi: 10.1016/j.infbeh.2009.07.002. Manuscript under review. [DOI] [PMC free article] [PubMed] [Google Scholar]
- McKeefry DJ, Zeki S. The position and topography of the human colour centre as reveal by functional magnetic resonance imaging. Brain. 1997;120:2229–2242. doi: 10.1093/brain/120.12.2229. [DOI] [PubMed] [Google Scholar]
- Mishkin M, Ungerleider LG, Macko KA. Object vision and spatial vision: two cortical pathways. Trends in Neuroscience. 1983;6:414–417. [Google Scholar]
- Needham A. The role of shape in 4-month-old infants' segregation of adjacent objects. Infant Behavior and Development. 1999;22:161–178. [Google Scholar]
- Okamoto M, Dan H, Sakamoto K, Takeo K, Shimizu K, Kohno S, et al. Three-dimensional probabilistic anatomical cranio-cerebral correlation via the international 10-20 system oriented for transcranial functional brain mapping. Neuroimage. 2004;21:99–111. doi: 10.1016/j.neuroimage.2003.08.026. [DOI] [PubMed] [Google Scholar]
- Peña M, Maki A, Kovacic D, Dehaene-Lambertz G, Koizumi H, Bouquet F, Mehler J. Sounds and silence: An optical topography study of language recognition at birth. Proceedings of the National Academy of Sciences. 2003;100:11702–11705. doi: 10.1073/pnas.1934290100. [DOI] [PMC free article] [PubMed] [Google Scholar]
- Sakatani K, Chen S, Lichty W, Zuo H, Wang Y. Cerebral blood oxygenation changes induced by auditory stimulation in newborn infants measured by near infrared spectroscopy. Early Human Development. 1999;55:229–236. doi: 10.1016/s0378-3782(99)00019-5. [DOI] [PubMed] [Google Scholar]
- Slater A, Morison V. Shape constancy and slant perception at birth. Perception. 1985;14:337–344. doi: 10.1068/p140337. [DOI] [PubMed] [Google Scholar]
- Slater A, Morison V, Somers M, Mattock A, Brown E, Taylor D. Newborn and older infants' perception of party occluded objects. Infant Behavior and Development. 13:33–49. [Google Scholar]
- Slater A, Morison V, Town C, Rose D. Movement perception and identity constancy in the new-born baby. British Journal of Developmental Psychology. 1985;3:211–220. [Google Scholar]
- Spelke ES. Perception of unity, persistence, and identity: Thoughts on infants' conceptions of objects. In: Mehler J, Fox R, editors. Neonate Cognition: Beyond the Blooming Buzzing Confusion. Lawrence Erlbaum; Hillsdale, NJ: 1985. pp. 89–114. [Google Scholar]
- Stephens BR, Banks MS. Contrast discrimination in human infants. Journal of Experimental Psychology: Human Perception and Performance. 1987;13:558–565. doi: 10.1037//0096-1523.13.4.558. [DOI] [PubMed] [Google Scholar]
- Strangman G, Boas DA, Sutton JP. Non-invasive neuroimaging using near-infrared light. Biological Psychiatry. 2002;52:679–693. doi: 10.1016/s0006-3223(02)01550-0. [DOI] [PubMed] [Google Scholar]
- Strangman G, Culver JP, Thompson JH, Boas DA. A quantitative comparison of simultaneous BOLD fMRI and NIRS recordings during function brain activation. NeuroImage. 2002;17:719–731. [PubMed] [Google Scholar]
- Strangman G, Franceschini MA, Boas DA. Factors affecting the accuracy of near-infrared spectroscopy concentration calculations for focal changes in oxygenation parameters. NeuroImage. 2003;18:865–879. doi: 10.1016/s1053-8119(03)00021-1. [DOI] [PubMed] [Google Scholar]
- Taga G, Asakawa K, Maki A, Konishi Y, Koizumi H. Brain imaging in awake infants by near-infrared optical topography. Proceedings of the National Academy of Sciences. 2003;100:10722–10727. doi: 10.1073/pnas.1932552100. [DOI] [PMC free article] [PubMed] [Google Scholar]
- Tanaka K. Mechanisms of visual object recognition: monkey and human studies. Current Opinion in Neurobiology. 1997;7:523–529. doi: 10.1016/s0959-4388(97)80032-3. [DOI] [PubMed] [Google Scholar]
- Tanaka K. Mechanisms of visual object recognition studied in monkeys. Spatial Vision. 2000;13:147–163. doi: 10.1163/156856800741171. [DOI] [PubMed] [Google Scholar]
- Tremoulet PD, Leslie AM, Hall GD. Infant individuation and identification of objects. Cognitive Development. 2001;15:499–522. [Google Scholar]
- Tsunoda K, Yamane Y, Nishizaki M, Tanifuji M. Complex objects are represented in macaque inferotemporal cortex by the combination of feature columns. Nature Neuroscience. 2001;4:832–838. doi: 10.1038/90547. [DOI] [PubMed] [Google Scholar]
- Ungerleider LG, Mishkin M. Two cortical visual systems. In: Ingle DJ, Goodale MA, Mansfield RJW, editors. Analysis of visual behavior. Cambridge, MA: MIT Press; 1982. pp. 549–586. [Google Scholar]
- Van Essen DC, Anderson CH, Felleman DJ. Information processing in the primate visual system: an integrated systems perspective. Science. 1992;255:419–423. doi: 10.1126/science.1734518. [DOI] [PubMed] [Google Scholar]
- Villringer A, Chance B. Non-invasive optical spectroscopy and imaging of human brain function. Trends in Neuroscience. 1997;20:435–442. doi: 10.1016/s0166-2236(97)01132-6. [DOI] [PubMed] [Google Scholar]
- Villringer A, Minoshima S, Hock C, Obrig H, Ziegler S, Dirnagl U, et al. Assessment of local brain activation. A simultaneous PET and near-infrared spectroscopy study. Adv Exp Med Biol. 1997;413:149–153. [PubMed] [Google Scholar]
- Wang G, Tanaka K, Tanifuji M. Optical imaging of functional organization in the monkey inferotemporal cortex. Science. 1996;272:1665–1668. doi: 10.1126/science.272.5268.1665. [DOI] [PubMed] [Google Scholar]
- Wang G, Tanifuji, Tanaka K. Functional architecture in monkey inferotemporal cortex revealed by in vivo optical imaging. Neuroscience Research. 1998;31:33–46. doi: 10.1016/s0168-0102(98)00062-5. [DOI] [PubMed] [Google Scholar]
- Wilcox T. Object individuation: Infants' use of shape, size, pattern, and color. Cognition. 1999;72:125–166. doi: 10.1016/s0010-0277(99)00035-9. [DOI] [PubMed] [Google Scholar]
- Wilcox T, Baillargeon R. Object individuation in infancy: The use of featural information in reasoning about occlusion events. Cognitive Psychology. 1998a;37:97–155. doi: 10.1006/cogp.1998.0690. [DOI] [PubMed] [Google Scholar]
- Wilcox T, Baillargeon R. Object Individuation in young infants: Further evidence with an event monitoring task. Developmental Science. 1998b;1:127–142. [Google Scholar]
- Wilcox T, Bortfeld H, Woods R, Wruck E, Boas DA. Using nearinfrared spectroscopy to assess neural activation during object processing in infants. Journal of Biomedical Optics. 2005;10:0110101-9–0110101-10. doi: 10.1117/1.1852551. [DOI] [PMC free article] [PubMed] [Google Scholar]
- Wilcox T, Chapa C. Priming infants to attend to color and pattern information in an individuation task. Cognition. 2004;90:265–302. doi: 10.1016/s0010-0277(03)00147-1. [DOI] [PMC free article] [PubMed] [Google Scholar]
- Wilcox T, Woods R. Experience primes infants to individuate objects: Illuminating learning mechanisms. In: Needham A, Woodward A, editors. Learning and the Infant Mind. in press. To appear in. [Google Scholar]
- Wilcox T, Woods R, Chapa C, McCurry S. Multisensory exploration and object individuation in infants. Developmental Psychology. doi: 10.1037/0012-1649.43.2.479. in press. [DOI] [PMC free article] [PubMed] [Google Scholar]
- Zeki SM. The representation of colours in the cerebral cortex. Nature. 1980;284:412–418. doi: 10.1038/284412a0. [DOI] [PubMed] [Google Scholar]