Abstract
The in vivo bioreactor is a hermetically sealed, acellular hydroxyapatite scaffold coated with growth factors that has a pulsating vascular pedicle leash threaded through its center. Tissue-engineered bone is created in weeks while the bioreactor remains embedded under the skin of an animal. The bioreactor also provides a model to study osteogenesis and pathologic scenarios such as tumor progression and metastasis by creating a controlled microenvironment that makes skeletogenesis amenable to genetic and physical manipulation. Animal euthanasia is required to quantitate bioreactor osteogenesis through histomorphometry. Nondestructive measures of new bone growth within the bioreactor are critical to future applications and are the primary questions posed in this study. We compared microcomputed tomography and micro-MRI assessments of bioreactor osteogenesis with conventional histomorphometric measurements in 24 bioreactors and asked if new bone formation could be calculated while the animal was alive. Microcomputed tomography visually, but not numerically, differentiated engineered new bone on its coral scaffold. Dynamic contrast-enhanced micro-MRI demonstrated augmented vascular flow through the bioreactor. Three-dimensional imaging can nondestructively detect tissue-engineered osteogenesis within the implanted bioreactor in vivo, furthering the usefulness of this unique model system.
Introduction
Tissue-engineered skeletogenesis is the biology of stem cell recruitment combined with surgery to create a piece of structural bone that can be studied, manipulated, or transplanted. The in vivo bioreactor consists of a surgically implanted vascularized coral hydroxyapatite scaffold in which bone production has been accelerated with the addition of bone morphogenetic protein 2 (BMP2). Using historical precedents [3, 9, 10], we created a reliable in vivo bioreactor sealed from the host’s surrounding tissues except for a lone vascular pedicle that reproducibly produces new bone.
However, studies of bone formation typically require animal euthanasia at each time point for histomorphometric analysis and larger numbers of animals owing to the variability. Ideally, we would have a method to study animals longitudinally and assess skeletogenesis without disturbing the process. Microimaging of rodent bioreactors using computed tomography (CT) and MRI are two such approaches that might allow noninvasive longitudinal assessments.
We measured osteogenesis in the bioreactor by an invasive (gold standard) and two noninvasive techniques. We hypothesized noninvasive imaging would prove as accurate a measure as invasive determinations. We posed four questions in this study. First, what is the amount of bone produced in the bioreactor when measured by the gold standard and invasive technique of histomorphometry? What amount of bone is produced when measured by CT? What amount of bone is produced when measured by MRI? How do the CT and MRI measures compare with histomorphometry?
Materials and Methods
In this preliminary study, we used 12 adult (400 g or greater) male Sprague-Dawley rats (Harlan Sprague Dawley, Inc, Indianapolis, IN) that underwent implantation of 24 bioreactors. In one groin, an experimental bioreactor was surgically inserted and its control into the contralateral groin. The right groin always had a vascularized bioreactor containing osteoinductive protein with osteoconductive scaffold (experimental), whereas the left groin contained only the osteoconductive scaffold on its vascular pedicle (control). The rats were imaged at 4, 8, and 12 weeks, but four were randomly euthanized at each time interval to compare invasive with noninvasive measurements of bioreactor bone formation (leaving four for imaging at each subsequent time period). Euthanasia was performed by CO2 gas asphyxiation. All animals were housed, anesthetized, had surgery, and were euthanized according to animal research protocols approved by the Institutional Animal Care and Use Committee at Vanderbilt University (#M/0206/257).
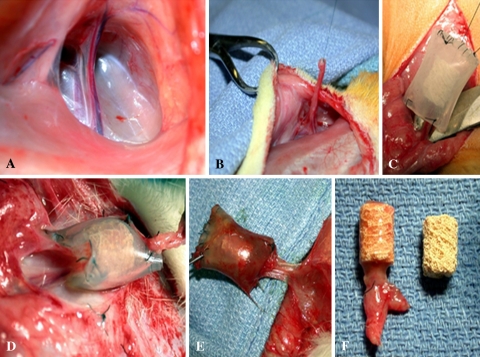
The rats were anesthetized with isofluorane anesthesia. Cefazolin (Ancef; GlaxoSmithKline, Research Triangle Park, NC) at 50 mg/kg by intramuscular injection and 2.5 mg/kg flunixin subcutaneously were administered. After sterile preparation, a 5-cm midline abdominal incision was made without violating abdominal musculature. The femoral vessels were identified and the superficial inferior epigastric artery and vein dissected free per Holt and coworkers [6]. The distal end of the pedicle was tied and ligated and thread attached to its tip. The proximal portion of the pedicle remained attached to the circulatory tree. The pedicle was then threaded through the central core of the scaffold and secured by tying the suture to the tubing surrounding the scaffold (Fig. 1A–F).
Fig. 1A–F.
Surgical technique for implantation and retrieval of the bioreactor. (A) A midline ventral incision is made in the rat abdomen. (B) The superficial inferior epigastric artery and vein are isolated and ligated. (C) The pedicle is threaded through the bioreactor (coral cylinder ± soak loaded with bone morphogenetic protein 2 and encased within plastic tubing). (D) At 6 weeks, the bioreactor is harvested. (E) The pedicle is dissected and transected to ensure pulsatile bleeding. (F) The coral is retrieved. Vascularized scaffolds show obvious tissue in-growth as compared with controls.
Cylindrical scaffolds measuring 8 mm in diameter by 10 mm in height had a 1.75-mm central core constructed from hydroxyapatite ProOsteon 500 (Interpore-Cross, Irvine, CA). ProOsteon 500 is derived from the trabecular exoskeleton of marine coral and chemically converted to a hybrid mixture of hydroxyapatite (90%) and calcium carbonate-calcium-triphosphate. The median pore diameter of the crystal is 430 μm. Scaffolds were encased within silastic laboratory tubing (Dow-Corning, Fisher Scientific International Midland, MI) with an internal diameter of 9.5 mm and wall thickness of 1.6 mm. The tubing was heat-sterilized and the scaffold was placed inside this tubing and the distal end closed with 5.0 Ethilon suture allowing space for a vascular conduit at the proximal end where the pedicle entered. The tubing therefore sealed the external environment from the bioreactor. Implants were supplemented by bathing the scaffold in a normal saline-protein solution for 5 minutes (soak-loading) with BMP2 (R&D Systems, Minneapolis, MN) at a concentration of 0.02 mg/mL and placed on the right side. This was performed one time only, just before surgical implantation. A nonprotein-supplemented scaffold and pedicle was inserted into the left groin through an identical procedure. Thus, 12 rats were used and each had a control and experimental bioreactor in situ. The BMP concentration and the time points at which the analysis of the bone production was performed were determined from a published study [6]. Budgetary constraints forced us to use a low concentration of BMP at 0.02 mg/mL.
The animals were returned to their cages and monitored for any signs of wound infection, dehiscence, or pain. At 4, 8, and 12 weeks, four rats were randomly removed from their cages and prepared for study. At each of these three time points, the rats had their bioreactors imaged using micro-CT and then micro-MRI. After imaging, the animals were brought to the operating suite and, through a midline incision, both bioreactors and superficial inferior epigastric pedicles were dissected free from the surrounding tissues.
The pedicles were cut to document pulsatile bleeding, which occurred in all 24 bioreactors. Pedicle patency was determined by pulsatile flow on harvest before euthanizing the animals and by the presence or absence of a postmortem clot within the easily identified central pedicle. The scaffolds were then cut from their silicon tubing. Fresh samples were fixed in 70% alcohol at 4°C for 5 days and dehydrated through an ethanol gradient followed by defatting in xylene. The samples were embedded in Technovit 7200 (Exakt Technologies, Oklahoma City, OK). We cut several 7-micron thick sections with an Exakt diamond cutting microtome (Exakt Technologies) and placed each on Superfrost Plus slides (Erie Scientific, Portsmouth, NH) to obtain mineralized (undemineralized) sections. The slides were stained with Masson-Goldner, toluidine blue, and Von Kossa stains per standard protocols.
We (GEH, JLH, HSS) performed histomorphometric analysis on three segments of the bioreactor. The bioreactor was divided into proximal, middle, and distal sectors relative to the entry site of the vascular pedicle. Each of those three sectors had three microsections cut for analysis. Each microsection was 7 μm thick; thus, each bioreactor had nine sections histomorphometrically analyzed. Bone formation was quantified in these mineralized bone preparations using Image ProPlus version 4.5 (Media Cybernetics, Silver Springs, MD). The amount of bone produced was expressed as a percentage by calculating the area of new bone divided by the total cross-sectional area and multiplying by 100. The seven sections (of nine total) with the greatest amount of bone produced were averaged for each bioreactor. Often, the most distant sections did not fill with bone until the latest time points.
Micro-CT imaging was performed at a voltage of 80 kvp with an anode current of 500 μA. Acquisition parameters were as follows: 360 steps, serial and parallel benefactor equal to 4, exposure time equal to 600 ms, window size = 30722, and acquisition matrix = 5122. The micro-CT (Enhanced Vision Systems EVS RS-9 London, Ontario, Canada) creates volume-type “slices” with a resolution of approximately 50 μm. This allowed for section analysis in which bone production could be calculated similar to that in the histomorphometric analysis. We (GEH, JLH, HSS) analyzed three coronal and three axial three-dimensional micro-CT images looking for evidence of new bone growth over the porous coralline scaffold architecture. Parameters on the micro-CT machine were intentionally set to highlight the density of the new bone produced and make it distinct from the coral and surrounding soft tissue. The images were scanned looking for areas of osteogenesis or “regions of interest” (ROI). The ROI was centered around the pedicle such that there was one main ROI per CT slice. Graphic representations of ROIs, or tissue histograms, were generated to describe the relative quantity of tissue types located inside each of the nine slices or sections. New bone formation was calculated for each ROI, summed and averaged for the three slices in each of the three sectors per bioreactor, and then compared relative to time 0. This allowed for calculation of the percent change of new bone formed at each time point. Often, at the early time points, bone was not present at the distant sectors so the top seven slices with the most bone produced were used preferentially.
MRI dynamic contrast-enhanced (DCE) imaging was used to determine the changes in vascularity over time in the BMP2-supplemented bioreactor compared with the nonprotein-supplemented scaffold. Micro-MRI used a Varian 4.7 Tesla scanner (Varian Inc, Palo Alto, CA) with a 63-mm quadrature birdcage coil at the 4-, 8-, and 12-week postimplantation time points. The bioreactor was imaged in the axial plane to create between 12 and 20 slices. The MRI imaging parameters were: (repetition time/echo time/alpha angle) TR/TE/alpha = 200 μsec/3 μsec/30°, field of view = 45 mm2, slice thickness = 1.5 mm, matrix = 1282 NEX = 4. A bolus of 0.2 mmol/kg Magnevist was delivered in 30 seconds through a tail vein catheter to measure enhanced vascular flow. Parametric maps of maximal change and signal intensity after contrast injection were calculated as an estimate of tissue perfusion. We (CJD, GEH, CCL) conducted ROI analysis on healthy muscle tissue, the pedicle itself, and the evolving vascular tree arborizing within the bioreactor. Collecting images before and after the injection of contrast yielded a signal intensity time course for each voxel that was then analyzed by enhancement of characteristics. To analyze the enhancement, we chose the semiquantitative method of computing the initial area under the curve (IAUC). This method is reportedly a sensitive approach for assessing changes in vascularity for tumor treatment response in a reproducible fashion in animal models [2]. The IAUC was computed for each pixel and then scaled by the IAUC value taken from the ROI within the muscle, scaling each pixel’s IAUC value by that of a reference tissue. This served to eliminate the effects of differences in injection rate, heart rate, and other animal variables from study to study. Longitudinal analysis was conducted for each rat by selecting an ROI in the pedicle from the MRI slice containing the largest section of that vascular pedicle. Blood flow velocity through the reactor was determined relative to surrounding musculature and compared with control. Augmented blood flow was then calculated as a positive percent change and averaged for all rats at one time period. Control and experimental flow rates were determined. Flow rates in the ROIs were then plotted as a function of imaging week for each animal and the results averaged and displayed.
We used an unpaired t test to evaluate bone formation between the control and experimental bioreactors in each animal. The unpaired t test was used because a comparison was made between the bone produced in all the experimental bioreactors versus all the control bioreactors at a particular time point (four rats). This approach has more translational applications and is numerically more stringent than a paired t test, in which each animal serves as its own control. We used MedCalc software package (Version 9.4.2.0; Broekstratt 52, 9030 Mariakerke, Belgium).
Results
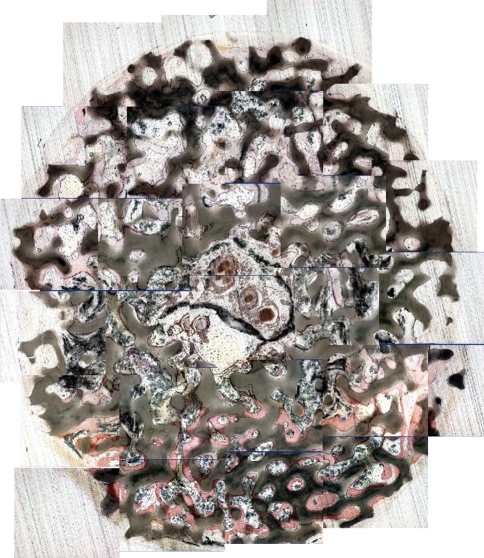
Histomorphometric analysis revealed more (p ≤ 0.0002 at 4, 8, and 12 weeks) bone produced in the BMP2-treated experimental bioreactor than in the scaffold alone [6]. The amount of bone produced increased with time (Table 1). The new bone produced began proximally at the pedicle side of the bioreactor and grew distally. Additionally, the new bone grew centrally from the central pedicle, peripherally toward the outside of the bioreactor. Increasing the concentration of BMP2 in the soak-loaded scaffold also increases the amount and rate of osteogenesis. New bone growth occurred at 4 weeks and was more robust at 12 weeks (Fig. 2). The non-BMP2-supplemented bioreactors produced no new bone (Table 1), but rather the scaffold was populated with small, numerous, vessels demonstrated on CD31 immunohistochemical staining (not pictured).
Table 1.
Bioreactor osteogenesis*
| Technique | Weeks | Control | Experimental | p Value | Standard error |
|---|---|---|---|---|---|
| Histomorphometry | 4 | 0.1 | 5.0 | 0.00008 | 0.25 |
| 8 | 0.24 | 6.3 | 0.0001 | 0.63 | |
| 12 | 0.7 | 14.3 | 0.0002 | 1.68 | |
| Microcomputed tomography | 4 | 10.1 | 10.3 | 0.86 | 1.10 |
| 8 | 12.2 | 12.5 | 1.00 | 1.57 | |
| 12 | 16.6 | 18.3 | 0.59 | 2.97 |
*The mean amount of new bone produced on the scaffold was calculated in two-dimensional area and expressed as percent increase compared with scaffold alone for the control and experimental limbs of the experiment; four animals for each cell.
Fig. 2.
A two–dimensional collage was created from the 5x images in one of the 12-week rats to represent an axial section of the coral implant sectioned with a diamond cutting microtome (Stain, toluidine blue; original magnification, x5); mineralized osteoid may be distinguished from coral.
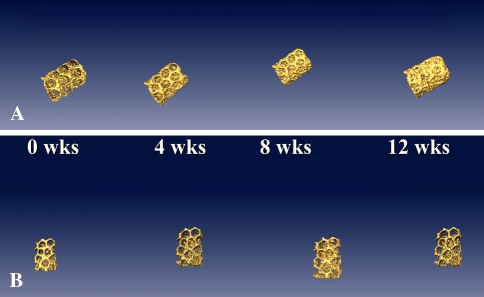
Three-dimensional micro-CT scanning of the living anesthetized rat bioreactors demonstrated impressive qualitative images of bone growth (Fig. 3). New bone growth in a BMP2 soak-loaded bioreactor occurred to a greater (p < 0.0001) degree than in the coral implant without BMP2 (Table 1). Once again, more bone was formed as a function of time. The coral architecture became gradually obscured by growing bone. Mathematical attempts to quantify the amount of new bone (on axial two-dimensional cuts or three-dimensional images) by altering the software detection and sensitivity did not reveal differences in bone growth in the BMP2 bioreactor. The computational analysis could not subtract out the coral substrate as a result of similar densities. As a result, the micro-CT calculations of new bone growth could not be differentiated from the coral (Table 1).
Fig. 3A–B.
Three-dimensional reconstructed images of the coral implants at weeks 0, 4, 8, and 12. (A) With bone morphogenetic protein 2 (BMP2), the coral becomes obscured by new bone growth. (B) Without BMP2, there was minimal bone formation.
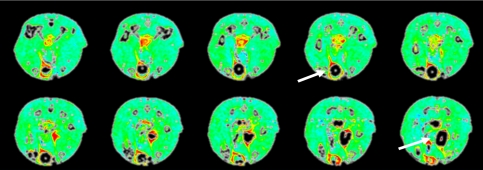
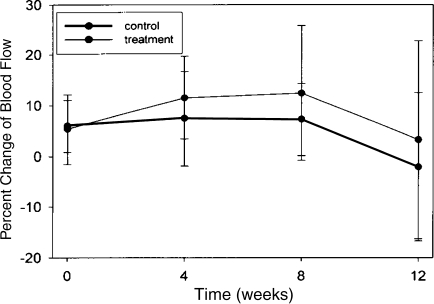
Dynamic MRI images show bright colors demonstrate rapid blood flow relative to surrounding muscle (Fig. 4). A graphic representation of flow rate differences is shown (Fig. 5). Mean augmented (p = 0.4) blood flow of approximately 10% occurred in the BMP2-enhanced pedicle compared with control, but this was only a trend. Possibly enhanced (p = 0.18) blood flow occurred at the earlier 4- and 8-week time points, but then diminished to baseline at the 12-week evaluation. The ROIs analyzed during micro-DCE MRI imaging illustrated the bioreactor blood flow. It allowed semiquantitative computing of the relative flow changes compared with normal surrounding muscle. We observed only a trend toward increase blood flow; 12% at 4 weeks (p = 0.2), 14% at 8 weeks (p = 0.16), and 4% at 12 weeks (p = 0.5) (Fig. 5).
Fig. 4.
Percent initial area under the curve (IAUC) dynamic contrast-enhanced MRI of a 4-week rat. Yellow and red colors demonstrate increased blood flow relative to surrounding muscle. Arrows indicate vascular pedicle.
Fig. 5.
Dynamic contrast-enhanced MRI summed results for all rats at all time periods. Percent change in blood flow relative to surrounding muscle was averaged for control and experimental bioreactors at each time period. The treatment bioreactors with bone morphogenetic protein 2 had similar blood flow at all time points examined.
Discussion
The hypothesis underlying these experiments was the osteogenesis occurring within the in vivo bioreactor recapitulates skeletogenesis. The new bone can be studied and manipulated such that immediate translational applications (tissue-engineered transplantation) and modeling (osteoblast biology, matrix biology, carcinoma-to-bone hematogenous metastases) scenarios can be studied. As the evolution and understanding of the in vivo bioreactor grows, the model will serve a utilitarian purpose to advance the understanding of osteogenesis and its microenvironment. We asked if three-dimensional imaging techniques such as micro-CT and micro-MRI could reproducibly quantitate osteogenesis in the bioreactor when compared with the gold standard of histomorphometric analysis. Because imaging is nondestructive and histomorphometry is destructive, micro-CT and MRI have obvious advantages to study bone production.
MRI worked better than CT at identifying osteogenesis in the bioreactor. CT was limited by the software’s inability to distinguish scaffold from new bone. Although axial slices and three-dimensional reconstructions of the bioreactor on micro-CT showed the porous structure rapidly filling with bone, we could not quantitate the difference. This had to do with the complex three-dimensional structure and chemical similarity of coral with bone. Qualitatively, more new bone was produced relative to the non-BMP2-treated bioreactor. However, despite multiple attempts by programmers and our radiology colleagues, we were unable to differentiate bone from coral in a quantitative manner. Consequently, the experiment worked, but we need to improve the sophistication of our sensing techniques.
Several elements are required to engineer the vitalized bone-producing in vivo bioreactor including: (1) an osteoconductive scaffold; (2) a vascular conduit for the delivery of stem cell progenitors; (3) osteoinductive proteins that accelerate the differentiation of stem cells into osteogenic cells [6]; and (4) a contained microcosm for osteogenesis, which allows for cell populations to grow into an organoid tissue. Our model consisted of a prefabricated cylindrical hydroxyapatite osteoconductive scaffold with a central core. The acellular scaffold was supplemented with BMP2. The scaffold’s central core was threaded with the rodent superficial inferior epigastric pedicle and implanted into the animal’s groin. Over time, stem cell progenitors were recruited from the circulation, extravasated from the vascular pedicle, populated into the bioreactor, differentiated into cells of an osteogenic phenotype, and formed bone [11]. This model was termed the in vivo bioreactor because ectopic bone was bioengineered on a vascular leash that was isolated from surrounding tissues with a plastic seal.
Histomorphometric assessment has traditionally been the gold standard for evaluation of bone formation. Although reliable, this methodology requires removing the bioreactor from the animal and performing destructive tests on the specimen. Therefore, this method, although reliable, makes preclinical testing cumbersome and does not translate into the clinical setting. These experiments explore the correlation between micro-CT and DCE MRI to noninvasively and nondestructively determine bone growth and vascularity within an in vivo bioreactor. Animals were euthanized after imaging so time-point-to-time-point analysis could be performed and compared between destructive and nondestructive imaged specimens. The histomorphometric analysis of new bone production was similar to our previous reported studies and thus reproducible [6, 11]. Two- and three-dimensional micro-CT imaging of the bioreactor yielded impressive qualitative visual results, but quantitatively the subtraction software could not differentiate the densities of the embedded new bone and the coral scaffold. We are exploring a more sophisticated micro-CT imaging software protocol. Another option we are trying is to use a radiolucent scaffold such as PLGA and other polyurethane foams [4]. These scaffolds are radiotransparent and can be fabricated in a manner such that protein delivery can occur.
Using a DCE MRI protocol, we demonstrated a trend (10%) toward augmentation of blood flow through the bioreactor with the osteoinductive protein compared with that in surrounding muscle and the control side. The images, which are sensitive to blood flow, are able to identify a vitalized bioreactor. MRI does not image mineral well; thus, it is not a good direct measure of osteogenesis.
The in vivo bioreactor allows reproducible tissue engineering of osseous tissue in a controlled microenvironment [5, 6]. Our studies suggest BMP2 is an essential factor for osteoid formation in the bioreactor. Nonprotein-supplemented scaffolds yield a predominantly fibrovascular network with limited bone production. The role of BMP2 in guiding the differentiation of mesenchymal stem cells into cells of osteoblast lineage has been described [1, 14]. Hydroxyapatite scaffolds that have not been treated with osteoinductive compounds such as BMP2 can induce osteoid formation when implanted at intramuscular sites or in close proximity to bone [8, 12]. The new bone produced began proximally at the pedicle side of the bioreactor and grew distally. Additionally, the new bone grew centrally from the central pedicle, peripherally toward the outside of the bioreactor [5, 6]. Previous studies also suggest biomatrices loaded with BMP exhibit an initial wave of osteoclast recruitment that precedes the subsequent osteoblastic response [7, 13]. This implies osteoclasts necessarily resorb the matrix in preparation for neovascularization and osteoblast differentiation [5]. Osteoclast activity is not detected in control bioreactors.
Metastatic tumor models of carcinoma to bone hematogenous metastases using the bioreactor have demonstrated a unique attraction for osteoid by injected tumor cells. Halpern et al. [5] demonstrated murine mammary carcinoma injected into the upstream pedicle of a murine bioreactor supplemented with BMP2 facilitates population of the bioreactor bone by the tumor cells. There was more tumor growth in BMP2-treated bioreactors compared with the controls.
The bioreactor has applicability for translational and modeling use. Noninvasive microimaging of bone growth in the bioreactor is on the horizon. Direct clinical applications for microvascular transfer of tissue-engineered bone without donor site morbidity are on the horizon. Molecular analysis of the primitive osteogenic bone microenvironment can be controlled and manipulated in a way to better understand critical growth factors and the relationships between osteoblasts and osteoclasts. The manipulation of the bone matrix by metastatic carcinoma cells can also be examined using the bioreactor in a model that delivers carcinoma to a confined area that mimics the in vivo situation. Genetically altering the host by using knockouts can profoundly affect how skeletogenesis changes in the growing bioreactor. Imaging bioreactors offers an attractive future for monitoring osteogenesis.
Acknowledgments
We thank Thomas Yankeelov, Jennifer L. Begtrup, Todd E. Peterson, and John C. Gore from the Department of Radiology and Radiological Sciences, Institute of Imaging Science at Vanderbilt University, Nashville, TN.
Footnotes
One or more of the authors (GEH) has received funding from the Musculoskeletal Transplant Foundation Career Development Grant 2006.
Each author certifies that his or her institution has approved the animal protocol for this investigation and that all investigations were conducted in conformity with ethical principles of research.
References
- 1.Chen D, Zhao M, Mundy GR. Bone morphogenetic proteins. Growth Factors. 2004;22:233–241. [DOI] [PubMed]
- 2.Evelhoch JL, LoRusso PM, He Z, DelProposto Z, Polin L, Corbett TH, Lanqmuir P, Wheeler C, Stone A, Leadbetter J, Ryan AJ, Blakey AJ, Waterton JC. Magnetic resonance imaging measurements of the response of murine and human tumors to the vascular-targeting agent ZD6126. Clin Cancer Res. 2004;10:3650–3657. [DOI] [PubMed]
- 3.Gill DRJ, Ireland DCR, Hurley JV, Morrison WA. The prefabrication of a bone graft in a rat model. J Hand Surg Am. 1998;23:312–321. [DOI] [PubMed]
- 4.Guelcher SA, Patel V, Gallagher KM, Connolly S, Didier JE, Doctor JS, Hollinger JO. Synthesis and in vitro biocompatibility of injectable polyurethane foam scaffolds. Tissue Eng. 2006;12:1247–1259. [DOI] [PubMed]
- 5.Halpern JL, Lynch CC, Fleming J, Hamming D, Martin MD, Schwartz HS, Matrisian LM, Holt GE. The application of a murine bone bioreactor as a model of tumor: bone interaction. Clin Exp Metastasis. 2006;23:345–356. [DOI] [PubMed]
- 6.Holt GE, Halpern JL, Dovan TT, Hamming D, Schwartz HS. Evolution of an in vivo bioreactor. J Orthop Res. 2005;23:916–923. [DOI] [PubMed]
- 7.Irie K, Alpaslan C, Takahashi K, Kondu Y, Izumi N, Sakakura Y, Tsuruga E, Nakajima T, Ejiri S, Ozawa H, Yajima T. Osteoclast differentiation in ectopic bone formation induced by recombinant human bone morphogenetic protein 2 (rhBMP-2). J Bone Miner Metab. 2003;21:363–369. [DOI] [PubMed]
- 8.Jarcho M. Calcium phosphate ceramics as hard tissue prosthetics. Clin Orthop Relat Res. 1981;157:259–278. [PubMed]
- 9.Kusumoto K, Bessho K, Fujimara K, Konishi Y, Ogawa Y, Izuka T. Self-regenerating bone implant: ectopic induction following intramuscular implantation of a combination rhBMP-2, atelopeptide type I collagen and porous hydroxyapatite. J Craniomaxillofacial Surg. 1996;24:360–365. [DOI] [PubMed]
- 10.Mizumoto S, Inada Y, Weiland AJ. Fabrication of vascularized bone grafts using ceramic chambers. J Reconstr Microsurg. 1993;9:441–449. [DOI] [PubMed]
- 11.Reddi AH. Role of morphogenetic proteins in skeletal tissue engineering and regeneration. Nat Biotechnol. 1998;16:247–252. [DOI] [PubMed]
- 12.Ripamonti U. Osteoinduction in porous hydroxyapatite implanted in heterotopic sites of different animal models. Biomaterials. 1996;17:31–35. [DOI] [PubMed]
- 13.Saito A, Suzuki Y, Ogata S, Ohtsuki C, Tanihara M. Prolonged ectopic calcification induced by BMP-2-derived synthetic peptide. J Biomed Mater Res A. 2004;70:115–121. [DOI] [PubMed]
- 14.Wozney JM, Rosen V, Celeste AJ, Mitsock LM, Whitters MJ, Kriz RW, Hewick RM, Wang EA. Novel regulators of bone formation: molecular clones and activities. Science. 1988;242:1528–1534. [DOI] [PubMed]


