Abstract
Two of the most common signalling pathways in breast cancer are the ER (oestrogen receptor) ligand activation pathway and the E-cadherin snai1 slug EMT (epithelial–mesenchymal transition) pathway. Although these pathways have been thought to interact indirectly, the present study is the first to observe direct interactions between these pathways that involves the regulation of slug expression. Specifically we report that ligand-activated ERα suppressed slug expression directly by repression of transcription and that knockdown of ERα with RNA interference increased slug expression. More specifically, slug expression was down-regulated in ERα-negative MDA-MB-468 cells transfected with ERα after treatment with E2 (17β-oestradiol). The down-regulation of slug in the ERα-positive MCF-7 cell line was mediated by direct repression of slug transcription by the formation of a co-repressor complex involving ligand-activated ERα protein, HDAC1 (histone deacetylase 1) and N-CoR (nuclear receptor co-repressor). This finding was confirmed by sequential ChIP (chromatin immunoprecipitation) studies. In the MCF-7 cell line, slug expression normally was low. In addition, knockdown of ERα with RNA interference in this cell line increased slug expression. This effect could be partially reversed by treatment of the cells with E2. The efficacy of the effect of ERα on slug repression was dependent on the overall level of ERα. These observations confirmed that slug was an E2-responsive gene.
Keywords: oestrogen receptor α (ERα), oestrogen receptor α co-regulator complex, real-time PCR, RNA interference, sequential ChIP analysis, slug
Abbreviations: AF-1 (2), activation function domain 1 (2); ChIP, chromatin immunoprecipitation; DCC-FBS, dextran-coated charcoal-treated FBS; DMEM, Dulbecco's modified Eagle's medium; E2, 17β-oestradiol; EMT, epithelial–mesenchymal transition; ER, oestrogen receptor; ERE, oestrogen-response element; FBS, foetal bovine serum; HDAC, histone deacetylase; HDACI, HDAC inhibitor; IKKα, inhibitor of NF-κB (nuclear factor κB) kinase α; miRNA, microRNA; N-CoR, nuclear receptor co-repressor; ORF, open reading frame; RNAi, RNA interference; SeqChIP, sequential ChIP; siRNA, small interfering RNA; slug (snai2), snail homologue 2; snai1, snail homologue 1; SRC-3, nuclear receptor co-activator; TBST, TBS containing 0.1% Tween 20
INTRODUCTION
Two of the most common signalling pathways in breast cancer are the ER (oestrogen receptor) ligand activation pathway and the E-cadherin–snai1–slug [where snai1 is snail homologue 1 and slug (also known as snai2) is snail homologue 2] EMT (epithelial–mesenchymal transition) pathway. ERα is a ligand-activated nuclear hormone receptor that regulates the transcription of oestrogen-responsive genes in diverse target cells [1]. ERα and its main ligand, E2 (17β-oestradiol), play a critical role in many of the biological processes of normal cells located in the breast, reproductive tract, central nervous system, skeleton and immune system [1]. Similarly ERα and its ligand regulate key pathways in ERα-positive human breast cancer. Two functional domains have been identified in ERα, the transcription activation function domain 1 (termed AF-1) in the N-terminus and domain 2 (termed AF-2) which binds ligand. The AF-1 domain is ligand-independent and constitutive, whereas the function of AF-2 is completely dependent on ligand binding [2 5]. According to the classical model of ER action, in the absence of hormone, the receptor is sequestered in a multiprotein inactive complex in either the cytoplasm or nuclei of target cells. The binding of ligand induces an activating conformational change within the ER, promoting dimerization and high-affinity binding to specific EREs (oestrogen-response elements) located within the regulatory regions of target genes [6]. These ‘co-activator’ complexes enable the ER: (i) to respond appropriately to hormones or pharmacological ligands, (ii) to interpret extra- and intra-cellular signals, (iii) to catalyse the process of chromatin condensation, and (iv) to communicate with the general transcription apparatus at target gene promoters [6]. The action of ligand-activated ERα is not limited to genes with EREs. Ligand-activated ERα can interact in an indirect manner with the regulatory regions of target genes lacking EREs. For example, ERα-mediated expression of the collagenase and IGF-1 (insulin-like growth factor 1) genes is mediated through the interaction of ERα with Fos and Jun at AP-1 (activator protein 1)-binding sites [6]. In any case, ligand activation of ERα sets off a complex series of gene activations in the human breast cancer cell. The ER ligand activation pathway is one of the most important signalling pathways in human breast cancer that has been targeted therapeutically.
The E-cadherin–snai1–slug EMT pathway is another important pathway in human breast cancer progression thought to regulate tumour progression, invasion and metastasis of certain types of human breast cancer [7,8]. The snail transcription family consisting of members snai1 and snai2 (slug) is thought to repress E-cadherin expression, leading to EMT [7]. Snail-induced EMT converts epithelial cells into mesenchymal cells with migratory properties that contribute to the formation of many tissues during embryonic development and to the acquisition of invasive properties in epithelial tumours. Snail-induced EMT is partly due to the direct repression of E-cadherin transcription both during development and tumour progression [9]. This pathway is also activated in malignant mesothelioma and other carcinomas [7,8]. Although snail (snai1 and snai2) has been mostly studied in EMT, even when tumours do not exhibit classic EMT, up-regulated snai1 or snai2 (slug) may mediate invasion and metastasis. In squamous cell carcinomas of the oesophagus, tumours with positive slug expression, for example, invaded deeper, had more lymph node metastasis, and had more lymphatic invasion than tumours with negative slug expression [10]. Although the functions of slug during EMT, invasion and metastasis are being elucidated, comparatively little is known about slug regulation.
As the major signalling pathways in breast cancer continue to be characterized, it is important to identify interactions between these pathways so that they can be understood more fully. Because of the inverse correlation that we had observed recently (Y. Ye, Y. Xiao, W. Wang, K. Yearsley, J.-X. Gao and S. H. Barsky, unpublished work) between ER and slug expression in a number of different ER-positive and ER-negative human breast carcinoma cell lines, we wondered whether the two pathways, previously thought to interact indirectly [11], might, in fact, interact directly.
MATERIALS AND METHODS
Reagents and antibodies
Antibodies against ERα (D-12), HDAC (histone deacetylase) 3 (H-99), N-CoR (nuclear receptor co-repressor; H-303) and HDAC4 (H-92) were purchased from Santa Cruz Biotechnology. Antibodies against HDAC1, SRC-3 (nuclear receptor co-activator; 11B1), IKKα [inhibitor of NF-κB (nuclear factor κB) kinase α] and β-actin (13E5) were purchased from Cell Signaling Technology. Secondary antibodies and Western blotting substrates were purchased from Pierce Technology, and used according to the manufacturer's instructions. E2 and a specific HDACI (HDAC inhibitor) were purchased from EMD Chemicals. Plasmid constructs and related reagents were purchased from Invitrogen.
Cell culture
We used a series of commercially available cell lines, including the ERα-positive human breast carcinoma cell line MCF-7 and the ERα-negative human breast carcinoma cell line MDA-MB-468. All of these cell lines were grown in DMEM (Dulbecco's modified Eagle's medium) with 10% (v/v) FBS (foetal bovine serum) or with 5% (v/v) DCC-FBS (dextran-coated charcoal-treated FBS).
Plasmid construction and transfections
Human full-length ERα Ultimate ORF (IOH34665; ORF is open reading frame) was purchased from Invitrogen. The ERα ORF was cloned into the entry vector pENTR221 and subcloned into vectors pcDNA6.2/V5 using the LR recombination reaction according to the manufacturer's instructions (Invitrogen). We initially performed transient transfections and subsequently performed stable transfections with clonal selection. The recombinant vector pcDNA6.2/V5-ERα containing ERα ORF or the empty (control) vector pcDNA6.2/V5 was transfected directly into cultured cells using Lipofectamine™ 2000 (Invitrogen) for either transient or stable transfection. Blasticidin (10 μg/ml) (EMD Chemicals) was used to select for stable clones.
Knockdown of ERα was achieved with an RNAi (RNA interference) approach using either miRNA (microRNA) to obtain stable clones, or siRNA (small interfering RNA) for transient, but more effective, knockdown. The nucleotide sequences of ERα miRNA were as follows: 5′-TGCTGAGTCATTGCACACTGCACAGTGTTTTGGCCACTGACTGACACTGTGCAGTGCAATGACT-3′ (sense) and 5′-CCTGAGTCATTGCACTGCACAGTGTCAGTCAGTGGCCAAAACACTGTGCAGTGTGCAATGACTC-3′ (antisense). These single strands of miRNA were annealed to form double-strand miRNA DNA and inserted into the BLOCK-iT Pol II miR RNAi Expression vector, pcDNA6.2-GW/EmGFP-miR (Invitrogen). MCF-7 cells were grown overnight and transfected with recombinant plasmid pcDNA6.2-GW/EmGFP-miR-ERα that expressed ERα miRNA or empty plasmid (negative control). Blasticidin (10 μg/ml) was used to select for stable clones.
For the siRNA-knockdown experiments, ERα siRNA sequences included: 5′-CGAGUAUGAUCCUACCAGAII-3′ (sense) and 5′-UCUGGUAGGAUCAUACUCGGA-3′ (antisense). MCF7 cells were maintained in Phenol-Red-free DMEM supplemented with 5% (v/v) DCC-FBS for 48 h. Cells were then transfected with 50 nM of either control siRNA or ERα siRNA. After 48 h, the cells were serum-starved for 12 h and either untreated or treated with E2 for 4 h.
RNA isolation and cDNA synthesis
Total RNA was isolated from cultured cells using an RNeasy Mini Kit (Qiagen) according to the manufacturer's instructions. Total RNA was eluted and dissolved in RNase-free water, and the concentration was determined using a NanoDrop® spectrophotometer (NanoDrop Technologies). For the first-strand cDNA synthesis, the SuperScript® III First-Strand Synthesis System (Invitrogen), oligo(dT)20 and 2 μg of total RNA were used. The synthesized cDNA was used for real-time PCR analysis of relative expression levels of target genes.
PCR and real-time PCR
Briefly, an aliquot of DNA was used in each 25 μl PCR reaction. The following conditions were used: an initial denaturation at 95 °C for 5 min followed by denaturation at 94 °C for 30 s, annealing at 58 °C for 30 s, and extension at 68 °C for 1 min for a total of 30 cycles. PCR products were analysed on a 2.0% agarose gel. Real-time PCR was performed on a ABI 7500® real-time PCR system (Applied Biosystems). cDNA was combined with primer sets and the ABI Power SYBR Green PCR Master Mix. The PCR conditions were as follows: 95 °C for 15 s and 60 °C for 1 min for 40 cycles. Gene expression levels were calculated relative to the housekeeping gene β-actin by using ABI 7500® System SDS software. The primers used for analysis of slug mRNA were: 5′-CTGGTCAA GAAGCATTTCAACGCC-3′ (sense) and 5′-AAAGAGGAGAGAGGCCATTGGGTA-3′ (antisense). The primers used for analysis of ERα mRNA were: 5′-CGCTACTGTGCAGTGTGCAAT-3′ (sense) and 5′-CCTCACAGGACCAGACTCCATAA-3′ (antisense). The primers used for the analysis of β-actin were: 5′-GGCACCCAGCACAATGAAG-3′ (sense), 5′-GCCGATCCACACGGAGTACT-3′ (antisense).
Preparation of protein lysates and Western blot analysis
Cells were lysed using ice-cold RIPA lysis buffer [50 mM Tris/HCl, 150 mM NaCl, 50 mM NaF, 1 mM Na4P2O7·10 H2O, 0.1% DOC (deoxycorticosterone), 1.0% Nonidet P40, 50 μl of Na3VO4 and Halt Protease Inhibitor Cocktail (Pierce Technology)]. After 15 min on ice with shaking, the lysates were centrifuged at 15000 g for 10 min at 4 °C. Supernatants were stored at −80 °C. For Western blot analysis, protein concentrations were determined using the BCA (bicinchoninic acid) protein assay (Pierce Technology). Equal amounts of denatured protein were loaded on to a 15% Precast Gel (Bio-Rad) and transferred to nitrocellulose membranes (Bio-Rad). The membranes were washed in TBST buffer [TBS (Tris-buffered saline, 20 mM Tris and 150 mM NaCl with the pH adjusted to 7.6 with HCl] containing 0.1% Tween 20] and non-specific binding sites were blocked by immersing the membranes in blocking reagent (0.5% non-fat dried skimmed milk in TBST buffer) for 1 h at room temperature (23 °C) on a shaker. After washing with TBST buffer, membranes were incubated overnight at 4 °C with relevant antibodies to ERα and β-actin separately in blocking buffer. Membranes were then washed and incubated with secondary antibody for 1 h at room temperature. After incubation, the membranes were further washed in TBST. Bound antibodies were detected with the chemiluminescent detection system (Pierce Technology).
ChIP (chromatin immunoprecipitation), SeqChIP (sequential ChIP) and Re-ChIP analyses
The ChIP assay was performed using a ChIP kit (Millipore) according to the manufacturer's instructions. Briefly, 2×10⁶ cells were treated with 1% formaldehyde for 10 min at 37 °C. The cells were harvested, suspended with SDS lysis buffer [1% SDS, 10 mM EDTA and 50 mM Tris/HCl (pH 8.3)], and incubated on ice for 10 min. Lysates were sonicated, and debris was removed from the samples by centrifugation for 10 min at 10000 g. An aliquot of each chromatin solution (40 μl) was set aside and designated as the input fraction. Supernatants were diluted 10-fold in immunoprecipitation buffer and precleared with Protein A agarose beads that had been pre-absorbed with salmon sperm DNA. The precleared chromatin solution was incubated with the relevant antibodies to ERα, HDACs 1, 3 and 4, N-CoR, IKKα and SRC-3 separately for 16 h at 4 °C. Normal IgG was used as a negative control. The immune complexes were then collected with the addition of Sepharose A/G plus agarose beads, followed by several washes with appropriate buffers, according to the manufacturer's instructions. Each sample was eluted with freshly prepared 1% SDS and 0.1 M NaHCO3, and then histone–DNA cross-links were reversed with the addition of 5 M NaCl. Chromatin-associated proteins were digested with proteinase K (10 mg/ml), and the immunoprecipitated DNA was recovered by phenol/chloroform extraction and ethanol precipitation and analysed by PCR. The primers used for ChIP were as follows: slug (−456 to −68) 5′-TGGTCTTTGTGCAAGGCAAACCTC-3′ (sense) and 5′-AGGTTCAGATTTCAGCTCCTCCCT-3′ (antisense); slug (−2178 to −1973) 5′-ACCTGTTTCGTCTGACTCAC GCCATC-3′ (sense), 5′-CCATCAGCAGGTATCCGAGGGTGC-3′ (antisense).
For sequential ChIP and Re-ChIP, chromatin from 5×10⁸ cells was incubated with ERα antibody for 16 h at 4 °C. Normal IgG was used as a negative control. The immune complexes were then collected with the addition of Sepharose A/G plus agarose beads, followed by several washes with appropriate buffers, according to the manufacturer's protocol. The supernatant of each sample was kept for further SeqChIP. Precipitated complexes from each sample were eluted by 10 min incubation with 300 μl of elution buffer [50 mM Tris/HCl (pH 7.5), 10 mM EDTA and 1% SDS] at 68 °C. A 10 μl aliquot was removed from each elution sample for analysis of the first immunoprecipitation and as input DNA. The remaining elution fraction was used for Re-ChIP. Aliquots of the elution fraction (90 μl) were incubated with the antibodies (ERα, HDAC3, HDAC1 or N-CoR) and the ChIP assay was performed as described above. For SeqChIP, 40 μl of supernatant was removed from each sample and set as input fractions. An aliquot of each supernatant sample was incubated with antibodies (ERα, HDAC3, HDAC1 or N-CoR) and the ChIP assay was performed as described previously.
Statistical analysis
Differences in slug gene expression between selected clones were analysed with the two-tailed Student's t test as well as ANOVA.
RESULTS
The stimulation of E2 results in suppression of slug expression in ERα-transfected MDA-MB-468 cells
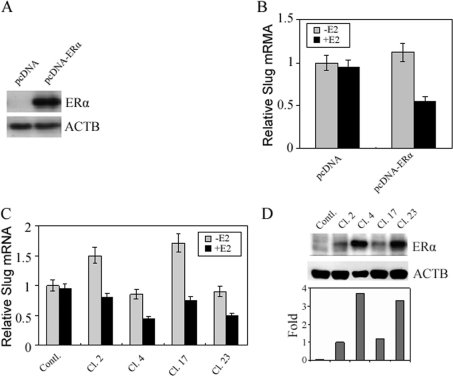
To investigate the effect of ERα on the expression of slug, we initially performed transient transfections of full-length ERα into ERα-negative MDA-MB-468 cells. The recombinant vector pcDNA6.2/V5-ERα containing ERα or the empty (control) vector pcDNA6.2/V5 was transfected directly into cultured MDA-MB-468 cells. At 3 days after transfection, the cells were analysed for ERα protein levels by Western blot and slug mRNA using real-time PCR. The results showed that ERα was overexpressed in pcDNA6.2/V5-ERα-transfected cells, but not in the empty (control) vector-transfected cells (Figure 1A). Although we observed a small increase in slug mRNA levels in cells transfected with pcDNA6.2/V5-ERα alone in the absence of E2, we observed a more dramatic decrease in slug mRNA when these cells were treated with E2 (Figure 1B). Cells transfected with the empty (control) vector showed no increase or decrease in slug mRNA in either the absence or presence of E2 respectively (Figure 1B). For the stable transfections, we used blasticidin to initially select for 35 different clones of MDA-MB-468. Of these, 21 clones overexpressed ERα by both real-time PCR and Western blot analysis (Figure 1C). In some of the stably transfected ERα-expressing MDA-MB-468 clones, the expression of the slug gene was augmented in the absence of E2. In other clones the unliganded ERα had no effect on slug gene expression, but E2 dramatically suppressed slug expression. Based on these observations, it could be concluded that ERα was a bi-functional regulator for the expression of the slug gene, in that the unliganded ERα was an activator, whereas the E2-bound-ERα acted as a repressor, depending upon the specific clone studied. We wondered whether our observations might be more than just stochastic and related to the levels of ERα expressed by each clone. We measured the levels of ERα protein by Western blot analysis in the different clones and investigated whether the effects of unliganded ERα were activating and whether the effects of E2-bound-ERα were repressing based on the levels of ERα. What we observed was very interesting. In clones 4 and 23 ERα was expressed at very high levels (Figure 1D), and it was in these two clones that E2-bound-ERα repression of slug was far greater and statistically significant (P<0.01) than the activating effects of unliganded ER which were not statistically significant (P>0.1) (Figure 1C). In clones 2 and 17 where ERα expression was much lower (Figure 1D), the activating effects of unliganded ER were greater than the repression effects of E2-bound ERα, but both were statistically significant (P<0.01 and P<0.05) (Figure 1C). A similar pattern of activation versus repression was exhibited by the remaining clones depending on their relative levels of ERα. Our results in these stable-transfection experiments with respect to slug repression confirmed the results of our transient-transfection experiments. Collectively the transfection experiments indicated that E2 resulted in down-regulation of slug in transfected MDA-MB-468 cells overexpressing ERα, with the most dramatic effects observed in those clones with the highest levels of ERα. In other words, slug is an E2-responsive gene when ERα is overexpressed, and the amount of E2-induced slug repression directly relates to the levels of ERα.
Figure 1. The expression of slug in response to stimulation by E2 in transfected MDA-MB-468 cells overexpressing ERα.
The recombinant vector pcDNA6.2/V5-ERα (pcDNA-ERα) containing ERα ORF or empty vector pcDNA6.2/V5 (pcDNA) was transfected into MDA-MB-468 cells using Lipofectamine™ 2000. (A) Transiently transfected cells were harvested and analysed for ERα protein by Western blotting. (B) Transiently transfected cells were maintained in Phenol-Red-free DMEM with 5% DCC-FBS for 48 h, and after 12 h of serum starvation, cells were treated with either ethanol vehicle (control) or E2 (100 nM) for 4 h. The cells were then harvested and analysed for slug mRNA by real-time PCR. Values are means±S.D. (C) Stably transfected clones overexpressing ERα were similarly maintained, treated and analysed. Four such clones are depicted. Values are means±S.D. (D) Western blot showing ERα protein levels in each stably transfected clone expressing ERα. Clones 4 and 23 showed the highest ERα protein levels. These same clones showed the greatest E2 repression of slug.
Knockdown of ERα results in the increase of slug mRNA levels in MCF-7 cells
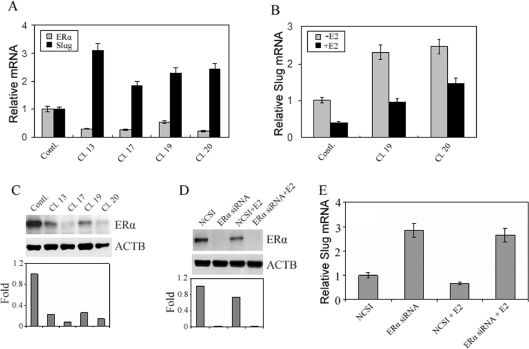
As a ligand-activated nuclear hormone receptor, ERα and its ligand E2 regulate the transcription of many oestrogen-responsive genes in diverse target cells. In addition to examining the effects of ERα overexpression as noted previously, we decided to knockdown ERα in a naturally ERα-expressing line, e.g. MCF-7, in order to monitor the effects on endogenous slug expression, a situation perhaps more physiologically relevant than the situation of overexpression. To investigate the effect of ERα knockdown on the expression of slug, ERα miRNA was transfected into parental MCF-7 cells and stable clones were selected with blasticidin. A total of 38 clones were selected and analysed for ERα mRNA levels by real-time PCR. We observed that ERα expression was significantly reduced to different levels in various clones (Figure 2A). These clones also showed significant increases in slug mRNA expression (Figure 2A). We then treated selected clones with E2 (clones 19 and 20). The ERα level of clone 19 by real-time PCR was higher than in clone 20, but when treated with E2 slug expression was decreased more in clone 19 than in clone 20 (Figure 2B). This suggested the possibility that E2 caused a stronger response in clone 19 because clone 19 had greater residual ERα. Another possibility was the existence of an E2–ERα-independent mechanism. To resolve these possibilities we needed to examine the levels of ERα protein expression in the different clones and we needed to carry out more effective ERα knockdown. The levels of ERα in the different clones by Western blot analysis (Figure 2C) generally correlated with the mRNA levels by real-time PCR (Figure 2A). To determine further whether the effects on repression of slug expression by E2 were mediated by residual levels of ERα, which was our hypothesis, or ERα-independent mechanisms, which was another possibility, we carried out siRNA transient ERα knockdown and were able to achieve a more significant and near total knockdown of ERα (Figure 2D). With the subsequent addition of E2, we did not observe any repression of slug expression (Figure 2E). Therefore we concluded that the effects on slug repression were indeed mediated by ERα. Therefore slug was also an E2-responsive gene when ERα was knocked down, and the amount of E2-induced slug repression was again related to the residual levels of ERα remaining.
Figure 2. Knockdown of ERα leading to the up-regulation of slug.
(A) MCF-7 cells were transfected with plasmid pcDNA6.2-GW/EmGFP-miR-ERα that contained ERα miRNA or negative-control plasmid pcDNA6.2-GW/EmGFP-Neg ERα. The blasticidin-resistant stably transfected clones were screened and analysed for the ERα mRNA level by real-time PCR. The transcription of slug was up-regulated when ERα was knocked down. Values are means±S.D. (B) Stably transfected clones 19 and 20 were maintained in Phenol-Red-free DMEM with 5% DCC-FBS for 48 h, and after 12 h of serum starvation, the clones were either untreated or treated with E2 (100 nM) for 4 h. Total RNA was extracted and used for the analysis of the expression of slug by real-time PCR. Values are means±S.D. (C) Western blot showing ERα protein levels in each clone expressing miR RNAi. Clone 19 had the highest residual ERα levels by both real-time PCR as well as Western blot analysis and a significant repression of slug by E2. (D) Western blot showing ERα protein levels in cells treated with or without ERα siRNA and with or without E2. The siRNA approach was very effective at ERα knockdown. (E) Real-time PCR showing slug mRNA levels in cells treated with or without ERα siRNA and with or without E2. Total RNA was extracted and analysed for slug mRNA by real-time PCR. With effective ERα knockdown, E2 was not able to repress slug. Values are means±S.D.
Ligand-activated ERα associates with the slug promoter
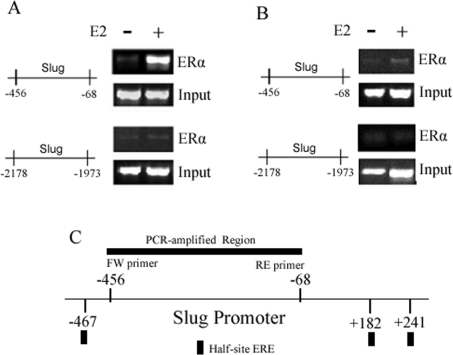
Based on the aforementioned findings, we hypothesized that ligand-activated ERα directly binds to the promoter regulatory regions of slug and recruits known ERα co-regulators to form transcriptional complexes that regulate slug transcription. A search for specific EREs located within the slug promoter using MatInspector® Software (Genomatix® Software) did not reveal any classical ERE sites. However, the search revealed three half-site EREs found at positions −467, +182 and +241 respectively. To investigate whether ERα forms a transcriptional complex at these sites within the slug promoter, we performed ChIP assays. In these studies, we used the ERα-positive MCF-7 cell line as the positive control and the untransfected ERα-negative MDA-MB-468 cell line as the negative control. Based on the location of the putative half-site EREs, we chose a region of the slug promoter flanked by these sites and a region located far upstream of these sites as a negative control and also for normalization of ChIP signals between the two cell lines. In the MCF-7 cells, E2 treatment led to the recruitment of ERα to the −456 to −68, but not the −2178 to −1973, region of the slug promoter (Figure 3A). In MDA-MB-468 cells, there was no association of ERα to the −456 to −68 region of the slug promoter (Figure 3B). These results indicate that ligand-activated ERα is recruited to the slug promoter in the region spanning the half-site EREs (Figure 3C).
Figure 3. ChIP assays for ligand-activated ERα in association with the slug promoter.
(A) The ERα-positive MCF-7 cells were grown in Phenol-Red-free DMEM supplemented with 5% DCC-FBS for 48 h. After 12 h of serum starvation, the cells were treated with either ethanol vehicle (control) or E2 (100 nM) for 4 h. ChIP assays were performed by using an antibody directed against ERα. E2 treatment led to the recruitment of ERα to the −456 to −68 but not the −2178 to −1973 region of the slug promoter. (B) The ERα-negative MDA-MB-468 cells were similarly grown, treated and studied. There was no association of ERα to the −456 to −68 region of the slug promoter with E2 treatment. Input DNA was used to normalize results in both sets of experiments. (C) The schematic diagram depicts the location of the three half-site EREs found at positions −467, +182 and +241 in the slug promoter. Because these half-site EREs were only putative binding sites, we amplified a region flanked by these EREs which would be immunoprecipitated if the transcriptional inhibitory complex were bound to any one of them.
HDAC1 co-represses the expression of slug
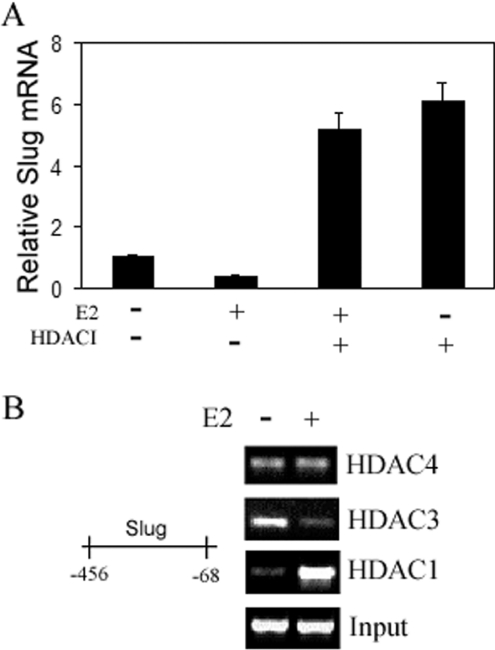
A number of different co-repressors interacting with ligand-activated ERα had been identified in recent years. Among them, HDACs were known to regulate chromatin structure through histone modification and direct interaction with transcription factors [12]. It has been reported that HDAC1 interacted with the AF-2 domain of ERα and suppressed ERα transcription activity [13]. To test whether HDAC1 or possibly other HDACs had this effect on the expression of slug, we used an HDACI on the ERα-positive MDA-MB-468 clone 17 (Figure 4A). In addition we examined the effects of HDAC inhibition on slug expression in the ERα-positive MCF-7 line. Our results indicated that HDAC inhibition increased slug expression in both lines. The level of slug mRNA in MDA-MB-468 clone 17 treated with HDACI was increased more than 4-fold compared with vehicle control (Figure 4A).
Figure 4. HDAC1 presence in the inhibitory ERα transcriptional complex at the slug promoter and its regulation of slug expression.
(A) MDA-MB-468 clone 17, which overexpressed transfected ERα and showed significant slug inhibition with E2, was incubated in Phenol-Red-free DMEM supplemented with 5% DCC-FBS for 48 h, followed by 12 h of serum starvation. Cells were then incubated for 4 h with or without E2 (100 nM) and with or without an HDACI for 2 h. Total RNA was extracted and analysed for slug mRNA by real-time PCR. HDACI enhanced slug expression. Values are means±S.D. (B) MCF-7 cells were grown in Phenol-Red-free DMEM supplemented with 5% DCC-FBS for 48 h. After 12 h of serum starvation, the cells were either treated with vehicle ethanol or with 100 nM E2 for 4 h. ChIP assays were performed using antibodies directed against HDAC1, HDAC3 and HDAC4. E2 treatment led to the selective recruitment of HDAC1, but not HDAC3 or HDAC4, to the −456 to −68 region of the slug promoter. Input DNA was used to normalize the results.
Based on the aforementioned findings, we hypothesized that HDACs bind to the promoter regulatory regions of slug in the same −456 to −68 region as ERα binds and form part of the transcriptional complex that regulates slug transcription. To investigate this, we performed ChIP assays. In the ERα-positive MCF-7 cells, E2 treatment led to the selective recruitment of HDAC1, but not HDAC3 or HDAC4, to the −456 to −68 region of the slug promoter (Figure 4B). HDAC3 was present before E2 treatment, but its recruitment was decreased after E2 treatment. There were low levels of associated HDAC4 that did not change after E2 treatment. Our findings indicated that only HDAC1 was recruited to the slug promoter after E2 treatment. Thus HDAC1 is the co-repressor that forms the inhibitory complex with ligand-activated ERα to repress slug transcription.
N-CoR, but not SRC-3 or IKKα, binds to the regulatory regions of the slug promoter
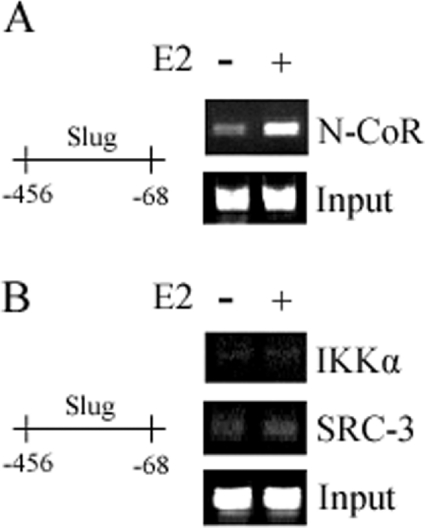
The co-repressor N-CoR is involved in repression associated with unliganded RAR (retinoic acid receptor) and thyroid hormone receptor [14,15]. It had been demonstrated that N-CoR also played an important role in the regulation of ERα target genes [16,17] by binding to ligand-activated ERα. It had also been demonstrated that IKKα and SRC-3 regulate ERα target genes, including cyclin D1 and c-Myc [18], by binding to ligand-activated ERα. For these reasons we investigated whether these co-repressors or co-activators associated with the slug promoter at the same −456 to −68 site that ERα bound and HDAC1 associated. The ERα-positive MCF-7 line was again used in the ChIP assay. E2 treatment led to the recruitment of N-CoR (Figure 5A), but not SRC-3 or IKKα (Figure 5B), to the −456 to −68 region of the slug promoter. These results suggested that N-CoR, but neither SRC-3 nor IKKα, was involved in the ligand-activated ERα regulation of slug transcription.
Figure 5. N-CoR, but not IKKα or SRC-3, presence within the inhibitory ERα transcriptional complex of the slug promoter.
MCF-7 cells were grown in Phenol-Red-free DMEM supplemented with 5% DCC-FBS for 48 h, and after 12 h of serum starvation, the cells were treated either with vehicle ethanol or with E2 (100 nM) for 4 h. ChIP assays were performed by using antibodies directed against N-CoR (A), IKKα and SRC-3 (B). E2 treatment led to the recruitment of N-CoR, but not SRC-3 or IKKα, to the −456 to −68 region of the slug promoter. Input DNA was used to normalize the results.
E2, ERα, HDAC1 and N-CoR form a co-repressor inhibitory complex
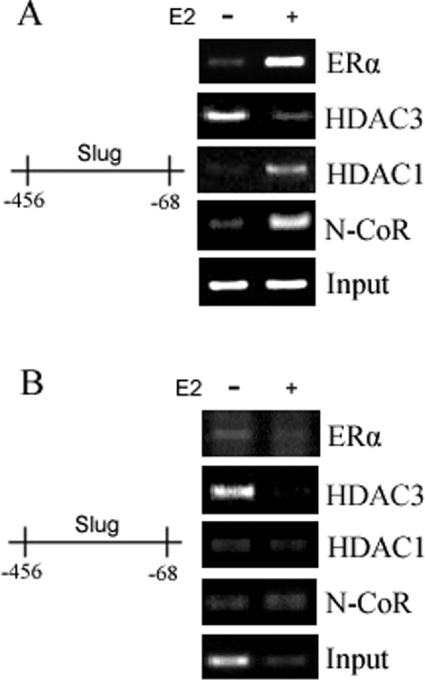
We have proposed a model to suggest that N-CoR and HDAC1 act as co-repressors that form an inhibitory complex with E2–ERα to suppress the expression of the slug gene. However, it is also possible that N-CoR and HDAC1 separately associated with the slug promoter without forming a complex with E2 ERα. If E2 ERα indeed formed a complex that included N-CoR and/or HDAC1, a positive signal should be observed by Re-ChIP using ERα and N-CoR/HDAC1 antibodies in the presence of E2. In addition, a SeqChIP analysis with ERα and N-CoR/HDAC1 antibodies would be expected to demonstrate that after the first ChIP with ERα, all of the N-CoR/HDAC1 would be immunoprecipitated and there would be nothing left to precipitate if there was no ERα-independent recruitment of these proteins to the slug promoter. We performed SeqChIP and Re-ChIP analyses [19,20] to investigate these possibilities (Figures 6A and 6B). First, after E2 treatment and subsequent immunoprecipitation with anti-ERα, we immunoprecipitated the supernatant sequentially with anti-N-CoR, anti-HDAC1 and anti-HDAC3. Our results showed that, after the first ChIP with anti-ERα, subsequent immunoprecipitations produced no increases in the −456 to −68 slug promoter amplifications (Figure 6B). These findings suggested that neither N-CoR nor HDAC1 bound to the slug promoter independently of the E2–ERα complex. Secondly, after E2 treatment, we conducted Re-ChIP on the initial anti-ERα immunoprecipitate, resuspended it and then immunoprecipitated it a second time separately with anti-ERα, anti-N-CoR, anti-HDAC1 and anti-HDAC3 antibodies. We were able to demonstrate that the second immunoprecipitations with anti-ERα, anti-N-CoR and anti-HDAC1 antibodies, but not anti-HDAC3, produced increased slug promoter amplifications (Figure 6A). This latter Re-ChIP indicated that N-CoR and HDAC1 indeed formed a complex with E2–ERα.
Figure 6. The results of SeqChIP and Re-ChIP.
MCF-7 cells were grown in Phenol-Red-free DMEM supplemented with 5% DCC-FBS for 48 h, and after 12 h of serum starvation, the cells were treated with either vehicle ethanol or with 100 nM E2 for 4 h. The cells were collected and chromatin from 5×10⁸ cells was incubated first with ERα antibody and the immune-precipitated complexes were then collected with the addition of Sepharose A/G plus agarose beads. The precipitated complexes (A) and supernatant (B) of each sample were used for further sequential ChIP with ERα, HDAC3, HDAC1 or N-CoR antibodies respectively. The amount of input promoter DNA is also shown.
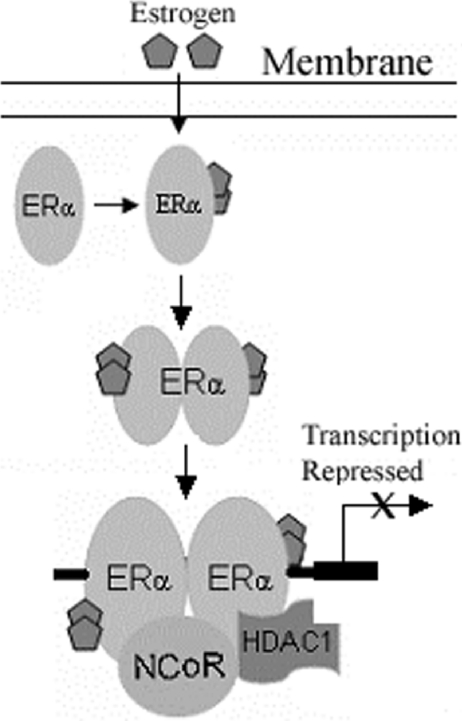
These results suggest that ligand-activated ERα formed a transcriptional inhibitory complex comprised of N-CoR and HDAC1 which bound to the slug promoter (Figure 7).
Figure 7. Schematic diagram summarizes direct ERα-mediated repression of slug transcription.
DISCUSSION
As the major signalling pathways in breast cancer continue to be identified and characterized, it is also important to identify interactions between these pathways whenever they are present to gain a wider understanding of signalling in the breast cancer cell. Two of the most common signalling pathways in breast cancer are the ERα ligand activation pathway and the E-cadherin–snai1–slug EMT pathway [1–4]. Although these pathways have been shown to interact indirectly [11], the present study is the first to observe direct interactions between these pathways characterized by the suppression of slug expression by ligand-activated ERα. More specifically, ligand-activated ERα suppressed expression of slug by direct repression of transcription. Although the prevailing belief is that agonist-liganded ERα is usually associated with gene activation, and that the recruitment of gene repression components such as HDAC1 by ERα to target gene promoters occurs only when ERα is liganded with antagonists [6], in the present study we show the opposite: that ligand-activated ERα with HDAC1 suppresses slug expression.
Although there have been numerous studies that have addressed the ERα ligand activation pathway and the E-cadherin snai1 slug EMT pathway, very few studies have addressed their interactions. Although it had been noted that ERα can repress the expression of snai1 through the activation of MTA3 (metastasis-associated 1 family, member 3) that selectively targets snai1, but not slug, direct effects on either snai1 or slug transcription were not found [11]. In the present study we found direct effects of ERα on slug transcription.
Our laboratory had been studying E-cadherin expression in a series of ERα-positive and ERα-negative human breast cancer cell lines [21] when we observed by expression profiling that many ERα-negative lines which were also E-cadherin-negative (e.g. MDA-MB-468 and MDA-MB-231) exhibited high slug expression. Conversely, in many ERα-positive lines which were also E-cadherin positive, we observed that slug expression was low or absent. These initial observations suggested that the ligand-activated ERα might regulate slug expression and thereby interact with the E-cadherin snai1 slug EMT signalling pathway. For this reason we decided to investigate this interaction more fully. In the present study, we addressed one mechanism by which ERα controlled the expression of slug. This mechanism was that ligand-activated ERα suppressed slug transcription through direct association with the slug promoter, where ERα interacted with recruited co-regulators. Therefore slug was an ERα-responsive gene.
Human breast cancers which lack ligand-activated ERα may then overexpress slug, which may down-regulate E-cadherin and lead to EMT. EMT is thought to be a cause of biological aggressiveness, invasion and metastasis. Breast cancers, on the other hand, which possess ligand-activated ERα may express low or absent levels of slug, increased E-cadherin, decreased EMT and less aggressive behaviour. No model is universal and there are certainly ERα-positive breast cancers such as infiltrating lobular cancer which strongly express ERα but are negative for E-cadherin and manifest EMT. Conversely there are ERα-negative breast cancers, such as inflammatory breast cancer, that are strongly E-cadherin positive [22]. We have observed in these latter cancers overexpression of snai1 and slug, and believe that the basis of E-cadherin overexpression in inflammatory breast cancer is related to altered E-cadherin trafficking, increased rates of accumulation and lack of degradation, rather than transcriptional regulation (Y. Ye, W. Wang, K. Yearsley, J.-X. Gao and S. H. Barsky, unpublished work).
The present studies show that E2 treatment resulted in down-regulation of slug in transfected MDA-MB-468 clones expressing full-length ERα. In addition to examining the effects of ERα overexpression, our studies examined the effects of ERα gene knockdown in a naturally expressing ERα line, e.g. MCF-7, in order to monitor the effects on endogenous slug expression. The result of ERα knockdown was a significant increase in slug mRNA levels even though the effect could be partially reversed by treatment of the cells with E2, based on our hypothesis that there was still significant residual ERα. To support this hypothesis further, near-complete knockdown was achieved with siRNA and the effect of E2 on slug repression was completely abolished. The overexpression and knockdown studies of ERα in tandem reveal that the efficacy of the effect of ERα on slug repression was dependent on the overall level of ERα. These observations confirmed that slug indeed was an E2-responsive gene.
Our findings indicated that ligand-activated ERα forms, together with HDAC1 and N-CoR, a transcriptional inhibitory complex which probably binds to the slug promoter in a region containing half-site EREs. Because we did not know which of these half ERE sites might be the location of the binding of the transcription inhibitory complex, we chose a promoter region flanked by these sites that would probably be precipitated in the ChIP analyses if any of these half ERE sites were involved. Our findings still do not indicate the precise location of the binding of the complex or whether more than one half ERE site is involved. Our findings with SeqChIP do confirm that E2 ERα, HDAC1 and N-CoR together form an inhibitory complex and that HDAC1 and N-CoR do not independently associate with the slug promoter.
It has been demonstrated previously that the recruitment of co-regulatory proteins to ERα is required for ERα-mediated transcriptional and biological activities [13,16 18] and that these co-regulatory proteins may include HDACs, N-CoR, SRC-3 and IKKα. In the case of slug, however, these co-regulatory proteins specifically included HDAC1 and N-CoR, but not other HDACs or SRC-3 or IKKα. Predictably, an HDACI increased slug expression. Although HDACIs are thought to have global effects on gene expression and therefore could have increased slug expression by other indirect or secondary mechanisms, the finding that E2 increased the HDAC1, but not other HDACs that were immunoprecipitated from the same region of the slug promoter (−456 to −68) where ligand-activated ERα was immunoprecipitated, indicated that ERα was probably the target for HDACI-alleviated slug gene expression. This finding further confirmed that ligand-activated ERα suppressed slug expression by transcriptional repression and that the ER ligand activation pathway interacts with the E-cadherin–snai1–slug EMT pathways directly by repressing slug.
FUNDING
This work was supported by the Department of Defense (U.S. Army) Breast Cancer Research Programme Grant W81XWH-06-1-0631, the Strategic Initiative Grant Programme at Ohio State University and The Donald A. Senhauser Endowment.
References
- 1.Nilsson S., Makea S., Treuter E., Tujague M., Thomsen J., Andersson G., Enmark E., Pettersson K., Warner M., Gustafsson J. A. Mechanisms of estrogen action. Physiol. Rev. 2001;81:1535–1565. doi: 10.1152/physrev.2001.81.4.1535. [DOI] [PubMed] [Google Scholar]
- 2.Tora L., White J., Brou C., Tasset D., Webster N., Scheer E., Chambon P. The human estrogen receptor has two independent nonacidic transcriptional activation functions. Cell. 1989;59:477–487. doi: 10.1016/0092-8674(89)90031-7. [DOI] [PubMed] [Google Scholar]
- 3.Kato S., Masuhiro Y., Watanabe M., Kobayashi Y., Takeyama K., Endoh H., Yanagisawa J. Molecular mechanism of a cross-talk between oestrogen and growth factor signaling pathways. Genes Cells. 2000;5:593–601. doi: 10.1046/j.1365-2443.2000.00354.x. [DOI] [PubMed] [Google Scholar]
- 4.Hyder S. M., Stancel G. M., Chiappetta C., Murthy L., Boettg E. R., Tong H. L., Makela S. Uterine expression of vascular endothelial growth factor is increased by estradiol and tamoxifen. Cancer Res. 1996;56:3954–3960. [PubMed] [Google Scholar]
- 5.Mueller M. D., Vigne J. L., Minchenko A., Lebovic D. I., Leitman D. C., Taylor R. N. Regulation of vascular endothelial growth factor (VEGF) gene transcription by estrogen receptors and β. Proc. Natl. Acad. Sci. U.S.A. 2000;97:10972–10977. doi: 10.1073/pnas.200377097. [DOI] [PMC free article] [PubMed] [Google Scholar]
- 6.Hall J. M., McDonnell D P. Coregulators in nuclear estrogen receptor action: from concept to therapeutic targeting. Mol. Interv. 2005;5:343–357. doi: 10.1124/mi.5.6.7. [DOI] [PubMed] [Google Scholar]
- 7.Hajra K. M., Chen D. Y., Fearon E. R. The SLUG zinc-finger protein represses e-cadherin in breast cancer. Cancer Res. 2002;62:1613–1618. [PubMed] [Google Scholar]
- 8.Catalano A., Rodilossi S., Rippo M. R., Caprari P., Procopio A. Induction of stem cell factor/c-Kit/Slug signal transduction in multidrug-resistant malignant mesothelioma cells. J. Biol. Chem. 2004;279:46706–46714. doi: 10.1074/jbc.M406696200. [DOI] [PubMed] [Google Scholar]
- 9.Barrallo-Gimeno A., Nieto M. A. The Snail genes as inducers of cell movement and survival: implications in development and cancer. Development. 2005;132:3151–3161. doi: 10.1242/dev.01907. [DOI] [PubMed] [Google Scholar]
- 10.Uchikado Y., Natsugoe S., Okumura H., Setoyama T., Matsumoto M., Ishigami S., Aikou T. Slug expression in the e-cadherin preserved tumors is related to prognosis in patients with esophageal squamous cell carcinoma. Clin. Cancer Res. 2005;11:1174–1180. [PubMed] [Google Scholar]
- 11.Fujita N., Jaye D. L., Kajita M., Geigerman C., Moreno C. S., Wade P. A. MTA3, a Mi-2/NuRD complex subunit, regulates an invasive growth pathway in breast cancer. Cell. 2003;113:207–219. doi: 10.1016/s0092-8674(03)00234-4. [DOI] [PubMed] [Google Scholar]
- 12.Somecha R., Izraelia S. J., Simon A. Histone deacetylase inhibitors: a new tool to treat cancer. Cancer Treat. Rev. 2004;30:461–472. doi: 10.1016/j.ctrv.2004.04.006. [DOI] [PubMed] [Google Scholar]
- 13.Kawai H., Li H. C., Avraham S., Jiang S. X., Avraham H. K. Overexpression of histone deacetylase HDAC1 modulates breast cancer progression by negative regulation of estrogen receptor α. Int. J. Cancer. 2003;107:353–358. doi: 10.1002/ijc.11403. [DOI] [PubMed] [Google Scholar]
- 14.Chen J. D., Evans R. M. A transcriptional co-repressor that interacts with nuclear hormone receptors. Nature. 1995;377:454–457. doi: 10.1038/377454a0. [DOI] [PubMed] [Google Scholar]
- 15.Medunjanin S., Hermani A., De Servi B., Grisouard J., Rincke G., Mayer D. Glycogen synthase kinase-3 interacts with and phosphorylates estrogen receptor and is involved in the regulation of receptor activity. J. Biol. Chem. 2005;280:33006–33014. doi: 10.1074/jbc.M506758200. [DOI] [PubMed] [Google Scholar]
- 16.Keeton E. K., Brown M. Cell cycle progression stimulated by tamoxifen-bound estrogen receptor- and promoter-specific effects in breast cancer cells deficient in N-CoR and SMRT. Mol. Endocrinol. 2005;19:1543–1554. doi: 10.1210/me.2004-0395. [DOI] [PubMed] [Google Scholar]
- 17.Voss T. C., Demarco I. A., Booker C. F., Day R. N. Corepressor subnuclear organization is regulated by estrogen receptor via a mechanism that requires the DNA-binding domain. Mol. Cell Endocrinol. 2005;231:33–47. doi: 10.1016/j.mce.2004.12.003. [DOI] [PubMed] [Google Scholar]
- 18.Park K. J., Krishnan V., O'Malley B. M., Yamamoto Y., Gaynor R. B. Formation of an IKKα-dependent transcription complex is required for estrogen receptor-mediated gene activation. Mol. Cell. 2005;18:71–82. doi: 10.1016/j.molcel.2005.03.006. [DOI] [PubMed] [Google Scholar]
- 19.Geisberg J. V., Struhl K. Quantitative sequential chromatin immunoprecipitation, a method for analyzing co-occupancy of proteins at genomic regions in vivo. Nucleic Acids Res. 2004;32:e151. doi: 10.1093/nar/gnh148. [DOI] [PMC free article] [PubMed] [Google Scholar]
- 20.West A. G., van Attikum H. Chromatin at the crossroads. EMBO Rep. 2006;7:1206–1210. doi: 10.1038/sj.embor.7400834. [DOI] [PMC free article] [PubMed] [Google Scholar]
- 21.Barsky S. H. Myoepithelial mRNA expression profiling reveals a common tumor suppressor phenotype. Exp. Mol. Pathol. 2003;74:113–122. doi: 10.1016/s0014-4800(03)00011-x. [DOI] [PubMed] [Google Scholar]
- 22.Tomlinson J. S., Alpaugh M. L., Barsky S. H. An intact overexpressed E-cadherin/α,β-catenin axis characterizes the lymphovascular emboli of inflammatory breast carcinoma. Cancer Res. 2001;61:5231–5241. [PubMed] [Google Scholar]


