Introduction
The Osteoarthritis Initiative (OAI), a public-private partnership jointly sponsored by the National Institutes of Health (NIH) and the pharmaceutical industry, is targeted at identifying the most promising biomarkers for analyzing development and progression of symptomatic knee osteoarthritis (OA) [1]. The OAI enrolled a total of 4,794 men and women ages 45–79, who either have, or are at increased risk of developing, knee OA. The OAI will evaluate these subjects annually over a minimum of 4 years with radiography and magnetic resonance (MR) imaging of the knee, along with biochemical, genetic and clinical assessments of disease activity. The OAI MR protocol [2] was designed to allow thorough clinical and research evaluations of the femorotibial and patellofemoral joints of both knees. To achieve these goals, identical, dedicated 3 tesla (T) (Trio, Siemens Medical Solutions, Erlangen, Germany) MR systems were installed at four clinical sites.
In a longitudinal MR study it is necessary to use standardized Quality Assurance (QA) methods to correct slowly developing problems prior to their impacting image quality or quantitative analysis results. For the OAI, monthly preventative maintenance was performed by the manufacturer, independent QA was systematically performed with standardized phantoms, image acquisitions and analysis methods. One of the QA goals was to achieve longitudinal consistency across all sites for key image characteristics including signal-to-noise (SNR), contrast-to-noise (CNR), signal uniformity, absence of artifacts, and geometric distortion. In this manner, baseline subject image results will be suitable for direct comparison with those obtained years later during follow-up MR exams. Another goal was to compare image data acquired from each of the four OAI MR systems to insure the results can be pooled across sites to increase the statistical power for analysis [3].
This report outlines the QA measurement and analysis process, and presents results from the centralized automated QA assessment over the first three years of the OAI.
Method
The four OAI MR facilities are located in Columbus, OH, Pittsburgh, PA, Pawtucket, RI, and Baltimore, MD and were outfitted with one quadrature transmit-receive head coil (USA Instruments, Aurora, OH) and three quadrature transmit-receive knee coils (USA Instruments, Aurora, OH). All four MR systems were under manufacturer’s service agreement for the duration of the OAI.
Preventative maintenance visits by the manufacturer’s service engineers were made on a monthly basis to include safety, performance and image quality checks, with tune-ups undertaken to prevent drift, to perform any required corrective maintenance or updates and small recalibrations of the gradient amplitudes, eddy current adjustments, and RF feedback loops. OAI performance specifications were more strict than, or equivalent to, variations allowed by the manufacturer or American College of Radiology (ACR) specifications [4–8] and are detailed in the respective sections.
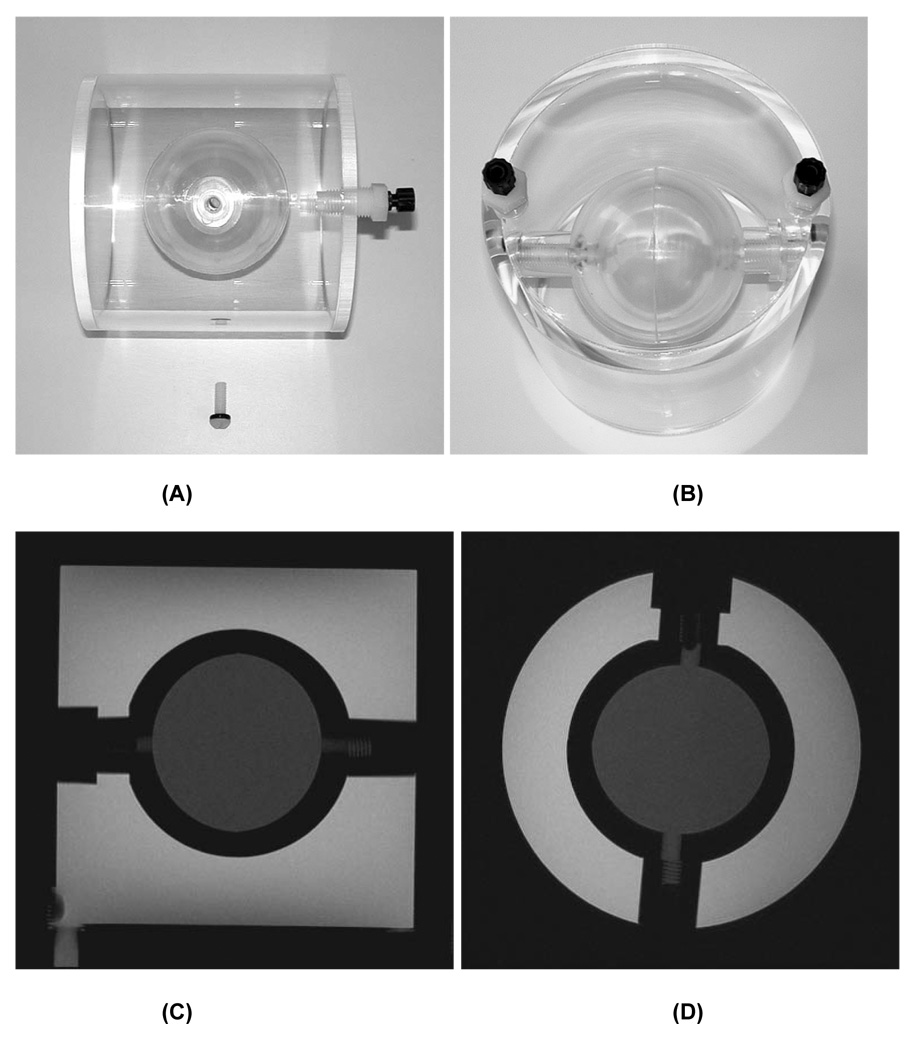
Two study specific phantoms were used: the ACR MR accreditation phantom [5–8], measured in the head coil with a phantom holder (Chamco, Inc., Cocoa, FL); and a custom phantom measured in the knee coil. This second phantom (OAI knee phantom, Figure 1) was designed to fit most commercial knee coils. It has two compartments, an outer cylinder with outer diameter and length of 12.5cm and 12.8cm (approximate inner diameter and length both 11.5cm) and an inner hollow sphere with 5.7cm inside diameter. Each compartment contains a different concentration Magnevist (Schering AG, Germany) solution (inner sphere 10mM; outer cylinder 3.33mM) corresponding to the approximate T2 values of the superficial and deep layers of normal cartilage (18msec and 50msec, respectively).
Figure 1.
Custom OAI QA phantom for knee coil. Side (A) and top (B) view photographs. Sagittal (C) and axial (D) IW TSE images of the phantom.
QA testing time frames are specified in Table 1. A process was created that incorporated periodic centralized automated analysis, with daily manual assessment by the MR technologists. Daily on-site QA enables identification of egregious errors such as coil failure, gradient failure, or eddy current compensation failure. Monthly and annual QA analyses were performed centrally, with automated analysis software (Simply Physics, Baltimore, MD). The analysis program for the ACR phantom images was created and applied in compliance with ACR guidelines [5]. Similar measurements were made using the OAI phantom images. Details of the analysis algorithm are contained in the respective sections.
Table 1.
Schedule of MR QA phantom measurements.
| Time Period | Phantom | Coil | Measurement | Evaluation |
|---|---|---|---|---|
| Daily | Knee SNR | Primary Knee (isocenter) | SNR | Technologist |
| Daily | OAI | Knee (MWF at R60; TThS at L60) | Geometry, Signal Uniformity, Ghosting | Technologist |
| Weekly | None | None | Physical inspection of all coils, phantom, magnet bore, screen room door. | Technologist |
| Weekly | Head SNR | Head | SNR | Technologist |
| Weekly | Knee SNR | Two Backup Knee (isocenter) | SNR | Technologist |
| Monthly (week 1) | OAI | Primary Knee (Odd at R60; Even at L60) | Geometry, SNR, Signal Uniformity, Ghosting, T2, Volume | Central |
| Monthly (week 2) | Body SNR | Body | SNR | Technologist |
| Monthly (week 3) | ACR, modified | Head | Geometry, SNR, Signal Uniformity, Ghosting | Central |
| Monthly (week 4) | All | All | Preventative Maintenance | Siemens |
| Annually | ACR, standard + modified | Head | Geometry, SNR, Signal Uniformity, Ghosting | Central |
Monthly QA was performed with the ACR phantom to allow identification of MR system drift and to trigger correction of any performance deficits in the MR system. Measurements included SNR, image uniformity, spatial accuracy, eddy current and gradient calibration. Because a key outcome of the OAI MR protocol is quantitative measurement of cartilage morphology [2], particular attention was paid to gradient amplitude calibration stability that directly impacts the accuracy and precision of geometric measurements [4,10,11,12,13,14]. A second monthly QA acquisition with the OAI knee phantom quantifies the effects of system calibration on a knee image, but is not used to identify system drift. The monthly ACR QA protocol was ideally run two weeks before the monthly OAI QA protocol so an assessment of the MR system performance was obtained twice each month.
All QA acquisition protocols were designed to reflect the contrast and spatial resolution of the OAI knee MR acquisitions (Table 2). Monthly ACR QA was performed using sagittal and axial turbo spin echo (TSE) acquisitions with echo time (TE), echo train length and bandwidth identical to that of the subject knee acquisitions with spatial resolution scaled to account for the larger field-of-view (FOV) [2]. Annual ACR QA incorporated the ACR MR accreditation acquisitions consisting of T1-weighted (T1W) and dual echo proton density (PD) / T2-weighted (T2W) image contrasts [5, 8] in addition to the monthly OAI ACR QA acquisitions.
Table 2. OAI MR QA acquisition parameters.
Options that were selected to reduce artifacts or improve the accuracy and precision of quantitative measurements include no phase or readout partial Fourier.
| Monthly OAI | Monthly ACR | Annual ACR Additional | ||||||
|---|---|---|---|---|---|---|---|---|
| 2D TSE IW | 2D TSE IW | 3D DESS | 2D MSME SE | 2D TSE IW* | 2D TSE IW | 2D SE T1W | 2D SE PD/T2W | |
| Plane | Sagittal | Axial | Sagittal | Sagittal | Sagittal | Axial | Axial | Axial |
| Matrix (phase) | 307 | 307 | 307 | 269 | 555 | 555 | 256 | 256 |
| Matrix (freq) | 384 | 384 | 384 | 384 | 704 | 704 | 256 | 256 |
| No. of slices | 7 | 7 | 160 | 21 | 1 | 11 | 11 | 11 |
| FOV (mm) | 140 | 140 | 140 | 120 | 250 | 250 | 250 | 250 |
| Slice thickness (mm) | 3 | 3 | 0.7 | 3 | 20 | 3 | 5 | 5 |
| Skip (mm) | 6 | 6 | 0 | 0.5 | 10 | 7 | 5 | 5 |
| Flip Angle (deg) | 180 | 180 | 25 | 90 | 180 | 180 | 90 | 90 |
| TE/TI (ms) | 29 | 29 | 4.7 | 10, 20, 30, 40, 50, 60, 70 | 29 | 29 | 20 | 20 / 80 |
| TR (ms) | 1750 | 1750 | 16.3 | 2700 | 1000 | 1750 | 500 | 2000 |
| BW (Hz/pixel) | 352 | 352 | 183 | 250 | 355 | 355 | 300 | 300 |
| NAV (NEX) | 1 | 1 | 1 | 1 | 2 | 2 | 1 | 1 |
| Echo train length | 5 | 5 | 1 | 1 | 5 | 5 | 1 | 1 |
| Phase Encode Axis | A/P | A/P | A/P | A/P | A/P | A/P | A/P | A/P |
| Slice Partial Fourier | 1 | 1 | 0.75 | 0.75 | 1 | 1 | 1 | 1 |
| X-Resolution (mm) | 0.365 | 0.365 | 0.365 | 0.313 | 0.355 | 0.355 | 0.977 | 0.977 |
| Y-Resolution (mm) | 0.456 | 0.456 | 0.456 | 0.446 | 0.450 | 0.450 | 0.977 | 0.977 |
| Scan time (min) | 1.8 | 1.8 | 10.5 | 10.6 | 4.5 | 3.3 | 2.8 | 8.5 |
The sagittal TSE IW ACR acquisition initially used 256×256 in plane resolution which resulted in pixel dimension 0.98mm×0.98mm.
Monthly OAI QA was performed with the knee coil positioned 60mm offset from magnet isocenter along the right – left (RL) axis to replicate the same physical locations used for right (R60) and left (L60) knee MR exams. Monthly OAI QA acquisitions (Table 2) included similar axial and sagittal TSE acquisitions as the Monthly ACR QA, a multi-slice, multi-echo (MSME) spin echo (SE) acquisition for T2 relaxation time mapping, and a 3D Dual Echo in the Steady State (DESS) sequence for quantitative analysis of cartilage morphometry [2].
Results
QA measurements were obtained for a minimum of 33 months and a maximum of 38 months. 144 monthly OAI, 129 monthly ACR and 16 annual ACR measurements were included in the analysis. Uniformly high quality artifact-free study images were obtained from all four MR facilities. Over the three year period, key criteria for quantitative cartilage morphometry were found to be well within target specifications. All QA performance criteria for MR system stability were met with two exceptions: Knee coil signal uniformity and signal levels varied substantially over time and 3.0mm and 5.0mm slice thickness was consistently larger than expected.
ACR Phantom
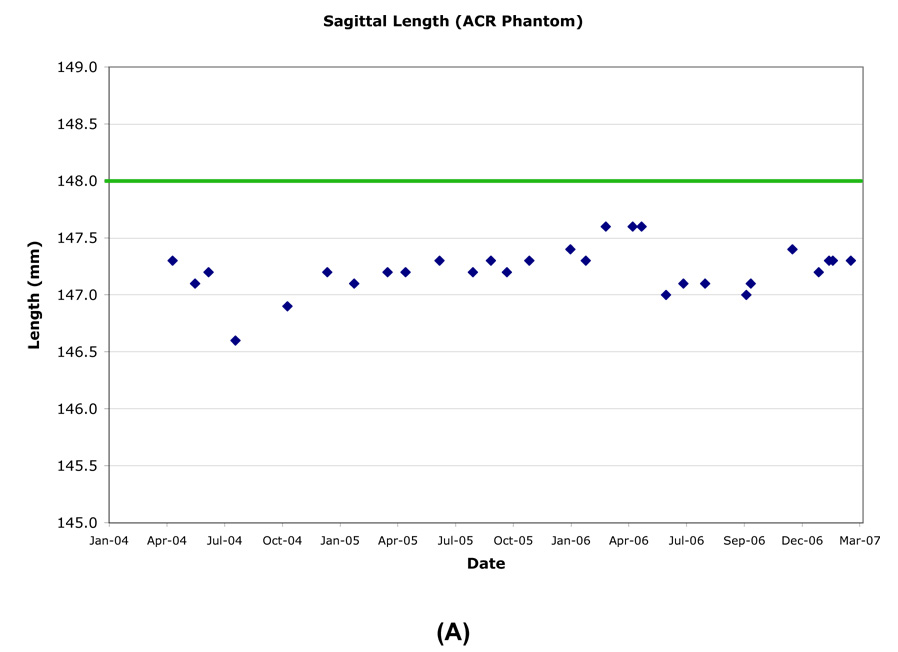
The inside end-to-end length of the ACR phantom was measured superior-inferior (SI) on a central sagittal slice. The longitudinal variation of the inner length was generally within ±0.5mm (±0.51 pixel), except when the phantom was mispositioned (Table 3, Figure 2). However the length was consistently measured to be slightly smaller than the nominal value of 148.0mm.
Table 3.
Longitudinal measurements of ACR phantom geometry.
| Length: | |||||
|---|---|---|---|---|---|
| RMS CV% | Mean (mm) | SD (mm) | Min (mm) | Max (mm) | |
| Site A | 0.14% | 147.2 | 0.21 | 146.6 | 147.6 |
| Site B | 0.17% | 147.3 | 0.25 | 146.4 | 147.5 |
| Site C | 0.19% | 146.6 | 0.28 | 145.8 | 147.1 |
| Site D | 0.14% | 147.0 | 0.21 | 146.6 | 147.4 |
| Diameter: | ||||||
|---|---|---|---|---|---|---|
| RMS CV% (Isocenter) | RMS CV% (+50mm) | Mean (mm) | SD (mm) | Min (mm) | Max (mm) | |
| Site A | 0.07% | 0.05% | 189.7 | 0.13 | 189.3 | 189.8 |
| Site B | 0.06% | 0.07% | 190.1 | 0.15 | 189.8 | 190.7 |
| Site C | 0.11% | 0.13% | 189.8 | 0.21 | 189.2 | 190.1 |
| Site D | 0.06% | 0.06% | 189.9 | 0.12 | 189.4 | 190.0 |
Figure 2.
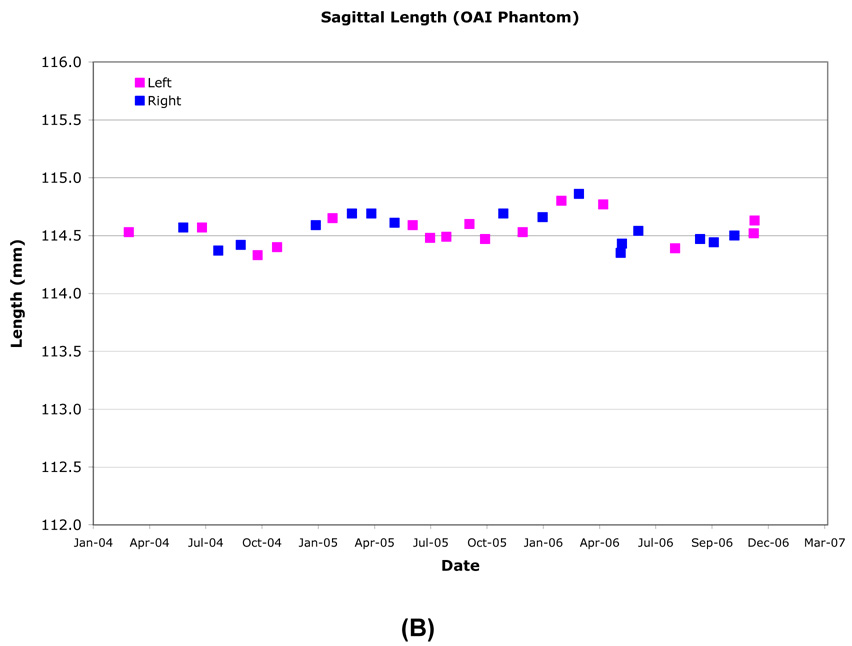
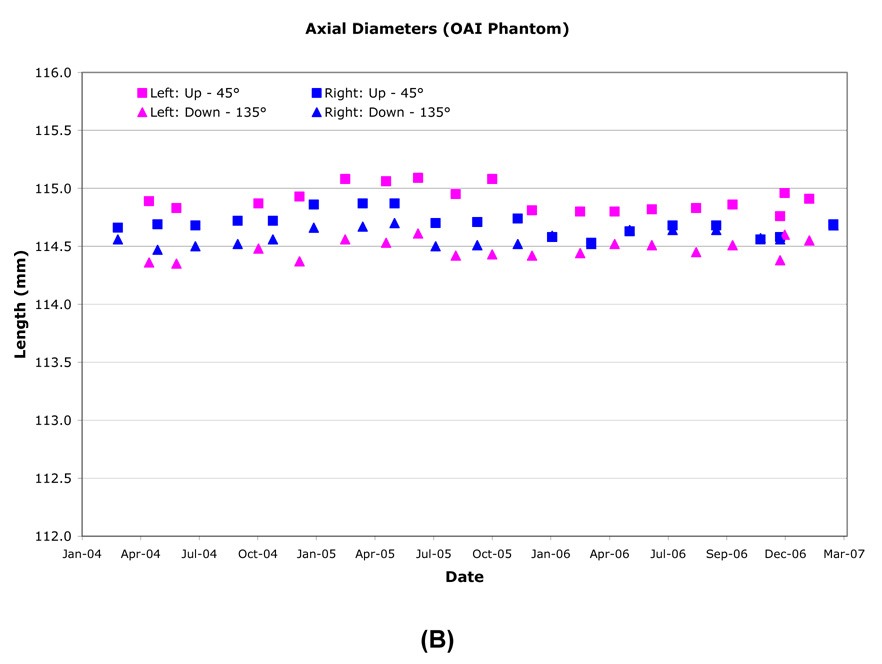
Example longitudinal variation in ACR (A) and OAI (B) phantom length (Site A).
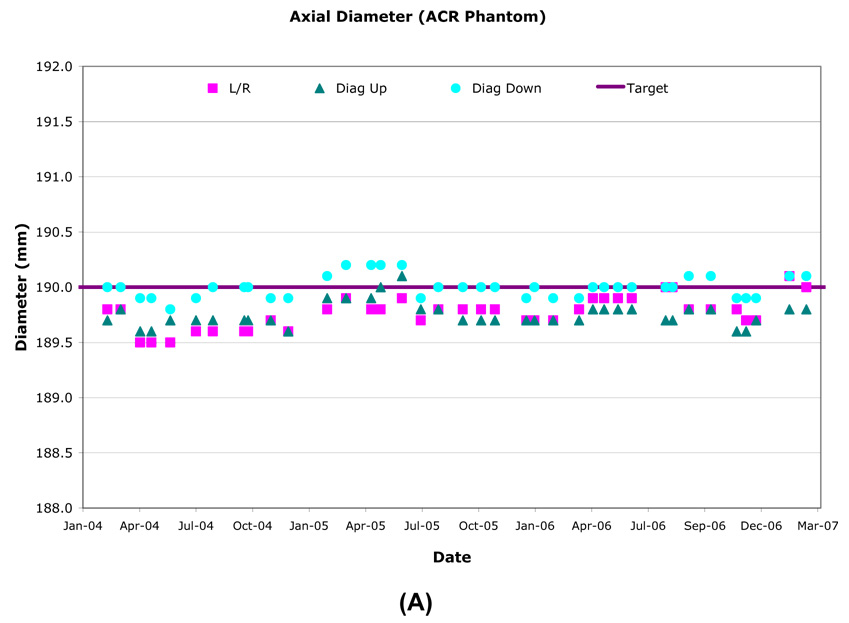
The inside diameter of the ACR phantom was measured anterior-posterior (AP), right-left (RL) and along both diagonals on two axial slices, one at isocenter and one at +50mm along the SI axis. The ACR phantom nominal inner diameter was 190.0mm and longitudinal variation was generally within ±0.5mm (±0.51 pixel) (Table 3, Figure 3). The inner diameter and inner length measurement over time had ≤0.2mm (±0.56 pixel) standard deviations for all sites. Inner diameter longitudinal stability was most accurate and consistent using the RL and two diagonal axis measurements and had <1.0mm variation with most measurements within 0.5mm of the nominal value. The AP axis measurements had greater variability due to the occasional presence of an air bubble.
Figure 3.
Example longitudinal variation in ACR (A) and OAI (B) phantom diameter (Site B).
The slice thickness was determined using:
where “top” and “bottom” are the measured wedge lengths visible at 50% of the maximum signal intensity on the first axial slice. The slice thickness measurements were found to vary only slightly over time <0.2mm (Table 4), with variations resulting from errors in phantom alignment and/or slice placement. However, the slice thickness on all four systems averaged 3.68mm for 3mm slices (monthly ACR) using a TSE acquisition and 5.52mm for 5mm slices (annual ACR) using a SE acquisition, which was 22% and 10% larger than the nominal value, respectively.
Table 4.
Longitudinal variation of slice thickness.
| RMS CV% | Mean (mm) | SD (mm) | Min (mm) | Max (mm) | |
|---|---|---|---|---|---|
| Site A | 1.9% | 3.68 | 0.07 | 3.53 | 3.82 |
| Site B | 2.8% | 3.69 | 0.10 | 3.48 | 3.92 |
| Site C | 4.7% | 3.65 | 0.17 | 3.19 | 3.97 |
| Site D | 2.3% | 3.60 | 0.08 | 3.40 | 3.77 |
Ghost levels were assessed using a large region of interest (ROI) in the phantom center and four small ROIs located above, below, left and right outside the phantom. Ghost level was defined as the mean noise signal in the phase encode direction minus the mean noise in the frequency encode direction expressed as a percentage of the mean signal inside the phantom. Ghost levels were typically ≤0.2%. A service call was made anytime they exceeded 0.5%.
The slice position wedge offset difference was measured on the first and last axial slices (±50mm) and had a maximum allowed offset of ±5.0mm. The wedge offset was always <±2.0mm and was influenced by a combination of z-gradient amplitude calibration and z-gradient non-uniformity.
Low contrast visibility was measured on four low-contrast disks located in axial slices 8–11 (+20mm to +50mm). Each disk had a different thickness, with thicker disks having lower signal. Each disk contained ten ‘spokes’ of three holes each and the hole diameter changed from spoke to spoke. The low contrast object systematically had 38–40 of 40 spokes visible for the PD, T1W and T2W acquisitions and >30 spokes visible for the IW acquisition, if the phantom was aligned properly and the slice prescription was placed through the test objects. These values comply with ACR recommendations for 3T performance.
High contrast spatial resolution was measured on the first axial slice and the smallest objects (0.9mm) were always visualized.
Image uniformity was measured in the center of the phantom using a large ROI (85% of phantom area) and two small ROIs located inside the larger ROI that identify the minimum and maximum signal. Image uniformity:
varied (77.5%–89.5%), with an average across all four sites of 85.5%. SNR of the head coils varied (53.6–91.9), with an average across all four sites of 73.9. Both signal uniformity and SNR decreases were observed as head coils aged with often dramatic improvements when the coil was replaced. Head coil SNR increased by ~44% around December 2005 because the number of averages in the MR acquisition doubled. This change was made to decrease the influence of the noise when measuring phantom diameters.
ACR Cross-Site Calibration
All OAI ACR phantoms were scanned at one site on one day using the Annual ACR acquisitions. In addition to standard quantitative analyses, the variation of phantom inner diameter as a function of angle and slice location was also assessed [4,11,12,13]. Similar measurements were performed at each OAI site using the site phantom within a week of the central measurements.
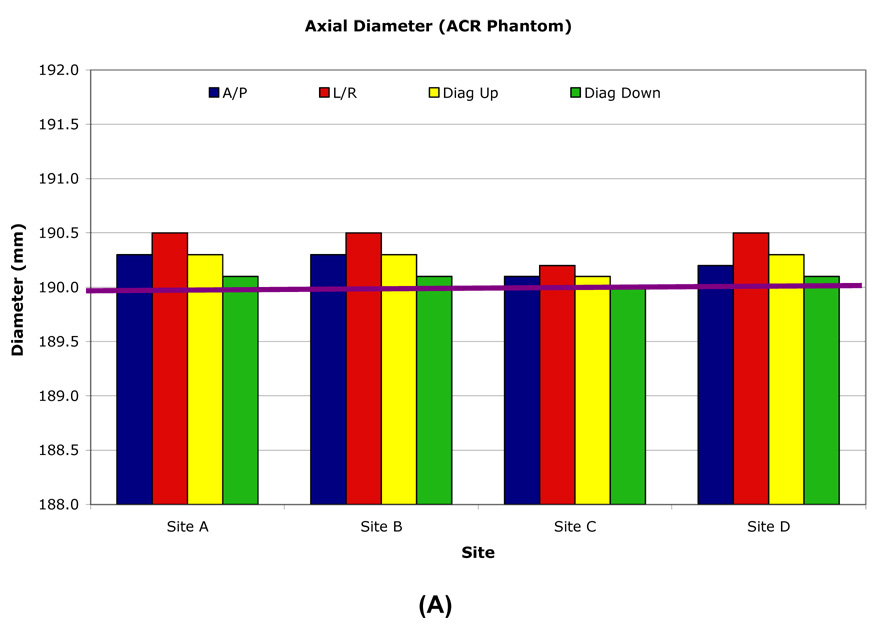
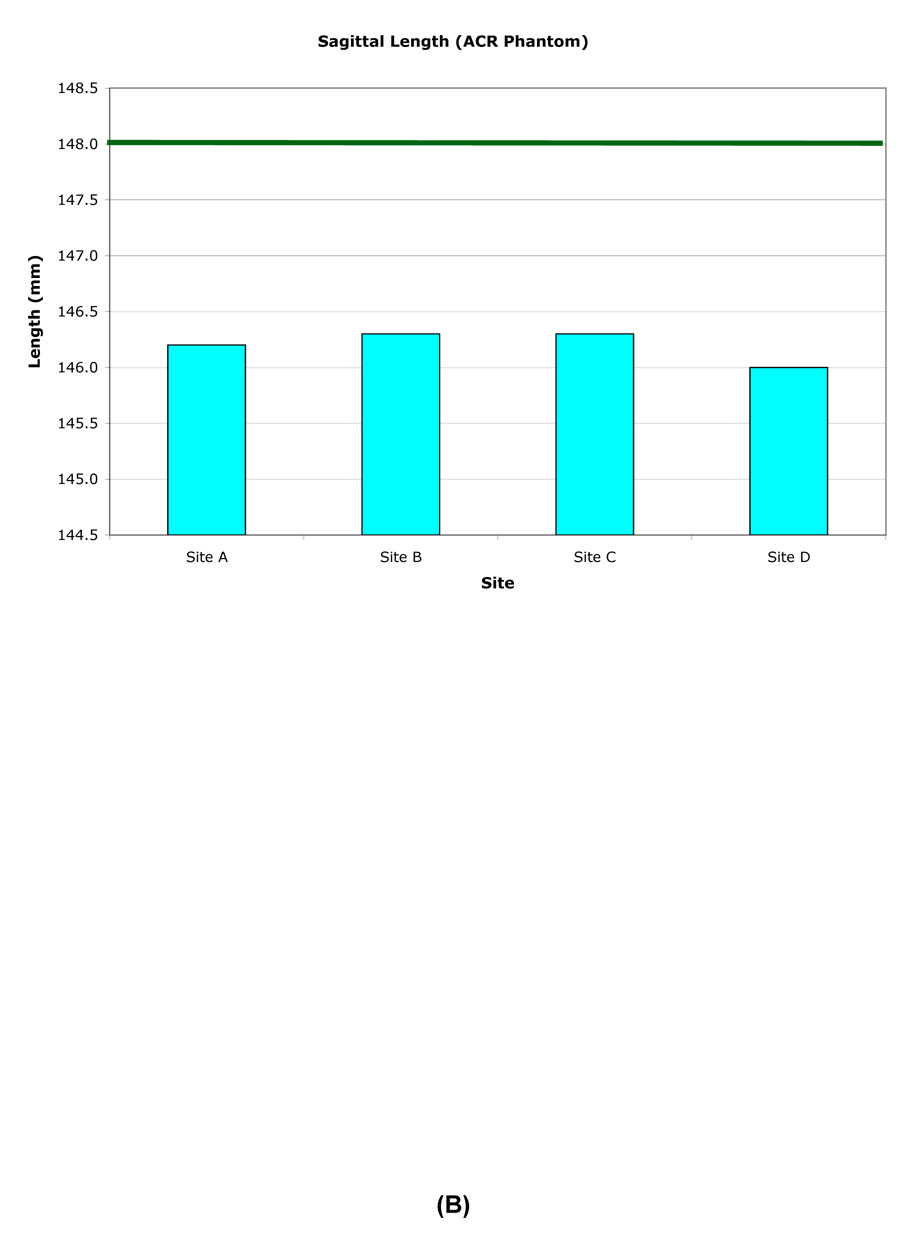
When measured at one site, the inner lengths and diameters were consistent for all phantoms. However, when each phantom was measured at its individual OAI site, small differences were observed between the local and central measurements (Table 5, Figure 4) due to differences in gradient amplitude calibrations.
Table 5.
Central site measurement results for individual ACR phantoms.
| Length (mm) | Diameter (mm) | Slice Thickness (mm) | |
|---|---|---|---|
| Nominal | 148.0 | 190.0 | 3.00 |
| Site A | 146.2 | 190.3 | 3.97 |
| Site B | 146.0 | 190.3 | 4.00 |
| Site C | 146.3 | 190.1 | 3.93 |
| Site D | 146.3 | 190.3 | 3.87 |
Figure 4.
Central site measurement results for individual ACR phantoms. The axial inner diameter (A) nominal value is 190.0mm. The sagittal inner length (B) nominal value is 148.0mm.
OAI Phantom
The inside end-to-end length of the OAI phantoms were measured SI on the mid-phantom sagittal slice. Inner lengths did not vary by more than ±0.25mm (±0.55 pixel; Figure 2). Typical sagittal inner lengths measured at R60 and L60 were indistinguishable when measured one month apart. Combined R60, L60 measurements resulted in standard deviations of ≤0.2mm (<0.55 pixel) for all sites (Table 6).
Table 6.
Longitudinal measurement results for the OAI phantom geometry.
| Length: | ||||||||||
|---|---|---|---|---|---|---|---|---|---|---|
| L60 RMS CV% | L60 Mean (mm) | L60 SD (mm) | L60 Max (mm) | L60 Min (mm) | R60 RMS CV% | R60 Mean (mm) | R60 SD (mm) | R60 Max (mm) | R60 Min (mm) | |
| 0.16% | 114.5 | 0.18 | 114.80 | 114.02 | Site A | 0.17% | 114.5 | 0.2 | 114.90 | 114.10 |
| 0.14% | 114.7 | 0.16 | 114.91 | 114.44 | Site B | 0.14% | 114.7 | 0.16 | 114.93 | 114.40 |
| 0.14% | 114.1 | 0.20 | 114.53 | 113.75 | Site C | 0.14% | 114.1 | 0.20 | 114.46 | 113.81 |
| 0.18% | 114.4 | 0.16 | 114.61 | 114.06 | Site D | 0.18% | 114.5 | 0.16 | 114.71 | 113.81 |
| Diameter: | ||||||||||
|---|---|---|---|---|---|---|---|---|---|---|
| L60 RMS CV% | L60 Mean (mm) | L60 SD (mm) | L60 Max (mm) | L60 Min (mm) | R60 RMS CV% | R60 Mean (mm) | R60 SD (mm) | R60 Max (mm) | R60 Min (mm) | |
| 0.10% | 114.60 | 0.11 | 114.94 | 114.32 | Site A | 0.09% | 114.65 | 0.10 | 114.88 | 114.69 |
| 0.08% | 114.70 | 0.10 | 115.09 | 114.35 | Site B | 0.08% | 114.65 | 0.09 | 114.87 | 114.35 |
| 0.14% | 114.80 | 0.16 | 115.10 | 114.44 | Site C | 0.15% | 114.70 | 0.17 | 115.04 | 114.50 |
| 0.07% | 114.65 | 0.08 | 115.01 | 114.44 | Site D | 0.27% | 114.70 | 0.31 | 116.13 | 114.35 |
| Spherical Volume: | ||||||||||
|---|---|---|---|---|---|---|---|---|---|---|
| L60 RMS CV% | L60 Mean (mm3) | L60 SD (mm3) | L60 Max (mm3) | L60 Min (mm3) | R60 RMS CV% | R60 Mean (mm3) | R60 SD (mm3) | R60 Max (mm3) | R60 Min (mm3) | |
| 0.60% | 210.57 | 1.25 | 212.69 | 208.50 | Site A | 0.52% | 211.12 | 1.09 | 212.90 | 209.25 |
| 0.27% | 211.52 | 0.57 | 212.42 | 209.80 | Site B | 0.28% | 211.06 | 0.59 | 211.91 | 209.79 |
| 0.45% | 209.720 | 0.946 | 211.455 | 208.428 | Site C | 0.72% | 208.946 | 1.509 | 210.746 | 203.723 |
| 0.34% | 213.16 | 0.73 | 214.46 | 211.97 | Site D | 0.24% | 213.18 | 0.52 | 214.31 | 212.54 |
The inner diameters of the OAI phantoms were measured AP, RL and along both diagonals on an axial slice located at isocenter. Typical diameters measured at R60 and L60 were highly correlated and varied by ≤0.25mm (≤0.68 pixel). The largest inner diameter changes were along the RL axis due to the fill port location, until November 2005, when the phantom was rotated to align the port location with any air bubbles. Thereafter, the largest changes were along the AP axis. All sites had <±0.25mm (<±0.68 pixel) longitudinal variation in inner diameter (Figure 3, Table 6), although one or more episodic changes of ~0.5mm were observed. Both R60 and L60 locations had only small inner diameter standard deviations (≤0.12mm, ≤0.33 pixel), with R60 at Site D ≤0.3mm (≤0.82 pixel), and Site C R60 and L60 at ≤0.2mm (≤0.55 pixel). Site B experienced small seasonal changes (0.28%) measured in both phantom diameter and length (Figure 2 and Figure 3) which is greater than expected from only thermal expansion/contraction of the acrylic OAI phantom.
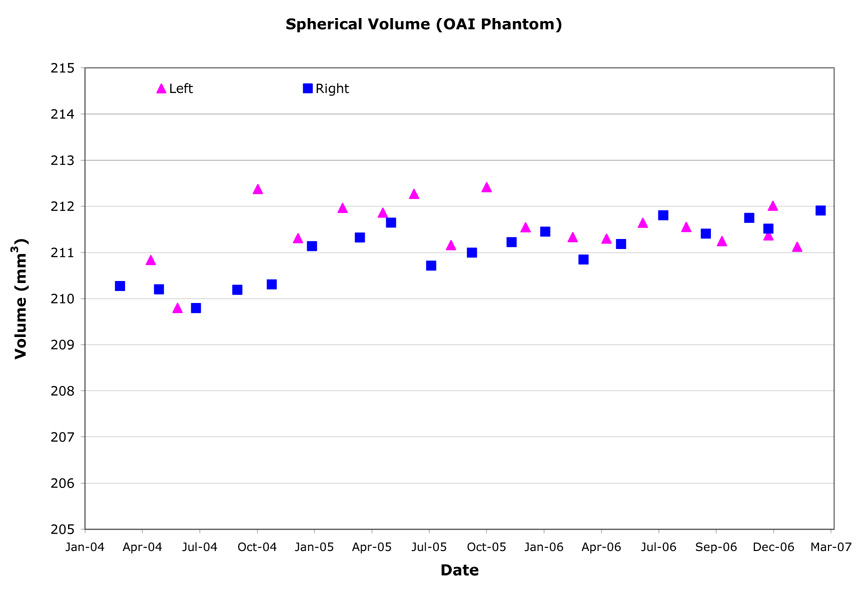
Three-dimensional spherical volumes were computed by summing the area contained within the exterior surface of the inner compartment for each slice of the DESS acquisition as determined from automated edge detection. The spherical volumes varied very little over time (Table 6, Figure 5) and variations were further reduced in November 2005 when the phantom was rotated to place the fill ports vertically. Longitudinal variation ranged from 0.24%–0.72% CV, with an overall RMS CV of 0.46%.
Figure 5.
Example longitudinal variation in OAI phantom spherical volume (Site B).
SNRs for both outer and inner phantom regions were systematically and substantially lower for L60 than R60 by 10–15% at two sites for the majority of the quadrature transmit/receive knee coils (Table 7). There were exceptions at the other two sites where the R60-L60 SNR difference was very small and SNR remained stable (sagittal) or increased (axial) over time. Knee coil SNR generally trended downwards over time. When the SNR dropped precipitously or gradually decreased to 85–90% of the initial value, the coil was replaced by one of the two on-site backups and was subsequently sent for replacement.
Table 7.
Longitudinal SNR from OAI phantom.
| L60 RMS CV% | L60 Mean | L60 SD | L60 Max | L60 Min | R60 RMS CV % | R60 Mean | R60 SD | R60 Max | R60 Min | |
|---|---|---|---|---|---|---|---|---|---|---|
| 3.9% | 83.33 | 3.23 | 91.85 | 39.20 | Site A | 6.2% | 80.24 | 5.00 | 95.16 | 40.53 |
| 2.8% | 83.42 | 2.32 | 94.93 | 75.06 | Site B | 7.3% | 88.73 | 6.47 | 104.69 | 75.75 |
| 4.7% | 85.81 | 4.00 | 125.41 | 71.23 | Site C | 9.6% | 93.25 | 8.91 | 100.29 | 73.78 |
| 6.1% | 89.58 | 5.43 | 97.00 | 78.72 | Site D | 7.9% | 88.90 | 7.06 | 139.01 | 74.46 |
Ghost levels were measured on the central axial image along the phase encode axis in the same manner as for the ACR phantom and were found to be <0.2%. Falsely high automated analysis results were reported when the phantom fill ports contained fluid. Upon manual review, no ghost problems were identified.
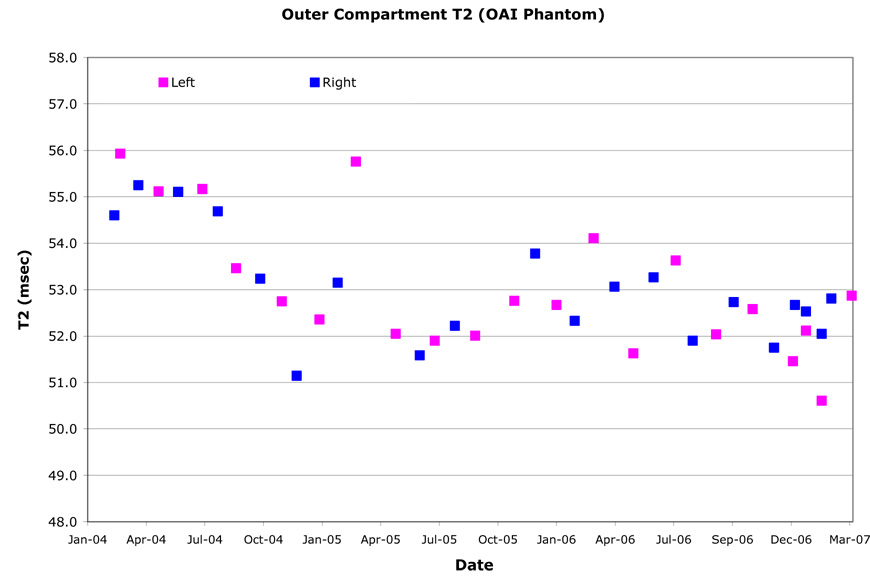
T2 relaxation times were computed on the central sagittal image by fitting a single exponential to the signal intensities from the second through seventh echo times on a pixel-by-pixel basis. The spatial variation of the T2 value (Table 8) was assessed by dividing the outer compartment into quadrants on the central sagittal image. For all MR systems, except Site C, the right and left region T2 values were indistinguishable (Figure 6). The T2 values of the anterior and posterior halves had complex relationships however. The T2 value longitudinal change ranged 2.3%–18.9%. The absolute T2 value was significantly lower at Site A than that of the same solution measured on the other MR systems. In addition, Site A had T2 value longitudinal variations well outside the expected range (13.3% and 18.8% CV). At Site B, small periodic changes in T2 value were observed (~3.5% CV).
Table 8.
Spatial and longitudinal variation for the OAI phantom outer compartment T2 relaxation times.
| L60 Mean T2 (msec) | L60 Spatial RMS CV% | L60 Longitudinal RMS CV% | R60 Mean T2 (msec) | R60 Spatial RMS CV% | R60 Longitudinal RMS CV% | |
|---|---|---|---|---|---|---|
| 47.5 | 0.4% | 13.6% | Site A | 45.9 | 0.8% | 18.9% |
| 50.7 | 0.4% | 3.5% | Site B | 50.7 | 0.3% | 3.1% |
| 51.6 | 1.1% | 4.6% | Site C | 50.4 | 1.4% | 4.9% |
| 53.3 | 0.4% | 2.6% | Site D | 53.0 | 0.2% | 2.3% |
Figure 6.
Example outer compartment T2 values for OAI phantom (Site D). The OAI phantom was dropped and replaced in August 2004. The knee coil was replaced in August 2005.
OAI Cross-Site Calibration
All OAI phantoms were scanned on one day at one site (Table 9). The same acquisitions and quantitative evaluations were performed as for the monthly OAI QA evaluations. Similar measurements were then performed within one week at each OAI site using the site phantom.
Table 9.
Central site measurement results for individual OAI phantoms.
| L60 Diameter (mm) | R60 Diameter (mm) | L60 Length (mm) | R60 Length (mm) | T2 (msec) | |
|---|---|---|---|---|---|
|
Average ± SD (min, max) |
114.82 ± 0.20 (114.54, 114.91) |
113.74 ± 0.24 (113.43, 114.0) |
50.01 ± 0.95 (48.96, 50.79) |
||
| Site A | 114.86 | 114.80 | 113.48 | 113.43 | -- |
| Site B | 114.54 | 114.80 | 113.79 | 114.00 | 48.96 |
| Site C | 114.90 | 114.91 | 113.81 | 113.69 | 50.79 |
| Site D | 114.90 | 114.85 | 113.79 | 113.84 | 50.28 |
Phantom inner length and diameter were consistent when measured at one site, and measurements performed at each site were consistent with those made at one site (Table 9). T2 values varied slightly during the single site measurement, with the Site B phantom having a significantly lower value (3.1%). The original Site A outer compartment solution was lost in shipping, hence cross-calibration and comparison to historic measured values was not possible. T2 measurements made at each site were systematically lower than those measured during cross-calibration, possibly due to temperature differences or, more likely, variations in coil excitation/refocus angle performance.
Discussion
Few publications have evaluated the ability of multiple MR systems, located at diverse and physically distant facilities with different service engineers, to perform longitudinal, quantitative measurements. We compare three years of longitudinal OAI MR QA results to those of prior publications.
Geometry
Absolute geometric accuracy is important not only for image-guided radiosurgery and biopsy [10,11,12], but also for longitudinal quantitation of morphologic features. MR geometric distortion is a 3D error caused by a combination of magnetic field inhomogeneity and gradient coil design, installation, and calibration [14]. All measurements presented were made with the manufacturer’s standard 2D spatial correction algorithm applied during image reconstruction and resulted in reduced geometric distortion in the plane that the corrections were applied. However, with this approach, corrections are not made in the slice direction. To further minimize the impact of geometric distortion on quantitative morphometric analysis, all QA and subject exams were systematically located as close to magnet and gradient isocenter as possible (R60 and L60 with the minimum anterior offset allowed by the patient table).
We measured small longitudinal geometric variations on the OAI MR systems of 0.04% and 0.56% RMS CV for a 190.0mm diameter and 148.0mm length object. Keevil et al. [9] measured inner diameter reproducibility of 0.6% ± 0.2% over a 160.0mm diameter object over 3.5 years on a 1.5T MR system with configuration similar to that used in the OAI. The OAI MR QA evaluation and several other studies [3,9,13] found the largest impact on measurement accuracy and reproducibility to be in-plane spatial resolution, SNR for edge detection, and air bubbles in the test object. The larger length variability, compared to diameter, found in the OAI ACR phantom assessment was caused by the lower sagittal in-plane spatial resolution compared to the axial images and likely does not reflect the actual situation, similar to other studies [9].
Under all circumstances, the larger test object (ACR phantom) was more sensitive than the smaller OAI phantom to changes in spatial dimension. Absolute dimensional accuracy was achieved for the diameter measures both on a site-by-site basis and for measurements at one site. However length measurements were consistently 2mm–4mm shorter than the nominal value. During cross-calibration, all ACR phantoms had virtually identical length by MR measurement. This spatial error is within that found by other authors [11,12]. Wang et al. [11] found the maximal positional error over a 95mm radius 3D geometric distortion sphere to be 2.0mm–2.5mm in similar configuration MR systems as those used in the OAI. Wang et al. [11,12] also cautioned that geometric distortion arising from faster slew rate gradient coils was larger (2.0mm–7.0mm).
The presented longitudinal measurements indicate that changes in MR system geometric distortion should have minimal impact on the accuracy and reproducibility of cartilage thickness and volume quantification. This conclusion is supported by spherical volume longitudinal measurements (0.46% RMS CV) that are an order of magnitude smaller than the unpaired (repositioning and reanalysis) precision error found in the OAI pilot studies for cartilage volume and thickness for the weight-bearing femorotibial compartment with coronal FLASH 3.0–6.4%, coronal MPR DESS 2.4–6.2%, and sagittal DESS 2.3–8.2% RMS CV [16]. The longitudinal variation in 3D volume is also much smaller than the average precision errors for paired analysis of longitudinal change in the weight-bearing femorotibial joint (FLASH 1.8%, MPR DESS 3.0%, DESS 2.6% RMS CV) [17].
Other Assessments
Slice thickness was consistently 10% (SE) to 22% (TSE) larger than requested. The manufacturer was notified during acceptance testing that slice thickness failed specification; however it could not be corrected due to the inter-relationship between slice thickness and other calibrations. Keevil et al. [9] also observed systematically larger slice thickness on Siemens 1.5T MR systems. DeWilde et al. [3], which excluded Siemens equipment, had an average of 3.13mm and 5.07mm for all MR systems tested with 3mm (N=40) and 5mm (N=63) thick slices. The systematically larger slice thickness appears to be a vendor-specific issue. Thicker slices result in higher SNR images and potentially overlapping slices in TSE and SE acquisitions. Slice overlap may introduce systematic bias in the absolute value of the T2 measurements. To start the study in a timely manner, the OAI opted to have a stable slice thickness rather than a correct slice thickness so that T2 measurements can be compared longitudinally.
Image uniformity and SNR rely upon the spatial homogeneity and accuracy of the excitation and refocusing pulses as well as the uniformity of signal detection across the coil. Keevil et al. [9] found the longitudinal SNR and homogeneity in the head coil to be 34.9±4.2 and 4.19±0.6 (88% uniformity) with 1.5T Siemens MR systems. For the OAI, the longitudinal SNR and signal uniformity in the head coil were 73.9±9.6 and 85.2%±1.8%, respectively.
OAI phantom inner region uniformity (knee coil) was found to be consistent at R60 and L60, and remained stable over time. Outer region image uniformity and SNR, however, was lower and less consistent and was sensitive to coil position inside the magnet. Longitudinal variations in image uniformity and SNR (Table 7) were found. Poor outer region image uniformity predicts that signal shading, accidental saturation of water signal or incompletion saturation of fat signal [18] may be observed in the imaging FOV outside the immediate knee joint. Subsequent assessment of OAI knee images for QA purposes confirm that this occurred on some sagittal TSE IW fat suppressed images (20cm FOV). At the time of study start, there were limited 3T coil options. The performance of the head and knee coils were suboptimal and replacements were not an improvement compared to the initial units. Newer technology 3T coils, including phased array knee coils, are now available from several manufacturers.
Ghost levels were ≤0.2% and were better than expected. This finding was welcomed because the presence of ghosts can degrade the quality of cartilage segmentation and T2 value measurement. The MR system characteristics that were found to affect the ghost level were mechanical vibration and eddy currents, particularly those resulting from increases in the magnet cryoshield temperature.
Some traditional MR quality assessments [3–5] did not vary significantly over time including slice position, wedge offset difference, landmark, and high contrast spatial resolution. Since these measures varied so little and concurrently have limited impact on the longitudinal quantification of cartilage morphology, they were not actively monitored. Also specific to the OAI, the head coil image uniformity and SNR have no impact on the study measurements since this coil is only used for QA purposes. We found that low contrast object visibility does not offer insight into system performance at 3T, primarily because of the good SNR and CNR, and is a more valuable assessment at lower magnetic field strengths.
T2
T2 values were generally comparable between sites as well as between the right and left knee, and were within the accuracy of other multi-site publications [15]. Except for one site, they were relatively stable over time. T2 measurements are known to be influenced by environmental and system issues, including magnet room temperature (signal pre-amplifier and coil sensitivity), phantom temperature (background noise), coil transmit uniformity, SNR, and to a lesser extent, receive coil uniformity. Knee coil transmit variability and poor magnet room temperature/humidity control are thought to be the primary contributors to the longitudinal variability in T2. Sites with fewer coil uniformity issues had smaller T2 variability. Because of its much smaller size, phantom measurements should have greater variability than those made in human knee cartilage; the phantom solution should be more sensitive to changes in temperature or concentration as well as potential bacterial growth. While temperature and humidity control of the magnet room was performed, it is recommended that an infrared thermal monitoring device measure phantom temperature in the magnet bore when performing any relaxation time measurement.
Conclusions
Independent centralized QA analyses were used to assess the longitudinal and cross-sectional consistency of key MR image characteristics including SNR, signal uniformity, T2 values and geometric distortion for the four OAI 3T MR systems over a 3 year period. Spatial reproducibility measurements indicated that longitudinal MR system variations should have minimal impact on the accuracy and reproducibility of cartilage morphometry, including thickness and volume quantification. In fact, longitudinal measurements of spherical volume found 0.46% RMS CV. This variation is 5–20 times smaller than the unpaired (reanalysis) error [16] and 4–7 times smaller than the paired (longitudinal) [17] precision error found in the OAI pilot studies for cartilage volume and thickness for the weight-bearing femorotibial compartment. This longitudinal stability should enable baseline images to be directly compared with those obtained years later during follow-up visits. In addition, the site-to-site consistency and accuracy is sufficient to allow the results from all sites to be combined.
Measurements on the larger ACR phantom were more sensitive to spatial dimension changes compared to those made on the smaller OAI phantom. This was expected and we recommend use of an even larger rigid test object for geometric accuracy measurements.
Some equipment limitations were found: slice thickness was systematically 10%–22% greater than nominal. However, these measurements remained stable over time. Additionally, substantial time variances were found in knee coil signal intensity and uniformity.
Acknowledgements
This manuscript has been reviewed by the OAI Publications committee for scientific content and data interpretation. The research reported in this article was supported in part by contracts N01-AR-2-2258, N01-AR-2-2259, N01-AR-2-2260, N01-AR-2-2261 and N01-AR-2-2262
We are grateful to all the OAI MR Technologists and affiliated team members for their participation in acquisition of the QA data, discussions of the QA protocol, and excellent attention to detail throughout the process.
Members of the OAI Imaging Working Group who also participated in discussions of the MR quality assurance and acceptance testing process included: Bernard J. Dardzinski PhD, Manish Kothari PhD, Gayle Lester PhD, and Michael Nevitt PhD.
Syllabus of Abbreviations
- CNR
contrast-to-noise ratio
- CV
coefficient of variation
- DESS
dual-echo steady state
- FLASH
fast low-angle shot
- FOV
field of view
- GRE
gradient-echo
- IW
intermediate-weighted
- MSME
multi-slice, multi-echo
- PD
proton density weighted
- RMS
root mean square
- SE
spin echo
- SNR
signal-to-noise ratio
- T1W
T1-weighted
- T2W
T2-weighted
- TE
echo time
- TR
repetition time
- TSE
turbo spin-echo
- WE
water excitation
Footnotes
Publisher's Disclaimer: This is a PDF file of an unedited manuscript that has been accepted for publication. As a service to our customers we are providing this early version of the manuscript. The manuscript will undergo copyediting, typesetting, and review of the resulting proof before it is published in its final citable form. Please note that during the production process errors may be discovered which could affect the content, and all legal disclaimers that apply to the journal pertain.
References
- 1.Nevitt M, Jackson R, Hochberg M, Bathon J, Eaton C, Kwoh K, et al. Design and Implementation of the Osteoarthritis Initiative Cohort Study. To be submitted to Osteoarthritis and Cartilage. [Google Scholar]
- 2.Peterfy CG, Schneider E, White D, Dardzinski BJ, Nevitt M, Eckstein F, et al. The Osteoarthritis Initiative: Protocol Design Considerations for Magnetic Resonance Imaging of the Knee. 2007 December; Submitted to Osteoarthritis and Cartilage. [Google Scholar]
- 3.DeWilde J, Price D, Curran J, Williams J, Kitney R. Standarization of Performance Evaluation in MRI: 13 Years’ Experience of Intersystem Comparison. Concepts in Magn Reson. 2002;15(1):111–116. [Google Scholar]
- 4.NEMA. Determination of two-dimensional geometric distortion in diagnostic magnetic resonance images. Document MS 2. Washington, DC: National Electrical Manufacturer’s Association; 1989. [Google Scholar]
- 5.Price RR, Axel L, Morgan T, Newman R, Perman W, Schneiders S, et al. Quality Assurance methods and phantoms for magnetic resonance imaging: report of AAPM Nuclear Magnetic Resonance Task Group No. 1a. Med Phys. 1990;17:287–295. doi: 10.1118/1.596566. [DOI] [PubMed] [Google Scholar]
- 6.Och JG, Clarke GD, Sobol WT, Rosen CW, Mun SK. Acceptance testing of magnetic resonance imaging systems: report of AAPM Nuclear Magnetic Resonance Task Group No. 6. Med Phys. 1992;19:217–229. doi: 10.1118/1.596903. [DOI] [PubMed] [Google Scholar]
- 7.American College of Radiology (ACR) MRI Accreditation Program requirements. http://www.acr.org/accreditation/mri/mri.html.
- 8.American College of Radiology (ACR) Phantom test guidance for the ACR MRI Accreditation Program. Reston, VA: 1998. [Google Scholar]
- 9.Keevil SF, Barbiroli B, Collins DJ, Danielsen ER, Hennig J, Henriksen O, et al. Quality Assessment in in vivo NMR Spectroscopy: IV. A Multi-center Trial of Test Objects and Protocols for Performance Assessment in Clinical NMR Spectroscopy. Magn. Reson. Imaging. 1995;13(1):139–157. doi: 10.1016/0730-725x(94)00090-p. [DOI] [PubMed] [Google Scholar]
- 10.Sumanaweera TS, Glover GH, Song S, Adler J, Napel S. Quantifying MRI geometric distortion in tissue. Magn Reson Med. 1994;31:40–47. doi: 10.1002/mrm.1910310106. [DOI] [PubMed] [Google Scholar]
- 11.Wang D, Strugnell W, Cowin G, Doddrell DM, Slaughter R. Geometric distortion in clinical MRI systems. Part I: evaluation using a 3D phantom. Magn Reson Imaging. 2004;22(9):1211–1221. doi: 10.1016/j.mri.2004.08.012. [DOI] [PubMed] [Google Scholar]
- 12.Wang D, Doddrell DM. Geometric Distortion in Structural Magnetic Resonance Imaging. Current Medical Imaging Reviews. 2005;1:49–60. [Google Scholar]
- 13.Hyde RJ, Ellis JH, Gardner EA, Zhang Y, Carson PL. MRI Scanner Variability Studies using a Semi-automated Analysis System. Magn Reson Imaging. 1994;12(7):1089–1097. doi: 10.1016/0730-725x(94)91241-n. [DOI] [PubMed] [Google Scholar]
- 14.Lerski RA, de Certaines JD., II Perfomance Assessment and Quality Control in MRI by Eurospin Test Objects and Protocols. Magn Reson Imaging. 1993;11(6):817–833. doi: 10.1016/0730-725x(93)90199-n. [DOI] [PubMed] [Google Scholar]
- 15.Lerski RA, McRobbie DW, Straughan, Walker PM, de Certaines JD, Bernard AM., V Multi-Center Trial with Protocols and Prototype Test Objects for the Assessment of MRI Equipment. Magn Reson Imaging. 1998;6(2):201–214. doi: 10.1016/0730-725x(88)90451-1. [DOI] [PubMed] [Google Scholar]
- 16.Eckstein F, Hudelmaier M, Wirth W, Kiefer B, Jackson R, Yu J, Eaton CB, Schneider E. Double Echo Steady State (DESS) Magnetic Resonance Imaging of Knee Articular Cartilage at 3 Tesla - a Pilot Study for the Osteoarthritis Initiative. Ann. Rheum. Dis. 2006;65:433–441. doi: 10.1136/ard.2005.039370. [DOI] [PMC free article] [PubMed] [Google Scholar]
- 17.Eckstein F, Kunz M, Schutzer M, Hudelmaier M, Jackson R, Yu J, Eaton CB, Schneider E. Two Year Longitudinal Change and Test-Retest-Precision of Knee Cartilage Morphology in a Pilot Study for the Osteoarthritis Initiative. Osteoarth. Cart. 2007;15:1326–1332. doi: 10.1016/j.joca.2007.04.007. [DOI] [PMC free article] [PubMed] [Google Scholar]
- 18.Haase A, Frahm J, Haenicke W, Matthaei D. 1H NMR chemical shift selective (CHESS) imaging. Phys. Med. Biol. 1985;30:341–344. doi: 10.1088/0031-9155/30/4/008. [DOI] [PubMed] [Google Scholar]


