

Abstract
One of the limitations on imaging fluorescent proteins within living cells is that they are usually present in small numbers and need to be detected over a large background. We have developed the means to isolate specific fluorescence signals from background by using lock-in detection of the modulated fluorescence of a class of optical probe termed “optical switches.” This optical lock-in detection (OLID) approach involves modulating the fluorescence emission of the probe through deterministic, optical control of its fluorescent and nonfluorescent states, and subsequently applying a lock-in detection method to isolate the modulated signal of interest from nonmodulated background signals. Cross-correlation analysis provides a measure of correlation between the total fluorescence emission within single pixels of an image detected over several cycles of optical switching and a reference waveform detected within the same image over the same switching cycles. This approach to imaging provides a means to selectively detect the emission from optical switch probes among a larger population of conventional fluorescent probes and is compatible with conventional microscopes. OLID using nitrospirobenzopyran-based probes and the genetically encoded Dronpa fluorescent protein are shown to generate high-contrast images of specific structures and proteins in labeled cells in cultured and explanted neurons and in live Xenopus embryos and zebrafish larvae.
Keywords: high-contrast, optical switches, “ac”-imaging, fluorescence microscopy
Understanding the molecular basis for the regulation of complex biological processes such as cell motility and proliferation requires analysis of the distribution and dynamics of protein interactions within living cells in culture and in intact tissue (1). Tremendous advances have been made toward the development of new optical probes (2, 3) and imaging techniques that are capable of detecting proteins down to the level of single molecules (4–11). However, in living cells, such detection is compromised by autofluorescence, which can amount to several thousand equivalents of fluorescein per cell (12), as well as by light scattering (13). A major challenge in live-cell imaging, therefore, is to develop classes of probes and imaging techniques that are capable of resolving fluorescence signals from synthetic probes or genetically encoded fluorescent proteins in living cells and tissue against large background signals that may vary in time and space.
A simple and highly-effective approach for isolating a specific fluorescence signal from a large background is to reversibly modulate the fluorescence intensity of only a probe of interest that is bound to a specific protein by applying a uniform, rapid and specific perturbation (e.g., a change in temperature (14), pressure (15), or voltage (16) to which that probe is uniquely attuned. The modulated fluorescence can be isolated from other steady sources of background fluorescence by lock-in detection, making it possible to specifically extract the probe fluorescence even when it constitutes 0.1% or less of the total signal (16). Employing this concept, we developed optical lock-in detection (OLID) as a means for contrast-enhanced imaging of probes within living cells. We demonstrate OLID on a chemical probe, nitrospirobenzopyran (nitroBIPS; 17–18), and on a fluorescent protein, Dronpa (19), both of which can be driven optically in a reversible manner between nonfluorescent and fluorescent states. These correspond respectively to the spiro (SP) and merocyanine (MC) states for nitroBIPS and the trans and cis states for Dronpa. Cross-correlation analysis is used to isolate the modulated signal of the probe and generate a pixel-by-pixel cross-correlation image, which enhances the contrast of the probe of interest over the background.
Several major advances in microscopy have been reported recently that exploit photochemical transitions between a nonfluorescent and fluorescent state of probe-labeled structures, including the superresolution imaging techniques of stochastic reconstruction optical microscopy (STORM), photoactivation light microscopy (PALM/FPALM) and stimulated emission depletion (STED) (6–11). In this study, the OLID approach is used to image ensembles of optical switch-labeled proteins in living cells, although by using a suitable high-quantum-yield optical switch probe, it should be possible to use OLID imaging microscopy to realize both superresolution and image contrast at the single-molecule level.
OLID using optical switch probes described herein affords key advantages for high-contrast imaging: (i) the mechanisms of optical switching of nitroBIPS (17–18, 20–21) and related photochromes (22) and Dronpa (19, 23) are known, and do not require chemical additives; (ii) optical switching between the two states (<2 μs) is much faster than probes used in PALM and STORM; (iii) optically driven transitions occur in the entire population of probe molecules, providing large signals and rapid imaging; and (iv) kinetic signatures and quantum yields for excited-state transitions can easily be measured in the sample and are used for lock-in detection. Thus, the properties of optically switched organic dyes and fluorescent proteins in OLID are compatible with rapid imaging of specific proteins and structures in live cells and within live animals and can be readily used in most laboratories on existing microscopes.
Results
Deterministic Control of Optical-Switch Probe Fluorescence.
nitroBIPS and its derivatives (Fig. 1A) (17–18) undergo deterministic, rapid and reversible, optically driven, excited-state transitions between two distinct states, only one of which is fluorescent. As illustrated in Fig. 1B for nitroBIPS, a cycle of optical switching begins with excitation of the nonfluorescent SP state with either 2-photon (720 nm) or single-photon near-UV (365 nm) light, eliciting an excited-state isomerization to the fluorescent MC state. Subsequent excitation of MC using 543-nm light induces either red fluorescence or photoisomerization back to the nonfluorescent SP state. These rapid reactions proceed with defined quantum yields (20, 21) that lead to quantitative and deterministic interconversions between the SP and MC states within a single cycle of optical switching (Fig. 1E).
Fig. 1.

Cyclic excitation repeatedly switches nitroBIPS fluorescence on and off. (A) Structure and excited-state reactions of the C11-nitroBIPS optical switch. Excitation of nonfluorescent SP state with either 2-photon (720 nm) or single-photon near-UV (365 nm) light elicits isomerization to fluorescent MC state. Subsequent excitation of MC (543 nm) induces red fluorescence or photoisomerization to the nonfluorescent SP state. (B) Defined waveform of optical perturbation of nitroBIPS results in deterministic control of fluorescent and nonfluorescent states. Progress of photochemical reactions is detected by using the fluorescence of the MC-state of nitroBIPS. (C–E) Cycling MC-fluorescence in live NIH 3T3 cells loaded with thiol-reactive 8-IodomethylBIPS. (C) Single image of cells at peak fluorescence. (D) Ten cycles of optical switching as seen in MC-fluorescence images of cells shown in C. Each cycle consists of a 100-ms pulse of 365-nm light (yellow asterisk), followed by a series of 1-s scans of the field using 543 nm and imaged with a 560-nm long-pass filter. (E) Trace of the normalized modulated intensity of MC-fluorescence (internal reference waveform) in one cell (C, green box) over 10 cycles of optical switching.
We first examined the ability of light to modulate the fluorescence of two synthetic switches within live cells, the thiol-reactive probe 8-iodomethyl-nitroBIPS (17–18) and the membrane probe C11-nitroBIPS (Fig. 1A). The transition from SP to MC was detected as a rapid increase in MC fluorescence that was complete within a single 2-photon scan (1.6-μs pixel dwell time) or within a 100-ms pulse of 365-nm light (Fig. 1 C–E). The conversion of MC to SP on the other hand, was elicited by using 543-nm excitation at an intensity that required several sequential scans of the field, each of which led to a defined decrease of MC fluorescence, according to the quantum yield for the MC to SP photoisomerization (20, 21). This decline in fluorescence was tracked over time for all pixels within the image. The repeated cycles of interconversion between the SP and MC states led to a characteristic saw-tooth waveform, with peak-to-trough MC-fluorescence levels that varied by <10% over 10 cycles of optical switching (Fig. 1E). The reproducibility of the increase and decrease in fluorescence demonstrates that nitroBIPS undergoes high-fidelity optical switching and is largely resistant to fatigue. From previous studies (17, 18), we know that the time constant for thermally driven (dark) transition of MC to SP is ≈3,000 s for protein-bound nitroBIPS, i.e., slow enough to enable nitroBIPS to function as an all-optically controlled switch. Thus, nitroBIPS-derived probes undergo 1- and 2-photon-driven, rapid, efficient, and high-fidelity optical switching within living cells using excitation intensities that are commonly used without toxicity in live-cell microscopy.
The genetically encoded protein Dronpa variant of the GFP (19, 23) undergoes optically driven, excited-state transitions between a fluorescent cis state and a nonfluorescent trans state with defined quantum yields (23). Dronpa was also shown to be an effective probe for OLID imaging. A single cycle of optical switching between the trans and cis states of Dronpa involved the following optical perturbations: two sequential scans of the field using 800 nm (2-photon, at an intensity of ≈45 mW at the sample) or a ≈100-ms pulse of 365-nm light were both effective in triggering the trans-to-cis transition, followed by 5–10 sequential scans of the field at 488 nm using a laser power at the sample of ≈70 μW to convert the fluorescent cis back to trans-Dronpa and to image Dronpa distribution. As shown below, optical switching between the two states of Dronpa could also be repeated over many cycles (as shown in Figs. 3 and 5 C and D).
Fig. 3.

Optical switching of Dronpa. (A) Intensity image of Dronpa-beads (green arrows) mixed with a cluster of 40-nm fluoresbrite beads (white arrows). (B) Correlation image of same image field as in A shows the Dronpa-beads but not the 40-nm fluoresbrite beads. (C) Fluorescence-intensity profiles for optical switching of a single 0.35-μm Dronpa-latex bead [red trace from bead marked with the short green arrow (A)] and the uncorrelated and much more constant intensity from the fluoresbrite bead cluster (black trace from bead marked with the short white arrow in A). Optical cycling was achieved by using a single 100-ms pulse of 365-nm light to convert nonfluorescent trans-Dronpa to the fluorescent cis-Dronpa and 488-nm excitation to evoke fluorescence and the reverse isomerization. The fluoresence-intensity axis applies to both profiles. (D) Image of Dronpa-actin in a living NIH 3T3 cell (green arrow) compared with Dronpa-coupled 1-μm latex beads (white arrow). Beads were used to generate an external reference waveform of optical switching. Transition to the fluorescent cis state is triggered by excitation of the trans state at 365 nm for 100 ms. Subsequent excitation of cis-Dronpa at 488 nm is used to bring about the cis-to-trans photoisomerization. (E) Normalized fluorescence-intensity profiles of cis-Dronpa in a stress fiber in the NIH 3T3 cell (green arrow in D; red trace, with data shown as blue dots) and a Dronpa-bead located next to the cell (white arrow in Fig. D; green trace, with data shown as black dots) over the course of 5 cycles of optical switching. Note that the internal reference waveform generated from Dronpa-actin in the live cell is almost identical to that of the external reference waveform derived from Dronpa on the bead. (F and G) Fluorescence-intensity (F) and correlation (G) images of Dronpa-actin in NIH 3T3 cell (Intensity scale is 0–255, and the correlation coefficient is 0–1). The intensity image was taken immediately after a 200-ms 365-nm pulse. GFP-coupled latex beads (0.35 μm) were added to the external medium to add a milky background signal with bright spots, presumably representing bead aggregates (white arrow). The green arrow indicates the location of a focal contact, containing a high concentration of Dronpa-actin, that was used to generate an internal reference waveform.
Fig. 5.

OLID-imaging of Dronpa in live zebrafish. (A–C) OLID imaging of Dronpa-actin in muscle of live zebrafish larva. (A and B) Fluorescence-intensity image (A) and correlation-coefficient image (B) of Dronpa-actin in larval muscle at 5 dpf. Note that details of sarcomeric organization are sharper in the correlation coefficient image. The green arrow indicates the region that has considerable background fluorescence but little to no correlation, suggesting an absence of Dronpa-actin. (C) Saw-tooth modulation of the normalized fluorescence intensity by optical switching between trans- and cis-Dronpa-actin in zebrafish muscle of A. (D and E) OLID imaging of cytoplasmic Dronpa in neurons of live zebrafish larva. Fluorescence-intensity image (D) and correlation image (E) and modulation of the normalized fluorescence intensity by optical switching (D Inset) of cytoplasmic Dronpa in spinal cord interneurons in larva at 5 dpf. Profiles of the intensity and correlation coefficient for these data along a narrow box defined by the yellow arrows are shown in Fig. S4
Correlation Analysis.
To selectively amplify signals from the optical switch probes, a cross-correlation analysis was performed between every pixel in an image field and a reference waveform of the course of optical switching over several cycles [supporting information (SI) Fig. S1]. The reference waveform could be obtained internally, by recording the fluorescence of the optical switch in a small region (e.g., 5 × 5 pixels) that exhibited little background and displayed a large intensity modulation when imaged over multiple cycles of optical switching (Fig. 1E). Alternatively, an external reference waveform could be obtained by recording the fluorescence from optical switch probes covalently attached to immobilized micron-sized latex beads added to the sample, as shown below. The reference waveform for nitroBIPS showed highly reproducible profiles from one optical switching cycle to the next (Fig. 1E). The correlation coefficient ρ(x, y) for any pixel location (x, y) is calculated as follows:
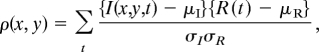 |
where, I(x, y, t)is the detected fluorescence intensity at pixel (x, y) at a time t during the switching cycle; and R(t)is the reference waveform. μI and μR are the mean values, and σI and σR are the standard deviation (std) values of the pixel fluorescence intensity and the reference waveform, respectively. The correlation coefficient has an absolute value varying from unity to zero (the few negative values indicate no or anti-correlation and are set to zero). The correlation values >0 are displayed on a pixel-by-pixel basis in an intensity-independent correlation image, which is unique to probes that undergo reversible excited-state transitions between fluorescent and nonfluorescent states. Because conventional fluorophores such as GFP and autofluorescence do not exhibit optical switching, their emission is not correlated with the reference waveform.
High-Contrast Fluorescence Imaging of NitroBIPS Probes in Living Neurons.
Having seen that patterns of excitation pulses can be used to drive the nitroBIPS optical switch between its fluorescent and nonfluorescent states in cultured cells (Fig. 1 C–E), we next asked whether the approach would work in intact tissue. We tested this in live Xenopus spinal cord explants (24, 25). Steady-state, red fluorescence images from the Xenopus spinal cord explant loaded with the membrane probe C11-nitroBIPS revealed a complex staining pattern with contributions from both MC and from a high-intensity yolk autofluorescence (Fig. 2B). A correlation analyses was performed by using as an internal reference waveform a region of nitroBIPS staining (Fig. 2A) that exhibited a large modulation over consecutive cycles of optical switching. The intensity image was dominated by a large number of particles that obscured the fine detail of the axons and cell-body protrusions. These were absent from the correlation image (Fig. 2C) and so, likely represented autofluorescent yolk particles. The C11-nitroBIPS probe was preferentially distributed within the membranes of both neurons and glia, with high values of the correlation coefficient found within the flat growth cone and filopodia (Fig. 2C). The correlation coefficient image of the growth cone and filopodia had a high signal even though the fluorescence intensity within these structures was low (Fig. 2B). The effectiveness of OLID in discriminating between the “DC” (steady-state intensity) and “AC” (modulated fluorescence) components of the fluorescence signal was further illustrated in an overlay of their spatial profiles (Fig. 2D, black and red traces, respectively). Analysis of the signal along the yellow box shown in the intensity and correlation images of the growth cone revealed a signal-to-background ratio of ≈2 (52/25) in the intensity image (Fig. 2B), which increased to >13 (205/15) in the correlation image (Fig. 2C).
Fig. 2.

OLID for imaging live Xenopus spinal cord explants using nitroBIPS probes. (A) Internal reference waveform for the optical switching of C11-nitroBIPS in cells within a Xenopus spinal cord explants measured by using MC-fluorescence. The normalized waveform was obtained from a selected region of 5 × 5 pixels with strongest MC-fluorescence corresponding to 5 cycles of optical switching of the probe and was used in the pixel-by-pixel calculation of the correlation coefficient. (B) Fluorescence-intensity image of the C11-nitroBIPS stained cells within the Xenopus spinal cord explant. (C) Correlation image corresponding to B, which used A as a reference waveform. (D) Traces of the relative fluorescence intensity (black) and the correlation (red) of C11-nitroBIPS for the yellow boxed region in B and C, respectively.
High-Contrast Imaging of Dronpa-Actin in NIH 3T3 Cells.
Dronpa was also shown to be an effective probe for OLID imaging in this study. A single cycle of optical switching between the trans and cis states of Dronpa involved the following optical perturbations: two sequential scans of the field using 800-nm (2-photon, ≈45 mW at sample), or a ≈100-ms pulse of 365-nm light, were both effective in triggering the trans-to-cis transition, followed by 5–10 sequential scans of the field at 488 nm using a laser power at the sample of ≈70 μW to convert the cis- to trans-Dronpa. Optical switching between the two states of Dronpa was demonstrated by using these illumination conditions in the series of photoswitch cycles from a mixture of Dronpa-coupled and Fluoresbrite latex beads (Fig. 3A; green and white arrows respectively). The transitions between the two states of Dronpa could be repeated over multiple cycles, with ≈15% total loss of fluorescence (Fig. 3C, red, showing the intensity profile of Dronpa beads marked with short green arrow in Fig. 3A), likely because of cumulative occupancy of nonswitchable dark states (23). In contrast, the fluorescence intensity of the Fluorescbrite-bead (Fig. 3A, short white arrow, with intensity profile shown in black in Fig. 3C) was relatively stable with small fluctuations that were unrelated to the sequence of near-UV and 488-nm scans of the field. The mean correlation coefficient for the Dronpa beads (Fig. 3B) was 0.89. Because the intensity profile for the fluoresbrite beads (Fig. 3C, black) did not correlate with the reference waveform, i.e., the correlation coefficient was close to zero, these beads are not evident in the correlation image. Similar improvements in image contrast were obtained by using OLID for a mixture of Dronpa-beads and GFP-beads and by using 2-photon excitation of trans-Dronpa as shown in SI Text (Fig. S2).
Having found that we could selectively enhance detection of Dronpa on beads, we next turned to testing it in live cells. We expressed a fusion of Dronpa to actin in NIH 3T3 cells and compared its fluorescent signal to Dronpa-beads. Fluorescence-intensity images of the cells and of beads surrounding them showed the localization of Dronpa-actin to the cytoskeleton, with strong signals from stress fibers (Fig. 3D). Optical switching yielded almost identical fluorescence-intensity waveforms for Dronpa-actin in the cytoskeleton and Dronpa on the latex beads (Fig. 3E, compare black dots from Dronpa beads with blue dots for Dronpa-actin; fluorescence taken from regions indicated in Fig. 3D: with cytoskeleton marked by green arrow and bead with white arrow). This waveform provides a measure of the cumulative effects of the quantum efficiencies of optical switching, fluorescence, photobleaching, and fatigue in Dronpa over multiple cycles of optical switching. Because the profiles for the intracellular and extracellular derived waveforms are superimposed, we conclude that these quantum efficiencies are independent of environment. We note, however, that dissimilar profiles might occur for probes found in lower-pH environments (e.g., endosomes), although this is clearly not the case in the system under study.
Because Dronpa-actin made up the majority of the fluorescence signal in the cell shown in Fig. 3D, we examined similarly labeled cells to which GFP-latex beads (0.35 μm) were added to the medium to artificially increase the background signal (Fig. 3F). A pixel region showing the highest depth of cis-Dronpa fluorescence-intensity modulation (green arrow in the stress fiber of the cell in Fig. 3F) was used to generate the internal reference waveform (data not shown). The signal-to-background ratio for the correlation image (Fig. 3G; scale is 0–1) was higher for specific structures compared with the intensity image (Fig. 3F; scale is 0–255) because of the almost complete absence of GFP background. In some regions, the contrast enhancement increased the signal to background ratio from 5:1 in the intensity image to as high as 100:1 in the correlation image (green versus white arrows in Fig. 3 F and G). Attempts to adjust the brightness and/or contrast for the intensity image shown in Fig. 3F to achieve the same quality contrast as that obtained in the correlation image were unsuccessful. This was also the case for all other images using nitroBIPS or Dronpa presented in this study.
OLID Imaging of Dronpa in Neurons and Muscle, in Vitro and in Vivo.
A major need for optical microscopy is to develop methods that improve imaging in tissues and in vivo, where background fluorescence can be high and where it is important to generate high-content images quickly under modest levels of irradiation. To assess OLID for such applications, we set out to use Dronpa to image neurons and muscle in intact spinal cord and in live animals. First, we imaged cultured postnatal rat hippocampal neurons and found that the Dronpa-actin probe could be modulated between its nonfluorescent and fluorescent forms very effectively within the tissue (Fig. 4A Inset). The correlation image of Dronpa-actin derived from these data (Fig. 4B; correlation coefficient values 0–0.7) substantially enhanced signals from dendritic shafts, increased the visibility of fine dendrites, and drastically improved the visualization of dendritic spines, which were buried in the background in the intensity image (Fig. 4A; scale 0–160 of an 8-bit range). The improvement to image contrast for these structures can also be seen in profiles of the intensity and correlation coefficient along a line defined by the yellow arrows in Fig. 4 A and B shown in Fig. S3.
Fig. 4.

OLID-imaging of Dronpa in cultured mammalian neurons and Xenopus spinal cord explant. (A) Fluorescence-intensity image of Dronpa-actin transiently expressed in rat P1 hippocampal neurons, transfected at 8 days in vitro (DIV) and imaged in live cells at 11 DIV. The Inset shows normalized fluorescence intensity of the internal reference over 3 cycles of optical switching. (B) Correlation image of Dronpa-actin of same field as in A improves contrast and reveals finer processes and dendritic spines. Profiles of the fluorescence intensity and correlation coefficient along a line defined by the yellow arrows (A and B, respectively) are shown in Fig. S3. (C) Image of the fluorescence intensity of cis-Dronpa-actin within the growth cone of a motor neuron in a live, deskinned Xenopus embryo. The Inset shows the internal reference waveform derived from optical switching of Dronpa-actin in the cell body. (D) Correlation image of Dronpa-actin for image field shown in C. The improvement in contrast in the correlation image is largely from the suppression of background of the muscle cells that is evident in the intensity image. (For details see SI Text).
We next used OLID imaging to map the distribution of Dronpa-actin within the highly autofluorescent tissue of Xenopus embryos. Several cell types were found to express Dronpa-actin in the live Xenopus embryo ≈24 h after DNA injection and fertilization. We focused our attention on motor neuron growth cones. The fluorescence of cis-Dronpa-actin was bright at the center of the growth cone and lower at the edge and in the axon, where the brightness was similar to that of autofluorescence in surrounding muscle cells (Fig. 4C). OLID correlation over only 2 cycles of optical switching of Dronpa-actin provided a high-contrast image of Dronpa-actin within the axon, edge of the growth cone, and emerging filopodia and effectively suppressed the high-autofluorescence signal from the muscle cells (Fig. 4D).
Having seen significant contrast enhancement in cultured neurons and intact embryos, we proceeded to OLID imaging of Dronpa in live zebrafish. UAS-Dronpa-actin injected into the single-cell stage of the st1020 GAL4 line (26) expressed strongly in muscle at 5 days after fertilization (dpf) and could be readily detected in an intensity image (Fig. 5A) of tricaine-paralyzed fish embedded in low-melting-point agarose. Optical modulation of Dronpa-actin fluorescence was readily achieved in the larva, as seen in the intensity trace during optical switching in Fig. 5C. The correlation image of the muscle enhanced structural details of sarcomeric organization and the paths of individual myofibrils (Fig. 5B) that were difficult to discern from the intensity image and effectively removed background from the outer regions of the sample indicated by a green arrow in Fig. 5 A and B. OLID also enhanced the imaging of zebrafish neurons. UAS-Dronpa injected into the single-cell stage of the st1011 GAL4 line (26) expressed strongly in larval spinal cord interneurons at 5 dpf. Optical switching was reversible and highly reproducible over 10 cycles of 2-photon photoisomerization to the fluorescent cis-Dronpa state, followed by 1-photon imaging and return isomerization (Upper Inset, Fig. 5D, cell body marked by a white arrow). The correlation image augmented the signal from fine processes of these neurons and for specific regions along a line indicated by the yellow arrows in Fig. 5 D and E increased the signal to background ratio from 6.8 for the intensity image to 35.4 for the same pixels in the correlation image (profile shown in Fig. S4).
Discussion
OLID microscopy provides a powerful tool for contrast-enhanced imaging, allowing specific resolution of the fluorescence signals from synthetic or genetically encoded optical switches such as nitroBIPS and Dronpa within a variety of live-cell systems, in culture and within living embryos, that usually contain substantial background signals. The approach relies on the specific property of the optical switches whereby their fluorescence emission is modulated as they are driven back and forth, with two distinct wavelengths of light, between nonfluorescent and fluorescent states. This produces a stimulus-coupled change that is distinct from the native sources of cellular fluorescence, such as protein-bound NAD(P)H and FADH2, and from the vast majority of extrinsic fluorophores and fluorescent proteins, enabling the desired cell structure to which the optical switch is targeted, or the protein to which it is attached, to be visualized above the autofluorescent background and amplified above the level of other indicators and trackers. The simple way that the signal from optical switches is enhanced is by generating a correlation image, i.e., to display the correlation coefficient of fluorescence with respect to an internal reference of a bead or cell structure that is enriched for the optical switch. This makes it possible to visualize a small modulated or AC signal from an optical switch over the other sources of fluorescence by selectively enhancing the modulated pixels and excluding the unmodulated ones. This method of isolating the specific signal from the optical switch in an image is similar in several aspects to radar, and to lock-in and phase-sensitive detection techniques that are widely used in the physical, chemical, and life sciences.
The usefulness of Dronpa as an optical switch is somewhat limited by its high fluorescence quantum yield and tendency to transition into a nonswitchable state (23) that leads, in some cases, to loss of switchable Dronpa over the course of an optical switching study. Despite this complication, our analyses of Dronpa probes showed that the intensity profile within each cycle is constant even after 12 cycles of switching and loss of >50% of the original cis-Dronpa signal (Fig. S2). At this point in an experiment, an even in cases where only a modest modulation of the fluorescence signal is achieved (Fig. S2), the waveforms still generate correlation images that exhibit a high degree of contrast. The ability to genetically encode fusions of an optical switch probe with any protein in a living cell adds such a great measure of convenience and specificity that Dronpa is most likely to have the broadest immediate impact for cellular imaging. This will motivate a search for dark-state and fatigue-resistant, fast-switching, multicolored, and infrared-emitting Dronpa variants that might include the recently described Dronpa-2 and Dronpa-3 (19).
The contrast-enhancing power of OLID imaging extends to imaging Dronpa-actin and cytoplasmic Dronpa in rat hippocampal neurons, neurons in live Xenopus embryos, and in muscle cells and neurons in live zebrafish larvae by using 2-photon illumination to generate the fluorescent states and 1-photon illumination to image and restore the nonfluorescent state. Together, the properties of OLID imaging microscopy using nitroBIPS and Dronpa-related switches will allow for rapid, deep-tissue imaging of specific probes and markers proteins within living animals with superior image contrast compared with existing probes and imaging modalities.
Materials and Methods
Synthesis of C11-nitroBIPS.
C11-nitroBIPS (Fig. 1A) was prepared according to the methods described in Sakata et al. (18) and is detailed in SI Text.
Cell Culture and Transfection.
Standard cell-culture methods were used for mammalian and Xenopus preparations as detailed in SI Text.
Plasmid Construction and Protein Purification.
Standard molecular biology and protein purification methods were used for the expression of genes in cells and for preparation of Dronpa and GFP as detailed in SI Text.
Labeling of Intracellular Proteins with 8-Iodomethyl-NitroBIPS.
Standard probe-labeling techniques were used for studies detailed in this study as described in SI Text.
Imaging System and Optical Manipulation of MC-and cis-Dronpa Fluorescence in Cells.
Three different microscope systems were used to image and manipulate optical switch-labeled cells. Details of these systems are provided in SI Text.
Cultured Neurons.
Dissociated hippocampal cultures were prepared from P1 rats and transfected and imaged as described in SI Text.
Dronpa Imaging in Zebrafish.
Single-cell s1011t:GAL4 and s1020t:GAL4 embryos (26) were injected with plasmid DNA for UAS:Dronpa or UAS:Dronpa-actin at 20 ng/μl along with 50 ng/μl transposase mRNA and 0.04% phenol red. Zebrafish were raised at 28.5 °C in E3 medium and imaged at 5 dpf, as described in SI Text.
Supplementary Material
Acknowledgments.
We thank A. Miyawaki (RIKEN, Saitama, Japan) for sharing the Dronpa clone and E. Scott, L. Mason, F. Del Bene, and H. Baier (University of California, San Francisco) for the GAL4 zebrafish lines. This work was supported by National Institutes of Health (NIH) Grants R01EB005217 (to G.M.) and R01NS050833 (to E.Y.I.), Defense Advanced Research Projects Agency (DARPA)-SPARTAN Grant 19182-S2 and Human Frontier Science Program Organization Grant RGP0045 (to G.M.), and NIH Nanomedicine Development Center for the Optical Control of Biological Function Grant 5PN2EY018241 (to E.Y.I.).
Footnotes
Conflict of interest statement: Related probes to those detailed in this article have been patented by G.M. through the Wisconsin Alumni Research Foundation (WARF).
This article contains supporting information online at www.pnas.org/cgi/content/full/0808882105/DCSupplemental.
References
- 1.Yan Y, Marriott G. Analysis of protein interactions using fluorescence technologies. Curr Opin Chem Biol. 2003;7:635–640. doi: 10.1016/j.cbpa.2003.08.017. [DOI] [PubMed] [Google Scholar]
- 2.Zhang J, Campbell R, Ting A, Tsien R. Creating new fluorescent probes for cell biology. Nat Rev Mol Cell Biol. 2002;3:906–918. doi: 10.1038/nrm976. [DOI] [PubMed] [Google Scholar]
- 3.Westphal M, et al. Microfilament dynamics in motility and cytokinesis imaged with GFP-actin. Curr Biol. 1997;7:176. doi: 10.1016/s0960-9822(97)70088-5. [DOI] [PubMed] [Google Scholar]
- 4.Axelrod D. Total internal reflection fluorescence microscopy in cell biology. Methods Enzymol. 2003;361:1–33. doi: 10.1016/s0076-6879(03)61003-7. [DOI] [PubMed] [Google Scholar]
- 5.Koyama-Honda I, et al. Fluorescence imaging for monitoring the colocalization of two single molecules in living cells. Biophys J. 2005;88:2126–2136. doi: 10.1529/biophysj.104.048967. [DOI] [PMC free article] [PubMed] [Google Scholar]
- 6.Hell SW, Dyba M, Jakobs S. Concepts for nanoscale resolution in fluorescence microscopy. Curr Opin Neurobiol. 2004;14:599–609. doi: 10.1016/j.conb.2004.08.015. [DOI] [PubMed] [Google Scholar]
- 7.Betzig E, et al. Imaging intracellular fluorescent proteins at nanometer resolution. Science. 2006;313:1642–1645. doi: 10.1126/science.1127344. [DOI] [PubMed] [Google Scholar]
- 8.Rust MJ, Bates M, Zhuang X. Sub-diffraction-limit imaging by stochastic reconstruction optical microscopy (STORM) Nat Methods. 2006;3:793–795. doi: 10.1038/nmeth929. [DOI] [PMC free article] [PubMed] [Google Scholar]
- 9.Bates M, Huang B, Dempsey GT, Zhuang X. Multicolor super-resolution imaging with photo-switchable fluorescent probes. Science. 2007;317:1749–1753. doi: 10.1126/science.1146598. [DOI] [PMC free article] [PubMed] [Google Scholar]
- 10.Hofmann M, Eggeling C, Jakobs S, Hell S. Breaking the diffraction barrier in fluorescence microscopy at low light intensities by using reversibly photoswitchable proteins. Proc Natl Acad Sci USA. 2005;102:565–569. doi: 10.1073/pnas.0506010102. [DOI] [PMC free article] [PubMed] [Google Scholar]
- 11.Hess ST, Girirajan TP, Mason MD. Ultra-high resolution imaging by fluorescence photoactivation localization microscopy. Biophys J. 2006;91:4258–4272. doi: 10.1529/biophysj.106.091116. [DOI] [PMC free article] [PubMed] [Google Scholar]
- 12.Aubin J, Histochem J. Autofluorescence of viable cultured mammalian cells. J Histochem Cytochem. 1979;27:36–43. doi: 10.1177/27.1.220325. [DOI] [PubMed] [Google Scholar]
- 13.So PTC, Kim H, Kochevar IE. Two-photon deep tissue ex vivo imaging of mouse dermal and subcutaneous structures. Opt Express. 1998;3:339–350. doi: 10.1364/oe.3.000339. [DOI] [PubMed] [Google Scholar]
- 14.Eigen M, Maeyer LD, Weissberger A. Technique of Organic Chemistry. Vol 8. New York: Interscience; 1963. p. 895. [Google Scholar]
- 15.MacGregor R, Clegg RM, Jovin TM. Pressure-jump study of the kinetics of ethidium bromide binding to DNA. Biochemistry. 1985;24:5503–5510. doi: 10.1021/bi00341a034. [DOI] [PubMed] [Google Scholar]
- 16.Mannuzzu L, Moronne M, Isacoff E. Direct physical measure of conformational rearrangement underlying potassium channel gating. Science. 1996;271:213–216. doi: 10.1126/science.271.5246.213. [DOI] [PubMed] [Google Scholar]
- 17.Sakata T, Yan Y, Marriott G. Optical switching of dipolar interactions on proteins. Proc Natl Acad Sci USA. 2005;102:4759–4764. doi: 10.1073/pnas.0405265102. [DOI] [PMC free article] [PubMed] [Google Scholar]
- 18.Sakata T, Yan Y, Marriott G. Family of site-selective molecular optical switches. J Org Chem. 2005;70:2009–2013. doi: 10.1021/jo048207o. [DOI] [PMC free article] [PubMed] [Google Scholar]
- 19.Ando R, Flors C, Mizuno H, Hofkens J, Miyawaki A. Highlighted generation of fluorescence signals using simultaneous two-color irradiation on Dronpa mutants. Biophys J. 2007;92:97–99. doi: 10.1529/biophysj.107.105882. [DOI] [PMC free article] [PubMed] [Google Scholar]
- 20.Bletz M, Pfeifer-Fukumura U, Kolb U, Baumann W. Ground- and first-excited-singlet-state electric dipole moments of some photochromic spirobenzopyrans in their spiropyran and merocyanine form. J Phys Chem A. 2002;106:2232–2236. [Google Scholar]
- 21.Görner H, Matter S. Photochromism of nitrospiropyrans: Effects of structure, solvent and temperature. Phys Chem Chem Phys. 2001;3:416–423. [Google Scholar]
- 22.Giordano L, Jovin T, Irie M, Jares-Erijman E. Diheteroarylethenes as thermally stable photoswitchable acceptors in photochromic fluorescence resonance energy transfer (pcFRET) J Am Chem Soc. 2002;124:7481–7489. doi: 10.1021/ja016969k. [DOI] [PubMed] [Google Scholar]
- 23.Dedecker P, et al. Fast and reversible photoswitching of the fluorescent protein dronpa as evidenced by fluorescence correlation spectroscopy. Biophys J. 2006;91:L45–7. doi: 10.1529/biophysj.106.089789. [DOI] [PMC free article] [PubMed] [Google Scholar]
- 24.Gomez T, Harrigan D, Henely J, Robles E. Working with Xenopus spinal neurons in live cell culture. Methods Cell Biol. 2003;71:130–154. doi: 10.1016/s0091-679x(03)01008-2. [DOI] [PubMed] [Google Scholar]
- 25.Gomez T, Robles E. Imaging calcium dynamics in developing neurons. Methods Enzymol. 2003;361:407–422. doi: 10.1016/s0076-6879(03)61021-9. [DOI] [PubMed] [Google Scholar]
- 26.Scott EK, et al. Targeting neural circuitry in zebrafish using GAL4 enhancer trapping. Nat Methods. 2007;4:323–326. doi: 10.1038/nmeth1033. [DOI] [PubMed] [Google Scholar]
Associated Data
This section collects any data citations, data availability statements, or supplementary materials included in this article.