

Abstract
Studies of cultured cells have indicated that the mammalian target of rapamycin complex 1 (mTORC1) mediates the development of insulin resistance. Because a role for mTORC1 in the development of skeletal muscle insulin resistance has not been established, we studied mTORC1 activity in skeletal muscles of ob/ob (OB) mice and wild-type (WT) mice. In vivo insulin action was assessed in muscles of mice 15 min following an intraperitoneal injection of insulin or an equivalent volume of saline. In the basal state, the phosphorylation of S6K on Thr389, mTOR on Ser2448, and PRAS40 on Thr246 were increased significantly in muscles from OB mice compared with WT mice. The increase in basal mTORC1 signaling was associated with an increase in basal PKB phosphorylation on Thr308 and Ser473. In the insulin-stimulated state, no differences existed in the phosphorylation of S6K on Thr389, but PKB phosphorylation on Thr308 and Ser473 was significantly reduced in muscles of OB compared with WT mice. Despite elevated mTORC1 activity in OB mice, rapamycin treatment did not improve either glucose tolerance or insulin tolerance. These results indicate that the insulin resistance of OB mice is mediated, in part, by factors other than mTORC1.
Keywords: insulin resistance, signal transduction, skeletal muscle
type 2 diabetes mellitus is a major public health problem affecting ∼18 million Americans and resulting in annual total health care costs of approximately $120 million (18). Common to all type 2 diabetes patients is insulin resistance, a pathophysiology that precedes the onset of type 2 diabetes and is due to a reduction of insulin action in insulin-sensitive tissues. Because skeletal muscle is the primary site for postprandial glucose disposal, it is thought that this important metabolic tissue plays a major role in the development of insulin resistance and type 2 diabetes. Despite the important role skeletal muscle plays in glucose homeostasis, our knowledge of insulin signal transduction in skeletal muscle has not advanced as rapidly as with culture cells.
Several studies using cultured cells have shown that the activation of the mammalian target of rapamycin (mTOR) signaling pathway contributes to the development of insulin resistance (3, 29, 33–35). mTOR is an insulin-responsive and amino acid-sensitive Ser/Thr kinase whose activity is essential for cellular growth (4, 38). mTOR has been shown to contribute to insulin resistance through a negative feedback mechanism by promoting the Ser phosphorylation and subsequent degradation of insulin receptor substrate-1 (IRS-1) (5, 29, 35, 39). Evidence indicating that mTOR mediates the development of insulin resistance is strengthened by the ability of rapamycin to prevent Ser phosphorylation of IRS-1 (3, 29, 35, 39), as well as enhance PKB activity (33). Whether or not the activation of mTOR produces the insulin resistance associated with obesity in intact animals and humans has not been established. Furthermore, it is not known whether inhibiting mTOR activity with rapamycin, a highly specific inhibitor of mTOR, can improve insulin sensitivity.
Our knowledge of mTOR signaling has been greatly enhanced in the past few years by the discovery of numerous mTOR binding proteins. It is now well established that mTOR exists in at least two complexes, mTOR complex 1 (mTORC1) and mTORC2. mTORC1 contains raptor, and its activity is inhibited by rapamycin (15), whereas mTORC2 is rapamycin insensitive and contains rictor, the kinase responsible for phosphorylating PKB on Ser473 (26). mTORC1 also contains PRAS40 (2, 16), a novel target of PKB whose phosphorylation enhances mTORC1 activity (25, 37). In the basal state, PRAS40 binds tightly to mTORC1, repressing its kinase activity. Upon stimulation with insulin or growth factors, PRAS40 is phosphorylated by PKB and released from mTORC1, a process that enhances mTORC1 activity (25, 37). PKB can also enhance mTOR activity by promoting the phosphorylation of tuberous sclerosis complex 1 and 2 (TSC1/2). Phosphorylation of TSC1/2 enhances the GTP loading of Rheb (ras homolog enriched in brain), a process that appears to be necessary for increasing the kinase activity of mTORC1 (38). Because mTORC1 has been implicated in the development of insulin resistance and PKB regulates mTORC1 activity, it is possible that basal PKB activity is increased with insulin resistance.
The purpose of the present study was to determine whether elevated basal PKB/mTORC1 signaling is associated with skeletal muscle insulin resistance and whether or not rapamycin treatment can reverse in vivo insulin resistance. Although numerous cell culture studies have shown that activating mTORC1 impairs insulin signaling, the evidence implicating a role of mTORC1 in whole body insulin resistance is limited. Our hypothesis is that basal PKB/mTORC1 signaling will be elevated in muscles of ob/ob (OB) mice, an established model for obesity-related insulin resistance. We also hypothesize treating OB mice with rapamycin will improve in vivo insulin action.
METHODS
Ethical information.
All animal care and surgery were in accordance with the National Institutes of Health's Guide for Care and Use of Laboratory Animals [DHEW (NIH) Publication No. 85-23]. All experimental protocols were approved by the University Committee for the Use and Care of Animals.
Surgical procedures for OB and wild-type mice.
Male OB mice (n = 16) and age-matched male wild-type (WT) mice (n = 24) (Jackson Laboratories, Bar Harbor, ME) were caged individually, maintained on a 12:12-h light-dark cycle, and fed normal chow and water ad libitum. To harvest skeletal muscle, mice were anesthetized with a 1:1:1 mixture of promace, ketamine hydrochloride, and xyalzine by an intraperitoneal injection (0.015 ml/10 g body wt). Ten minutes before administration of the anesthetics, mice were injected with either insulin (0.25 U/kg body wt) or an equivalent volume of saline (0.9% NaCl). At 15 min following insulin or saline injections, quadriceps muscles were rapidly dissected, frozen in liquid nitrogen, and stored at −80°C until analysis.
Preparation of muscle extracts.
The frozen quadriceps muscles from all mice were manually ground with a porcelain mortar and pestle chilled in liquid N2. Powdered muscles were homogenized on ice using a motor-driven tissue grinder (Teflon-glass) in Cell Extraction Buffer (Biosource) (10 ml:1 g, buffer volume: muscle weight ratio) containing 0.1 mM dithiothreitol, 500 nM microcystin-LR, 0.1 mM phenylmethylsulfonyl fluoride, and 10 μg/ml each of aprotinin, leupeptin, and pepstatin-A. The homogenates were rotated at 4°C for 1 h and then centrifuged at 9,000 g for 30 min at 4°C. The protein concentrations of the supernatants were determined by the BCA method (Pierce, Rockford, IL). The remaining skeletal muscle extract was utilized for electrophoretic analysis and immunoblotting experiments.
Electrophoretic analyses and immunoblotting.
Skeletal muscle extracts and molecular weight standards (Bio-Rad, Hercules, CA) were subjected to SDS-PAGE. The proteins were then electrophoretically transferred to Immobilon membranes and immunoblotted with phospho-specific antibodies to S6K, mTOR, PKB, and PRAS40. The pThr389 S6K antibody recognizes S6K when phosphorylated on Thr389, a site that is phosphorylated by mTOR (23) and, therefore, an ideal measure of mTORC1 kinase activity (7). The pSer2448 mTOR antibody recognizes mTOR only when phosphorylated at Ser2448, a site whose phosphorylation is associated with increased mTORC1 kinase activity (19, 27, 28). The pSer473 PKB and pThr308 PKB antibodies recognize PKB when phosphorylated on Ser473 and Thr308, respectively, two sites whose phosphorylation is necessary for full PKB activity (1). And the pThr246 PRAS40 antibody recognizes PRAS40 when phosphorylated at Thr246. Phosphorylation of PRAS40 leads to increased mTORC1 kinase activity (25, 37). To account for changes in the total amounts of the signaling proteins, the phospho-specific immunoblots were stripped and reprobed with antibodies that recognize total S6K, mTOR, PKB-β, and PRAS40, respectively. After washing the membranes, we detected the light generated by the alkaline-phosphatase-conjugated secondary antibody and the CDP-Star reagent (Western Lightning; Perkin Elmer, Waltham, MA) using X-ray film (Kodak XAR-5). Relative signal intensities of the bands for pThr389 S6K, pSer2448 mTOR, pSer473 PKB, pThr308 PKB, and pThr246 PRAS40 were determined by using a digital densitometer (Fotodyne, Hartland, WI). All antibodies were from Cell Signaling Technology (Beverly, MA) unless noted otherwise.
Glucose and insulin tolerance testing.
To assess the role of mTORC1 on in vivo insulin sensitivity, all mice were subjected to two glucose tolerance (GT) and insulin tolerance (IT) tests. Two hours prior to each test, mice received an intraperitoneal injection of rapamycin (0.005 mg/g body wt) or an equivalent volume of sterile 0.9% saline. GT was assessed by injecting mice with glucose (1 mg/g body wt) and measuring glucose from blood collected via the tail vein at 0, 15, 30, 45, 60, and 90 min following the glucose injection. IT was assessed by injecting mice with insulin (0.25 U/kg body wt) and measuring glucose from blood collected via the tail vein at 0, 15, 30, 45, and 60 min following the glucose injection. The area under the curve (AUC) for GT and IT was calculated to assess the correlation between mTORC1 activity with GT and IT, respectively.
Statistical analysis.
All data were analyzed using ANOVA. To detect statistical significance for basal and insulin-stimulated mTORC1 signaling, a 2 × 2 ANOVA (genotype × insulin) was used. To detect statistical differences for the effect of rapamycin on GT and IT, a 2 × 2 ANOVA (genotype × rapamycin) with repeated measures for time of glucose measure (0, 15, 30, 45, 60, or 90 min) was used. Following a significant F ratio, a priori mean comparisons were conducted using Fisher's least significant difference post hoc test. To detect statistical significance for AUC for GT and IT, one-way ANOVA was used. Data are expressed as means ± SE, and the level of statistical significance was set at P ≤ 0.05.
RESULTS
Phosphorylation of S6K on Thr389.
Phosphorylation on Thr389 of S6K is mediated by mTORC1 and serves as an ideal measure of mTORC1 (7, 23). Therefore, we have used the phosphorylation of S6K on Thr389 as a surrogate measure of mTORC1 kinase activity by using the phospho-specific antibody, pThr389 S6K. Fig. 1A shows a representative immunblot prepared with the pThr389 S6K phospho-specific antibody. As shown in Fig. 1B, basal phosphorylation of S6K on Thr389 is increased significantly in quadriceps muscle extracts prepared from OB mice compared with WT mice. Following insulin stimulation, pThr389 S6K immunoreactivty was significantly higher compared with the basal state; however, no significant differences were detected for pThr389 S6K immunoreactivity in muscle extracts of OB compared with WT mice (Fig. 1B). As shown in Fig. 1A, an immunoblot prepared with an antibody that recognizes all S6K regardless of phosphorylation demonstrates that changes in pThr389 S6K immunoreactivity are not due to differences in expression of the kinase, as total S6K immunoreactivity is not significantly different in the basal or insulin-stimulated state in muscle extracts prepared from OB compared with WT mice. These results provide evidence that basal mTORC1 activity is increased in skeletal muscles of OB mice.
Fig. 1.
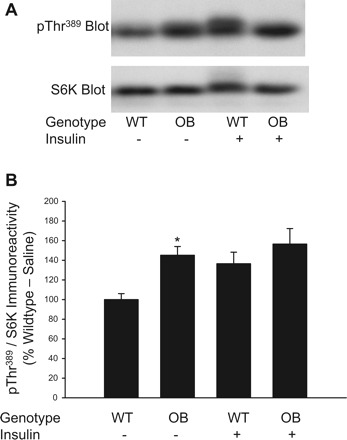
Phosphorylation of S6K on Thr389 in muscles from ob/ob mice. Quadriceps muscles from ob/ob (OB) and wild-type (WT) mice were rapidly frozen in liquid nitrogen 15 min after an injection of saline or insulin (0.25 U/kg). Muscle extracts were prepared and mTORC1 activity was assessed by immunoblotting with the pThr389 S6K antibody and a total S6K antibody (A). The pThr389 S6K and total S6K immunoreactive bands were quantified, and data were normalized to total amounts of S6K (B). 2 × 2 ANOVA revealed a significant main effect for genotype (P ≤ 0.05) and insulin (P ≤ 0.05). *Significantly different from WT-saline condition by Fisher's LSD post hoc analysis, P ≤ 0.05. The number of muscles per group is 8–20.
Phosphorylation of mTOR on Ser2448.
Phosphorylation on Ser2448 of mTOR is highly associated with increased mTORC1 kinase activity (7, 19, 27, 28). Therefore, we have used the phosphorylation of this site as an additional measure of mTORC1 kinase activity by using the phospho-specific antibody, pSer2448 mTOR. Fig. 2A shows a representative immunblot prepared with the pSer2448 mTOR antibody. As shown in Fig. 2B,when normalized to the total amount of mTOR present in the samples, basal phosphorylation of mTOR on Ser2448 is increased significantly in quadriceps muscle extracts prepared from OB mice compared with WT mice (P ≤ 0.05). In WT mice, insulin promoted a significant increase in pSer2448 mTOR immunoreactivty compared with the basal state (P ≤ 0.05); however, in OB mice, no significant differences were detected for pSer2448 mTOR immunoreactivity when basal and insulin-stimulated samples were compared. As shown in Fig. 2A, an immunoblot prepared with an antibody that recognizes all mTOR regardless of phosphorylation demonstrates that total mTOR content in muscles from OB mice is similar to WT mice. In summary, these results examining mTOR directly provide further support that basal mTORC1 signaling is elevated in muscle of OB mice compared with WT mice.
Fig. 2.
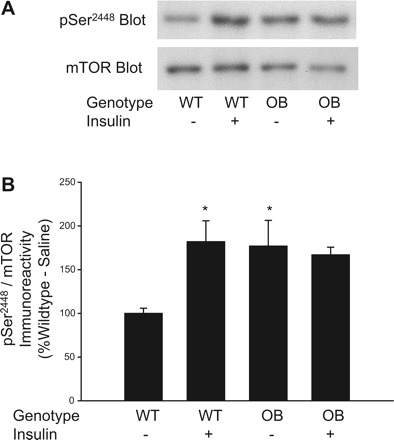
Phosphorylation of mTOR on Ser2448 in muscles from ob/ob mice. Quadriceps muscles from OB and WT mice were rapidly frozen in liquid nitrogen 15 min after an injection of saline or insulin (0.25 U/kg). Muscle extracts were prepared, and mTORC1 activity was assessed by immunoblotting with the pSer2448 mTOR antibody and a total mTOR antibody (A). The pSer2448 mTOR and total mTOR-immunoreactive bands were quantified, and data were normalized to total amounts of mTOR (B). 2 × 2 ANOVA revealed a significant genotype × insulin interaction (P ≤ 0.05). *Significantly different from WT-saline condition by Fisher's LSD post hoc analysis, P ≤ 0.05. The number of muscles per group is 8.
Phosphorylation of PRAS40 on Thr246.
PRAS40 binds mTORC1, inhibiting its kinase activity (25, 37). Upon stimulation with insulin, PRAS40 is phosphorylated on Thr246 by PKB (2, 16) and released from mTORC1, a process that mediates an increase in mTORC1 kinase activity (25, 37). We have used the phosphorylation of PRAS40 on Thr246 as an additional measure of mTORC1 kinase activity by using the phospho-specific antibody, pThr246 PRAS40. In the basal state, pThr246 PRAS40 immunoreactivity is increased significantly in quadriceps muscle extracts prepared from OB mice compared with WT mice (Fig. 3B). Following insulin stimulation, pThr246 PRAS40 immunoreactivity is similar in muscle extracts of OB compared with WT mice (Fig. 3B). As shown in Fig. 3B, in both OB and WT mice, insulin produced a significant increase in pThr246 phosporylation (P ≤ 0.05). When the pThr246 PRAS40 immunoreactivity is normalized to total PRAS40 immunoreactivity and expressed as a ratio, the difference in basal PRAS40 phosphorylation between muscles of OB and WT mice persists, as does the potent effect of insulin. These results provide further support for our hypothesis that basal mTORC1 activity is increased in skeletal muscles of OB mice.
Fig. 3.
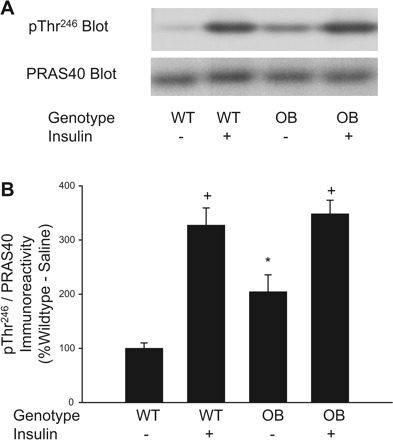
Phosphorylation of PRAS40 on Thr246 in muscles from ob/ob mice. Quadriceps muscles from OB and WT mice were rapidly frozen in liquid nitrogen 15 min after an injection of saline or insulin (0.25 U/kg). Muscle extracts were prepared, and immunoblotting with the pThr246 PRAS40 antibody and a total PRAS40 antibody was performed (A). The pThr246 PRAS40- and total PRAS40-immunoreactive bands were quantified, and data were normalized to total amounts of PRAS40 (B). 2 × 2 ANOVA revealed a significant main effect for insulin (P ≤ 0.05) and a significant genotype × insulin interaction (P ≤ 0.05). *Significantly different from WT-saline condition by Fisher's least significant difference (LSD) post hoc analysis, P ≤ 0.05. +Significantly different from respective saline condition by Fisher's LSD post hoc analysis, P ≤ 0.05. The number of muscles per group is 14–16.
Phosphorylation of PKB on Thr308 and Ser473.
PKB promotes mTORC1 activity by phosphorylating PRAS40 (25, 37) and TSC1/2 (38). Because we demonstrate that basal mTORC1 activity (pThr389 S6K and pSer2448 mTOR immunoreactivity) and basal PRAS40 phophorylation were elevated in muscles of OB mice, we assessed PKB phosphorylation on Thr308 and Ser473, two sites whose phosphorylation are thought to be necessary for full PKB kinase activity (1), by immunoblotting with the phospho-specific antibodies pThr308 PKB and pSer473 PKB. A representative immunoblot prepared with pThr308 PKB antibody and the pSer473 antibody are shown in Figs. 4A and 5A, respectively. As shown in Figs. 4B and 5B, basal phosphorylation of PKB on Thr308 and Ser473 is increased significantly in quadriceps muscle extracts prepared from OB mice compared with WT mice. Following insulin stimulation, PKB phosphorylation is significantly increased in muscles of both OB and WT mice (Figs. 4B and 5B). As expected, insulin-stimulated phosphorylation of PKB on Thr308 and Ser473 are significantly lower in muscle extracts of OB compared with WT mice (Figs. 4B and 5B). As shown in Figs. 4A and 5A, immunoblots prepared with an antibody that recognizes all PKB-β regardless of phosphorylation demonstrates that changes in pThr308 PKB and pSer473 PKB immunoreactivities are not due to differences in expression of the kinase. These results indicate activated PKB in the basal state most likely mediated a portion of the increase in basal mTORC1 activity.
Fig. 4.
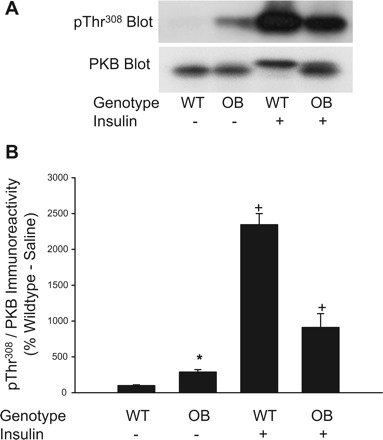
Phosphorylation of PKB on Thr308 in muscles from ob/ob mice. Quadriceps muscles from OB and WT mice were rapidly frozen in liquid nitrogen 15 min after an injection of saline or insulin (0.25 U/kg). Muscle extracts were prepared and mTORC1 activity was assessed by immunoblotting with the pThr308 PKB antibody and a total PKB-β antibody (A). The pThr308 PKB and total PKB-β-immunoreactive bands were quantified, and data were normalized to total amounts of PKB-β (B). 2 × 2 ANOVA revealed significant main effects for genotype (P ≤ 0.05) and insulin (P ≤ 0.05) and a significant genotype × insulin interaction (P ≤ 0.05). *Significantly different from WT-saline condition by Fisher's LSD post hoc analysis, P ≤ 0.05. +Significantly different from saline condition of respective group by Fisher's LSD post hoc analysis, P ≤ 0.05. The number of muscles per group is 8.
Fig. 5.
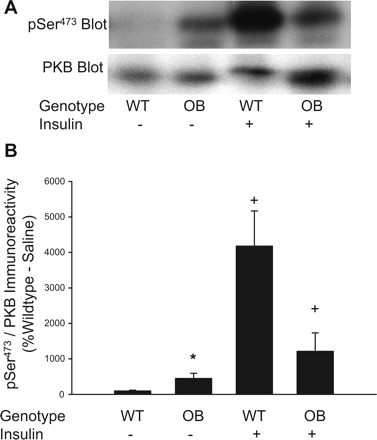
Phosphorylation of PKB on Ser473 in muscles from ob/ob mice. Quadriceps muscles from OB and WT mice were rapidly frozen in liquid nitrogen 15 min after an injection of saline or insulin (0.25 U/kg). Muscle extracts were prepared, and mTORC1 activity was assessed by immunoblotting with the pSer473 PKB antibody and a total PKB-β antibody (A). The pSer473 PKB- and total PKB-β-immunoreactive bands were quantified, and data were normalized to total amounts of PKB-β (B). *Significantly different from WT-saline condition by Fisher's LSD post hoc analysis, P ≤ 0.05. 2 × 2 ANOVA revealed a significant main effects for genotype (P ≤ 0.05) and insulin (P ≤ 0.05) and a significant genotype × insulin interaction (P = 0.012). +Significantly different from saline condition of respective group by Fisher's LSD post hoc analysis, P ≤ 0.05. The number of muscles per group is 8.
IRS-1 expression.
Because mTOR appears to produce insulin resistance in cultured cells by promoting the degradation of IRS-1 (5, 29, 35, 39), we assessed IRS-1 content in muscle from WT and OB mice using a highly sensitive ELISA. Similar to previous studies (6, 13), we demonstrate a 50% decline in IRS-1 levels in muscles from OB compared with WT (Fig. 6). These findings are consistent with the idea that overactive mTORC1 activity leads to lower IRS-1 content.
Fig. 6.
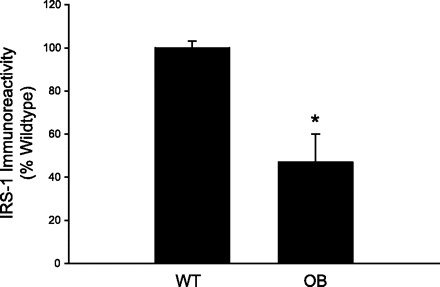
Total IRS-1 content in muscles from ob/ob mice. Quadriceps muscles from OB and WT mice were rapidly frozen in liquid nitrogen. Muscle extracts were prepared, and IRS-1 expression was assessed by an ELISA, according to the manufacturer's instructions. *Significantly different from WT condition by one-way ANOVA, P ≤ 0.05. The number of muscles per group is 8.
In vivo effects of rapamycin on glucose and insulin tolerance.
Little direct evidence supports a role for mTORC1 in the development of in vivo insulin resistance in intact animals or humans. Therefore, we examined the effect of acutely inhibiting mTORC1 with rapamycin 2 h before GT and IT tests in WT and OB mice. As expected, during the GT test, OB mice exhibited greater glucose values at baseline and at all time points after glucose administration compared with WT mice (Fig. 8). The higher glucose values during the GT test in OB mice resulted in greater total area under the GT curve compared with WT mice (Table 2). The relationship between the area under the GT curve and mTORC1 activity (pThr389 S6K immunoreactivity) was very weak (R = 0.16). Although treating mice with rapamycin abolishes mTORC1 activity (Fig. 7), the inhibitor did not alter blood glucose values during the GT test (Fig. 8) or total area under the GT curve (Table 2) in either WT or OB mice. As expected, during the IT test, OB mice exhibited greater glucose values at baseline and at all time points after insulin administration compared with WT mice (Fig. 8). The higher glucose values during the IT test in OB mice resulted in greater total area under the IT curve compared with WT mice (Table 2). The relationship between the area under the IT curve and mTORC1 activity (pThr389 S6K immunoreactivity) was statistically significant (R = 0.44, P ≤ 0.05), suggesting that mTORC1 may play a role in the development of insulin resistance. Despite this moderately strong positive relationship, rapamycin did not alter blood glucose values during the IT test (Fig. 8) or total area under the IT curve (Table 2) in either WT or OB mice. Taken together, these results indicate that acutely inhibiting mTORC1 does not alter insulin sensitivity, despite a significant positive relationship between mTORC1 activity and area under the IT curve.
Table 1.
Body weight and blood glucose values for WT and OB mice
| Body Weight, g | Fasting Blood Glucose, mg/dl | Fed Blood Glucose, mg/dl | |
|---|---|---|---|
| WT mice | 32.1±0.5 (n=24) | 118.8±10.5 (n=20) | 173.0±7.2 (n=20) |
| OB mice | 58.2±0.6*(n=8) | 133.8±13.1 (n=4) | 199.3±10.4*(n=4) |
Values are expressed as means ± SE.
Significantly different from respective wild-type (WT) mice by one-way ANOVA, P < 0.05. OB, ob/ob.
Table 2.
Total area under the glucose tolerance and insulin tolerance curves for WT and OB mice
| Glucose Tolerance AUC | Insulin Tolerance AUC | |
|---|---|---|
| Saline WT mice | 20158±1207 (n=8) | 4691±144 (n=8) |
| Rapamycin WT mice | 17392±1345 (n=8) | 4992±520 (n=8) |
| Saline OB mice | 228619±2147*(n=4) | 13475±1789*(n=4) |
| Rapamycin OB mice | 28085±2204*(n=4) | 15123±2272*(n=4) |
Values are expressed as means ± SE. ANOVA main effect of genotype, P < 0.05. ANOVA main effect of rapamycin, P < 0.05. Genotype × Rapamycin interaction, P = 0.511.
Significantly different from respective WT mice by Fisher's LSD post hoc test, P < 0.05.
Fig. 7.
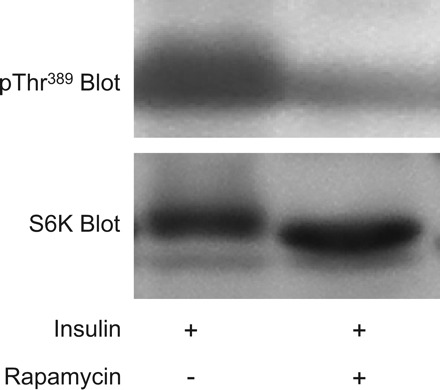
Rapamycin administered in vivo abolishes mTORC1 activity in skeletal muscle. Mice were injected with rapamycin (0.005 mg/g body wt) 120 min prior to the administration of insulin (0.25 U/kg). Fifteen minutes following insulin injection, quadriceps muscles were rapidly excised and frozen in liquid nitrogen. Muscle extracts were prepared, and mTORC1 activity was assessed by immunoblotting with the pThr389 S6K antibody and a total S6K antibody.
Fig. 8.
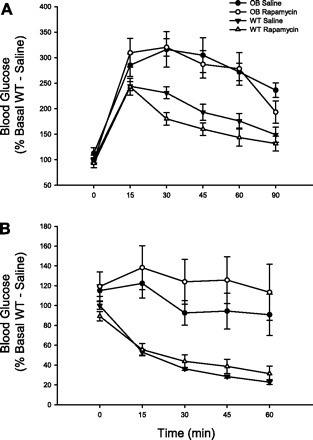
The effect of rapamycin on glucose tolerance and insulin tolerance in OB and WT mice. Mice were injected with rapamycin (0.005 mg/g body wt) 120 min before the administration of glucose (1 mg/g body wt). Tail vein blood was sampled for glucose at 0, 15, 30, 45, 60, and 90 min following glucose administration (A). For the insulin tolerance test, mice were treated in an identical manner, except that insulin (0.25 U/kg) was administered and tail vein blood was sampled for glucose 0, 15, 30, 45, and 60 min (B). The number of animals per group is 4–8. A 2 × 2 ANOVA revealed a significant main effect of genotype for both glucose tolerance and insulin tolerance (P ≤ 0.05). The main effect of rapamycin and the genotype × rapamycin interaction were not significant for either glucose or insulin tolerance.
DISCUSSION
Numerous studies of cultured cells indicate that prolonged activation of the mTORC1 signaling pathway produces insulin resistance. However, the role that mTOR signaling plays in the development of in vivo insulin resistance in intact animals and humans is not established. Therefore, we have examined the activity of the mTORC1 signaling pathway in skeletal muscle of OB mice by assessing the phosphorylation of S6K on Thr389, a site directly phosphorylated by mTORC1. We have also assessed phosphorylation of mTOR on Ser2448, a site whose phosphorylation is associated with increased mTORC1 activity (7, 19, 27, 28). Furthermore, we have studied the effect of rapamycin treatment on in vivo insulin action in WT and OB mice. Our results clearly demonstrate that mTORC1 is constitutively activated in muscles of OB mice and associated with increased basal PKB activity (phosphorylation on Thr308 and Ser473). However, abolishing mTORC1 activity with rapamycin did not improve the insulin sensitivity in WT or OB mice.
The observation that an infusion of branched-chain amino acids decreased insulin-stimulated glucose disposal in human subjects (10, 22, 32) was the first indication that mTORC1 signaling mediates insulin resistance. Subsequent work by Patti et al. (20) established that amino acids reduced IRS-1 tyrosine phosphorylation and PI3K activity in L6 muscle cells and hepatocytes stimulated with insulin. More recent studies of cultured cells demonstrate that mTORC1 kinase activity mediates insulin resistance by reducing IRS-1 tyrosine phosphorylation, enhancing IRS-1 serine phosphorylation, and decreasing IRS-1 levels (11, 21, 34), a process that appears to be dependent on mTORC1 as raptor knockdowns prevent Ser phosphorylation of IRS-1 (35).
To the best of our knowledge, no studies have examined the role of mTORC1 in genetic models of obesity-related insulin resistance. In the present study, we demonstrate that mTORC1 signaling is elevated in the basal state in muscles from OB mice compared with WT mice. Similar to our results, S6K knockout mice are resistant to diet-induced insulin resistance (36), and rats fed a high-fat diet exhibited increased basal phosphorylation of mTOR on Ser2448 (14), a site phosphorylated by S6K (7). The present study expands upon studies of intact animals (14, 36) and cultured cells (3, 5, 35, 39), by demonstrating that mTORC1 activity is positively related to the degree of in vivo insulin resistance. Although our data are correlative, we provide further support for mTORC1 playing a role in the development of insulin resistance in a well-established model of obesity, the ob/ob mouse.
A novel finding of the present study is that basal PKB activity is increased in skeletal muscle of OB mice. The importance of this observation is underscored by the fact that PKB regulates mTORC1 activity (38). In muscles of OB mice, we demonstrate that the phosphorylation of PKB on Ser308 and Thr473 is increased compared with WT mice. This increase in basal PKB activity is most likely due to the well-documented hyperinsulinemia observed in OB mice, despite a significant reduction in IRS-1 levels (see Fig. 6). PKB regulates mTORC1 activity by two proposed mechanisms. First, PKB has been suggested to enhance mTORC1 activity by phosphorylating TSC1/2, a process that results in greater GTP loading of the mTOR interacting protein Rheb. Rheb·GTP is essential for mTOR activity (38). Second, PKB has been suggested to enhance mTORC1 activity by phosphorylating PRAS40, a process that releases PRAS40 from mTORC1, resulting in increased mTORC1 kinase activity (25). Another novel finding of the present study is that basal PRAS40 phosphorylation on Thr246 is increased in muscles of OB compared with WT mice, a process mediated by PKB that likely contributes to increased mTORC1 kinase activity. mTORC1 can also be activated independent of PKB by branched-chain amino acids, particularly leucine (38). She et al. (30) have recently demonstrated that OB mice have elevated plasma branched-chain amino acid levels, which would result in increased mTORC1 activity. Taken together, our findings and those of She et al. (30) indicate that skeletal muscle mTORC1 activity is increased in obesity-related insulin resistance by PKB-dependent and PKB-independent mechanisms.
Because we demonstrate that basal mTORC1 activity is elevated in muscles from OB mice, it is a reasonable hypothesis that inhibiting mTORC1 signaling would improve in vivo insulin action. This point is underscored since data from cell culture studies demonstrate that rapamycin reverses insulin resistance (3, 5, 35, 39). We have also demonstrated that incubating rat epitrochlearis muscles with amino acids impairs insulin-stimulated PKB activity, a process reversed by rapamycin treatment (24). Despite these in vitro findings, treating WT and OB mice with rapamycin prior to assessing GT and IT did not improve in vivo insulin sensitivity (see Fig. 8) despite abolishing mTORC1 activity (see Fig. 7). Although the discrepancy between the in vitro (cultured cells, muscle incubations) and in vivo effects of rapamycin is difficult to explain, it underscores the importance of studying whole body insulin action rather than cultured cells or incubated intact muscles. One potential explanation for the lack of an in vivo effect of rapamycin may be the length of time mTORC1 was activated. Prolonged mTORC1 activation leads to insulin resistance by reducing IRS-1 levels via Ser phosporylation (5, 29, 35, 39). Although acute rapamycin treatment abolishes mTORC1 activity, it would not be expected to restore the 50% reduction in IRS-1 levels we observed in muscles from our OB mice. The magnitude of the present decline in IRS-1 is similar to previous studies of OB mice (6, 13) and obese humans (9, 17). Perhaps chronic treatment with rapamycin might have restored IRS-1 levels, but these experiments are problematic as mTOR plays a key role in the mRNA translation initiation of proteins necessary for insulin action. In fact, chronic in vivo rapamycin treatment can impair insulin action (8). The lack of an acute rapamycin effect on insulin sensitivity in our OB mice suggests that kinases other than mTOR disrupt insulin signaling. Herschkovitz et al. (12) demonstrate that IRS-1 contains at least seven Ser phosphorylation sites and that PKCθ, p38 MAPK, and PKCζ all converge on IKKβ, a Ser kinase that phosphorylates IRS-1. Rapamycin treatment would be expected to prevent Ser phosphorylation of IRS-1 on Ser636 (35), an established mTORC1 phosphorylation site, but altering a single specific Ser phosphorylation site of IRS-1 is not sufficient to disrupt IRS-1 signaling (11). However, Sugita et al. (31) clearly demonstrates inducible nitric oxide synthase (iNOS) reduces IRS-1 levels in skeletal muscle and treating ob/ob mice with the iNOS inhibitor N6-(1-Iminoethyl)-l-lysine dihydrochloride restores IRS-1 to levels found in muscles of WT mice. Finally, we cannot rule out the possibility that the lack of an in vivo effect of rapamycin on GT and IT may be due to nonspecific effects of the inhibitor that may not be present in in vitro cell culture studies.
Perspectives and Significance
In conclusion, we demonstrate that basal PKB/PRAS40/mTORC1 signaling is elevated in skeletal muscle of OB mice compared with WT mice. We also demonstrate a strong relationship between mTORC1 activity in skeletal muscle and the degree of whole body insulin resistance. However, treating OB and WT mice with rapamycin, a highly specific inhibitor of mTORC1, does not improve in vivo insulin action, indicating that other factors in addition to mTORC1 mediate insulin resistance. These findings highlight the importance of examining whole body insulin action to confirm cell culture studies, identifying novel factors regulating insulin signaling. Future studies examining the role of mTORC1 signaling and the effects of rapamycin treatment in other models of obesity-related insulin resistance are warranted.
GRANTS
This work was supported by 7 R15 DK065645-02 from the National Institutes of Health.
Acknowledgments
The authors are grateful to Thurl Harris for his help in preparing this manuscript.
Footnotes
The costs of publication of this article were defrayed in part by the payment of page charges. The article must therefore be hereby marked “advertisement” in accordance with 18 U.S.C. Section 1734 solely to indicate this fact.
REFERENCES
- 1.Alessi DR, Andjelkovic M, Caudwell FB, Cron P, Morrice N, Cohen P, Hemmings BA. Mechanism of activation of protein kinase B by insulin and IGF-1. EMBO J 15: 6541–6551, 1996 [PMC free article] [PubMed] [Google Scholar]
- 2.Beausoleil SA, Jedrychowski M, Schwartz D, Elias JE, Villen J, Li J, Cohn MA, Cantley LC, Gygi SP. Large-scale characterization of HeLa cell nuclear phosphoproteins. Proc Natl Acad Sci USA 101: 12130–12135, 2004 [DOI] [PMC free article] [PubMed] [Google Scholar]
- 3.Berg CE, Lavan BE, Rondinone CM. Rapamycin partially prevents insulin resistance induced by chronic insulin treatment. Biochem Biophys Res Commun 293: 1021–1027, 2002 [DOI] [PubMed] [Google Scholar]
- 4.Bodine SC. mTOR signaling and the molecular adaptation to resistance exercise. Med Sci Sports Exerc 38: 1950–1957, 2006 [DOI] [PubMed] [Google Scholar]
- 5.Carlson CJ, White MF, Rondinone CM. Mammalian target of rapamycin regulates IRS1 serine 307 phosphorylation. Biochem Biophys Res Commun 316: 533–559, 2004 [DOI] [PubMed] [Google Scholar]
- 6.Carvalho-Filho MA, Ueno M, Hirabara SM, Seabra AB, Carvalheira JB, de Oliveira MG, Velloso LA, Curi R, Saad MJ. S-nitrosation of the insulin receptor, insulin receptor substrate 1, and protein kinase B/Akt: a novel mechanism of insulin resistance. Diabetes 54: 959–967, 2005 [DOI] [PubMed] [Google Scholar]
- 7.Chiang GG, Abraham RT. Phosphorylation of mammalian target of rapamycin (mTOR) at Ser-2448 is mediated by p70S6 kinase. J Biol Chem 280: 25485–25490, 2005 [DOI] [PubMed] [Google Scholar]
- 8.Di Paolo S, Teutonico A, Leogrande D, Capobianco C, Schena PF. Chronic inhibition of mammalian target of rapamycin signaling downregulates insulin receptor substrates 1 and 2 and AKT activation: A crossroad between cancer and diabetes? J Am Soc Nephrol 17: 2236–2244, 2006 [DOI] [PubMed] [Google Scholar]
- 9.Goodyear LJ, Giorgino F, Sherman LA, Carey J, Smith RJ, Dohm GL. Insulin receptor phosphorylation, insulin receptor substrate-1 phosphorylation, and phosphatidylinositol 3-kinase activity are decreased in intact skeletal muscle strips from obese subjects. J Clin Invest 95: 2195–2204, 1995 [DOI] [PMC free article] [PubMed] [Google Scholar]
- 10.Ferraninni E, Bevilacqua S, Lanzone L, Bonadonna R, Brandi L, Oleggini M, Boni C, Buzzigoli G, Ciociaro D, Luzi L, Defronzo RA. Metabolic interactions of amino acids and glucose in healthy humans. Diabetes Nutr Metab 3: 175–186, 1988 [Google Scholar]
- 11.Haruta T, Uno T, Kawahara J, Takano A, Egawa K, Sharma PM, Olefsky JM, Kobayashi M. A rapamycin-sensitive pathway down-regulates insulin signaling via phosphorylation and proteasomal degradation of insulin receptor substrate-1. Mol Endocrinol 14: 783–794, 2000 [DOI] [PubMed] [Google Scholar]
- 12.Herschkovitz A, Liu YF, Ilan E, Ronen D, Boura-Halfon S, Zick Y. Common inhibitory serine sites phosphorylated by IRS-1 kinases, triggered by insulin and inducers of insulin resistance. J Biol Chem 282: 18018–18027, 2007 [DOI] [PubMed] [Google Scholar]
- 13.Kerouz NJ, Hörsch D, Pons S, Kahn CR. Differential regulation of insulin receptor substrates-1 and -2 (IRS-1 and IRS-2) and phosphatidylinositol 3-kinase isoforms in liver and muscle of the obese diabetic (ob/ob) mouse. J Clin Invest 100: 3164–3172, 1997 [DOI] [PMC free article] [PubMed] [Google Scholar]
- 14.Khamzina L, Veilleux A, Bergeron S, Marette A. Increased activation of the mammalian target of rapamycin pathway in liver and skeletal muscle of obese rats: possible involvement in obesity-linked insulin resistance. Endocrinology 146: 1473–1481, 2005 [DOI] [PubMed] [Google Scholar]
- 15.Kim DH, Sarbassov DD, Ali SM, King JE, Latek RR, Erdjument-Bromage H, Tempst P, Sabatini DM. mTOR interacts with raptor to form a nutrient-sensitive complex that signals to the cell growth machinery. Cell 110: 163–175, 2002 [DOI] [PubMed] [Google Scholar]
- 16.Kovacina KS, Park GY, Bae SS, Guzzetta AW, Schaefer E, Birnbaum MJ, Roth RA. Identification of a proline-rich Akt substrate as a 14-3-3 binding partner. J Biol Chem 278: 10189–10194, 2003 [DOI] [PubMed] [Google Scholar]
- 17.Kovacs P, Hanson RL, Lee YH, Yang X, Kobes S, Permana PA, Bogardus C, Baier LJ. The role of insulin receptor substrate-1 gene (IRS1) in type 2 diabetes in Pima Indians. Diabetes 52: 3005–3009, 2003 [DOI] [PubMed] [Google Scholar]
- 18.National Institute of Diabetes, and Digestive and Kidney Diseases. National Diabetes Statistics fact sheet: general information and national estimates on diabetes in the United States. Bethesda, MD: U.S. Department of Health and Human Services, National Institutes of Health, 2005
- 19.Navé BT, Ouwens M, Withers DJ, Alessi DR, Shepherd PR. Mammalian target of rapamycin is a direct target for protein kinase B: identification of a convergence point for opposing effects of insulin and amino-acid deficiency on protein translation. Biochem J 344: 427–31, 1999 [PMC free article] [PubMed] [Google Scholar]
- 20.Patti ME, Brambilla E, Luzi L, Landaker EJ, Kahn CR. Bidirectional modulation of insulin action by amino acids. J Clin Invest 101: 1519–1529, 1998 [DOI] [PMC free article] [PubMed] [Google Scholar]
- 21.Pederson TM, Kramer DL, Rondinone CM. Serine/threonine phosphorylation of IRS-1 triggers its degradation. Possible regulation by tyrosine phosphorylation. Diabetes 50: 24–31, 2001 [DOI] [PubMed] [Google Scholar]
- 22.Pisters PWT, Restifo NP, Cersosimo E, Brennan MF. The effects of euglycemic hyperinsulinemia and amino acid infusion on regional and whole body glucose disposal in man. Metabolism 40: 59–65, 1991 [DOI] [PubMed] [Google Scholar]
- 23.Pullen N, Thomas G. The modular phosphorylation and activation of p70s6k. FEBS Lett 410: 78–82, 1997 [DOI] [PubMed] [Google Scholar]
- 24.Reynolds TH, Phelps C. Mammalian target of rapamycin impairs insulin's ability to promote protein kinase B phosphorylation in isolated rat skeletal muscle (Abstract). FASEB J 21: 738.4, 2007 [Google Scholar]
- 25.Sancak Y, Thoreen CC, Peterson TR, Lindquist RA, Kang SA, Spooner E, Carr SA, Sabatini DM. PRAS40 is an insulin-regulated inhibitor of the mTORC1 protein kinase. Mol Cell 25: 903–915, 2007 [DOI] [PubMed] [Google Scholar]
- 26.Sarbassov DD, Guertin DA, Ali SM, Sabatini DM. Phosphorylation and regulation of Akt/PKB by the rictor-mTOR complex. Science 307: 1098–1101, 2005 [DOI] [PubMed] [Google Scholar]
- 27.Scott PH, Brunn GJ, Kohn AD, Roth RA, Lawrence JC. Evidence of insulin-stimulated phosphorylation and activation of the mammalian target of rapamycin mediated by a protein kinase B signaling pathway. Proc Natl Acad Sci USA 95: 7772–7777, 1998 [DOI] [PMC free article] [PubMed] [Google Scholar]
- 28.Sekulić A, Hudson CC, Homme JL, Yin P, Otterness DM, Karnitz LM, Abraham RT. A direct linkage between the phosphoinositide 3-kinase-AKT signaling pathway and the mammalian target of rapamycin in mitogen-stimulated and transformed cells. Cancer Res 60: 3504–3513, 2000 [PubMed] [Google Scholar]
- 29.Shah OJ, Wang Z, Hunter T. Inappropriate activation of the TSC/Rheb/mTOR/S6K cassette induces IRS1/2 depletion, insulin resistance, and cell survival deficiencies. Curr Biol 14: 1650–1656, 2004 [DOI] [PubMed] [Google Scholar]
- 30.She P, Van Horn C, Reid T, Hutson SM, Cooney RN, Lynch CJ. Obesity-related elevations in plasma leucine are associated with alterations in enzymes involved in branched-chain amino acid metabolism. Am J Physiol Endocrinol Metab 293: E1552–E1563, 2007 [DOI] [PMC free article] [PubMed] [Google Scholar]
- 31.Sugita H, Fujimoto F, Yasukawa T, Shimizu N, Sugita M, Yasuhara S, Martyn JAJ, Kaneki M. Inducible nitric oxide snythase and NO donor-induced insulin receptor substrate-1 degradation in skeletal muscle cells. J Biol Chem 280: 14203–14211, 2005 [DOI] [PubMed] [Google Scholar]
- 32.Tappy L, Acheson K, Normand S, Schneeberger D, Thélin A, Pachiaudi C, Riou JP, Jéquier E. Effects of infused amino acids on glucose production and utilization in healthy humans. Am J Physiol Endocrinol Metab 262: E826–E833, 1992 [DOI] [PubMed] [Google Scholar]
- 33.Tremblay F, Gagnon A, Veilleux A, Sorisky A, Marette A. Activation of the mammalian target of rapamycin pathway acutely inhibits insulin signaling to Akt and glucose transport in 3T3–L1 and human adipocytes. Endocrinology 146: 1328–1337, 2005 [DOI] [PubMed] [Google Scholar]
- 34.Tremblay F, Marette A. Amino acid and insulin signaling via the mTOR/p70 S6 kinase pathway. A negative feedback mechanism leading to insulin resistance in skeletal muscle cells. J Biol Chem 276: 38052–38060, 2001 [DOI] [PubMed] [Google Scholar]
- 35.Tzatsos A, Kandror KV. Nutrients suppress phosphatidylinositol 3-kinase/Akt signaling via raptor-dependent mTOR-mediated insulin receptor substrate 1 phosphorylation. Mol Cell Biol 26: 63–76, 2006 [DOI] [PMC free article] [PubMed] [Google Scholar]
- 36.Um SH, Frigerio F, Watanabe M, Picard F, Joaquin M, Sticker M, Fumagalli S, Allegrini PR, Kozma SC, Auwerx J, Thomas G. Absence of S6K1 protects against age- and diet-induced obesity while enhancing insulin sensitivity. Nature 431: 200–205, 2004 [DOI] [PubMed] [Google Scholar]
- 37.Vander Haar E, Lee SI, Bandhakavi S, Griffin TJ, Kim DH. Insulin signalling to mTOR mediated by the Akt/PKB substrate PRAS40. Nat Cell Biol 9: 316–323, 2007 [DOI] [PubMed] [Google Scholar]
- 38.Wang X, Proud CG. The mTOR pathway in the control of protein synthesis. Physiology 21: 362–369, 2006 [DOI] [PubMed] [Google Scholar]
- 39.Zhande R, Mitchell JJ, Wu J, Sun XJ. Molecular mechanism of insulin-induced degradation of insulin receptor substrate 1. Mol Cell Biol 22: 1016–1026, 2002 [DOI] [PMC free article] [PubMed] [Google Scholar]