Abstract
Recent studies of three-dimensional architecture of rat renal inner medulla (IM) and expression of membrane proteins associated with fluid and solute transport in nephrons and vasculature have revealed structural and transport properties that likely impact the IM urine concentrating mechanism. These studies have shown that 1) IM descending thin limbs (DTLs) have at least two or three functionally distinct subsegments; 2) most ascending thin limbs (ATLs) and about half the ascending vasa recta (AVR) are arranged among clusters of collecting ducts (CDs), which form the organizing motif through the first 3–3.5 mm of the IM, whereas other ATLs and AVR, along with aquaporin-1-positive DTLs and urea transporter B-positive descending vasa recta (DVR), are external to the CD clusters; 3) ATLs, AVR, CDs, and interstitial cells delimit interstitial microdomains within the CD clusters; and 4) many of the longest loops of Henle form bends that include subsegments that run transversely along CDs that lie in the terminal 500 μm of the papilla tip. Based on a more comprehensive understanding of three-dimensional IM architecture, we distinguish two distinct countercurrent systems in the first 3–3.5 mm of the IM (an intra-CD cluster system and an inter-CD cluster system) and a third countercurrent system in the final 1.5–2 mm. Spatial arrangements of loop of Henle subsegments and multiple countercurrent systems throughout four distinct axial IM zones, as well as our initial mathematical model, are consistent with a solute-separation, solute-mixing mechanism for concentrating urine in the IM.
Keywords: kidney, countercurrent system, computer-assisted reconstruction, functional anatomy, NaCl transport, urea transport, mathematical model
most mammals can produce a urine that is substantially hyperosmotic to plasma, a capability that allows them to sustain solute excretion while simultaneously conserving water. This urine concentrating capability is associated with the generation of an increasing osmolality gradient in all, or nearly all, medullary structures, as a function of increasing medullary distance from the corticomedullary boundary to the tip of the papilla. This gradient, which has been confirmed by many investigators (e.g., Refs. 17, 29, and 76), is generated by the accumulation of solutes in the cells, interstitial spaces, tubular spaces, and vascular spaces of the medulla (1, 2, 15). When vasopressin levels are sufficiently elevated [and thus the collecting duct (CD) epithelium is highly permeable to water], collecting duct fluid is concentrated by water efflux into the interstitium, which has an osmolality exceeding that of collecting duct tubular fluid. During maximum antidiuresis, the osmolality of that tubular fluid nearly equals that of the interstitium.
In 1942, Kuhn and Ryffel (35) published a study describing an apparatus that they had constructed to illustrate the principle that the urine concentrating capability of the kidney could arise from countercurrent flows coupled with osmotic differences between renal tubules. In 1951, Hargitay and Kuhn (18) hypothesized that a small osmotic pressure difference between the two limbs of Henle's loop could be multiplied by the countercurrent flow in the loops to generate the medullary corticopapillary osmotic gradient. This hypothesis gained support in 1959 from micropuncture studies conducted by Gottschalk and Mylle (15) and from a mathematical model by Kuhn and Ramel (34). The micropuncture study, conducted in several species of urine concentrating rodents, demonstrated that fluid samples from adjacent inner medullary tubules and vessels were nearly equally hyperosmotic (relative to the blood plasma) and that fluid from the early distal tubule was markedly hyposmotic. The modeling study indicated that an osmotic pressure difference could be established between descending and ascending limbs of the loop of Henle by net transport of solute, unaccompanied by water, out of ascending limbs. This general concept, of countercurrent multiplication of an osmotic pressure difference sustained by active solute reabsorption from ascending limbs, has been widely accepted for the outer medulla, where active transport of NaCl out of the water-impermeable thick ascending limb has been demonstrated (6, 57). Modeling studies have shown that this active transport is sufficient to explain the generation of the osmotic gradient in the outer medulla (see, e.g., Ref. 37).
However, active solute transport coupled with countercurrent flow does not explain the concentrating process in the inner medulla (IM), where the steepest osmotic gradient is generated. The ascending thin limbs (ATLs) found in this region, while essentially impermeable to water (8, 16, 21, 79), have no significant active transepithelial transport of NaCl or of any other solute (21, 22, 47, 48). Most renal researchers believe that the generation of the inner medullary gradient involves countercurrent multiplication by the thin limbs of Henle's loops with washout of the gradient limited by countercurrent exchange in the vasa recta; however, no specific mechanism for the generation of the gradient has gained general acceptance.
The most influential and most widely accepted theory for the generation of the inner medullary osmolality gradient is the “passive mechanism” hypothesis, proposed independently in 1972 by Kokko and Rector (32) and by Stephenson (64). The passive mechanism assumes that the interstitium has a much higher urea concentration than NaCl concentration and that fluid in Henle's loops has a much higher NaCl concentration than urea concentration. If the ATL has a sufficiently high permeability to NaCl, and a sufficiently low permeability to urea, then much NaCl will diffuse (passively) from the ATL lumen into the interstitium, while little urea will diffuse from the interstitium into the thin limb lumen. If the concentration differences can be sustained, the interstitial fluid will be concentrated while the luminal fluid of the loop of Henle is diluted. The passive mechanism hypothesis assumes that the concentrations are sustained by continuous diffusion of urea from the collecting duct lumen and by continuous delivery of tubular fluid having a high NaCl concentration to the ATL; this delivery depends on the descending thin limb's (DTL) having sufficiently low NaCl and urea permeabilities that transepithelial concentration gradients are not dissipated along the course of the DTL. Thus the passive mechanism is critically dependent on specific loop-of-Henle permeabilities to NaCl and urea. However, mathematical models using measured values of urea permeability have generally been unable to generate a significant gradient, and those models using much reduced values of urea permeability do not concentrate to measured physiological maximum urine osmolalities, provided that urine flow is not reduced below physiological levels (60).
The inconsistency between measured urine osmolalities and the predictions of mathematical models has motivated the formulation of a number of alternative hypotheses and corresponding models that evaluate those hypotheses. Wexler and colleagues (71, 72, 75) investigated the potential role of increased anatomic complexity, including the three-dimensional structure of the medulla. Jen and Stephenson (25) hypothesized that the accumulation of an osmotically active substance in the interstitium or vasculature (e.g., an “external osmolyte”) could act as a concentrating agent. Thomas and collaborators, in a series of papers (19, 26, 68), investigated whether lactate could serve as an external osmolyte but acknowledged that such a mechanism appeared insufficient to account for the magnitude of the concentrating effect found in experiments (19). Several investigators have hypothesized that the muscular contractions of the pelvic wall, which induce periodic flow in tubules and vessels of the papilla, play a fundamental role in the IM concentrating mechanism (30, 62). Most recently, Knepper et al. (30) hypothesized that the hyaluronan in the IM interstitium acts as a transducer that transforms the energy of mechanical contractions into a concentrating effect. However, no evidence has been advanced that such a transformation is thermodynamically feasible. The attempts to reconcile mathematical models with the formation of highly concentrated urine have been extensively reviewed (23, 24, 30, 60, 69).
In this review, we summarize new findings on the three-dimensional functional architecture of the IM, and we consider the significance and implications of these findings for the inner medullary urine concentrating mechanism.
Approach to Three-Dimensional Architecture
By whatever mechanism the inner medullary osmotic gradient is produced, it seems reasonable to assume that the mechanism involves (or, is at least influenced by) the interactions of all renal tubular and vascular structures. Thus we believe that the mechanism can be fully understood only in terms of the kidney's three-dimensional functional architecture. Although many aspects of the architecture of the IM can be gleaned from the classic light and electron micrographs of transverse sections of Kriz and coworkers (see, e.g., Refs. 24 and 33), the micrographs do not permit full visualization of three-dimensional tubular and vascular relationships. Therefore, during the past few years, we have been working to understand this functional architecture by using a computer-assisted process to reconstruct the vascular and tubular structures of the IM of the rat kidney (51–54). We chose to perform these initial reconstructions in the rat kidney because most of the work on the mammalian concentrating mechanism, as well as an enormous amount of work on renal physiology in general, has involved rats. However, our preliminary reconstructions in mice are in agreement with those in rats. Moreover, Zhai and coworkers (80) have recently used a related approach to reconstruct complete individual mouse nephrons. Although they have not examined the same anatomic relationships that we have, their findings in the mouse are compatible with ours in the rat.
Our three-dimensional reconstructions are based on serial transverse sections of the IM. Cross sections of tubules and vessels are labeled and distinguished by antibodies to segment-specific transporters and channels (51–53). We use semiautomated image acquisition in combination with graphical, volumetric modeling software to compile the serial sections into three-dimensional surface and volumetric representations of the tubules and vessels (51–54). We are currently using antibodies (51–53) raised against 1) the water channel aquaporin-1 (AQP1), for DTL identification and function; 2) the ClC-K1 chloride channel, for prebend and ATL identification and function; 3) the water channel aquaporin-2 (AQP2), for CD identification and function; 4) the urea transporter B (UT-B), for descending vasa recta (DVR) identification and function; 5) a protein of fenestral diaphragms (PV-1), for ascending vasa recta (AVR) identification; and 6) the heat shock-related protein αB-crystallin, for identification of those epithelial structures that do not express the other proteins.
Observations on Thin Limbs of Henle's Loops
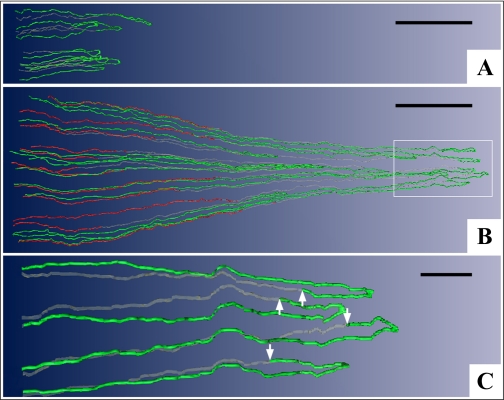
During the initial phase of our functional reconstructions, observations on the thin limbs of Henle's loops (51) motivated the development of a mathematical model to investigate two modes for concentrating the urine in the IM (38). The observations are illustrated for sample loops in Fig. 1. First, the DTLs of those long loops having loop bends within the first millimeter of the IM do not express AQP1 (Fig. 1A) and presumably have little or no permeability to water.
Fig. 1.
Computer-assisted reconstruction of loops of Henle from rat inner medulla (IM) showing expression of aquaporin-1 (AQP1; red) and ClC-K1 (green); gray regions (αB-crystallin) express undetectable levels of AQP1 and ClC-K1. Loops are oriented along the corticopapillary axis, with the left edge of each image nearer the base of the IM. A: thin limbs that have their bends within the first millimeter beyond the outer medullary (OM)-IM boundary. Descending segments lack detectable AQP1. ClC-K1 is expressed continuously along the prebend segment and the ATL. B: loops that have their bends beyond the first millimeter of the IM. AQP1 is expressed along the initial 40% of each descending thin limb (DTL) and is absent from the remainder of each loop. ClC-K1 is expressed continuously along the prebend segment and the ATL. Boxed area is enlarged in C. C: enlargement of near-bend regions of 4 thin limbs from box in B. ClC-K1 expression, corresponding to DTL prebend segment, begins, on average, 165 μm before the loop bend (arrows). Scale bars, 500 μm (A and B) and 100 μm (C). From Layton et al. (38).
Second, those loops having loop bends below the first millimeter of the IM express detectable AQP1 for only ∼40% of their length below the outer medullary (OM)-IM border (Fig. 1B). Below this point they fail to express detectable AQP1 for the remaining 60% of their lengths (Fig. 1, B and C). Thus the longer the loop length, the longer the AQP1-positive and AQP1-negative segments. Indeed, no AQP1 is expressed in any DTL segments in the final 2.0–2.5 mm of the IM. Preliminary data indicate that AQP1 is also absent from the analogous segments in mouse kidneys (Pannabecker TL and Dantzler WH, unpublished observations). We assume that this AQP1-negative lower 60% of the DTLs is either impermeable to water as suggested by our preliminary perfusions of these specific segments (Evans KK, Pannabecker TL, and Dantzler WH, unpublished observations) or only very modestly permeable to water as observed by others during their perfusions of DTLs from deep in the rat IM (8). However, it is not certain that, in the latter study, the perfused segments having modest water permeability were entirely lacking AQP1.
Third, expression of the chloride channel ClC-K1 in each loop begins abruptly in the AQP1-negative portion of the DTL ∼150–200 μm above the hairpin bend and then continues uniformly along the entire length of the ATL within the IM (Fig. 1, A–C). In contrast to the variable lengths of the AQP1-positive and AQP1-negative segments of the DTLs, which depend on the loop lengths, the prebend segments are approximately the same length (mean: 165 μm) in each loop, regardless of the length of the loops (51). There is no colocalization of ClC-K1 and AQP1 in any region of the thin limbs of Henle's loops within the IM (51). Based on previous studies in isolated, perfused ATLs (20, 79), we assume that the entire ClC-K1-positive/AQP1-negative length of each loop (prebend and ATL) is essentially impermeable to water and highly permeable to chloride (and sodium).
Finally, although perfused tubule experiments have supported significant permeability to urea at least along some portions of thin limbs (9, 20, 45), our sections have shown no labeling for UT-A1, UT-A2, or UT-A4 in thin limbs below the first millimeter of the IM (38). These findings are in general agreement with the expression pattern indicated in other immunocytochemical studies (50, 70), although Wade et al. (70) reported colabeling of a UT-A type protein and AQP1 in DTLs from the base of the IM. The segmental distribution and density of urea transport proteins along loops of Henle of the IM are an important unresolved issue. In a mathematical model mode presented below (“pipe” mode), we assumed that only the portions of descending limbs that labeled for AQP1 have substantial urea permeability.
Studies in Mathematical Models
Based on the findings summarized above, we developed mathematical models for two potential concentrating modes, which we called the pipe mode and the “solute secretion” mode. In the pipe mode, the AQP1-negative portions of DTLs were regarded as being nearly impermeable to solutes (and thus like a pipe with respect to solutes) and as having moderately low water permeability; this mode is described in more detail below. In the solute secretion mode, the loops of Henle were assumed to have large urea permeabilities, but zero permeability to water in the APQ1-negative portions of DTLs; this mode, owing to urea secretion into these limb portions, resulted in the delivery of descending limb tubular fluid that was concentrated, relative to fluid in other structures, to the innermost IM. In both modes, the prebend segments and the ATLs were assumed to be highly permeable to NaCl. The models for both modes included loops with turns distributed densely along the corticopapillary axis to approximate loops turning back at all levels of the IM, and the epithelial transport area of CDs was scaled to represent CD coalescences. Also, the models for both modes used the central core assumption, proposed by Stephenson (64), in which the interstitium and vasculature are merged into a common compartment that carries absorbed fluid and solute back to the OM. Finally, the models for both modes assumed significant transepithelial NaCl transport from the CD lumen to the interstitium; such transport is indirectly supported by a substantial body of experimental data (73).
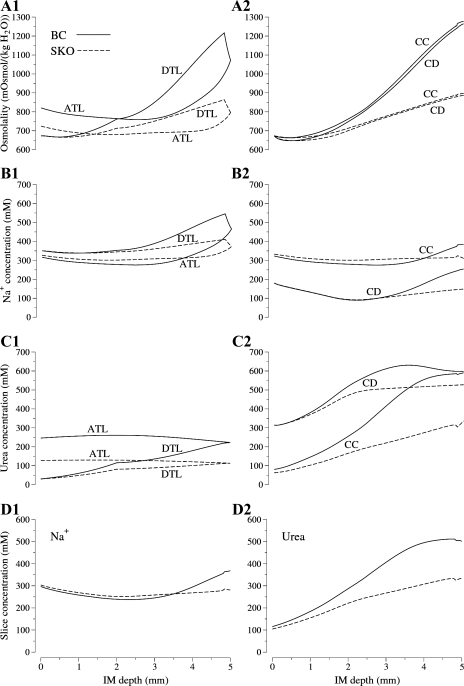
In model calculations, we found that the pipe mode gave better agreement (than the solute secretion mode) with pertinent micropuncture experiments by Pennell et al. (56), and thus we believe that the pipe mode is the more likely of the two modes to be representative of in vivo function. Therefore, we limit further treatment of these modes to the pipe mode (see details for both modes in Ref. 38). Sample results from the pipe mode are shown in Fig. 2; the model base case (labeled “BC”) was based on the findings and assumptions described above. Despite the model's low urea permeability of AQP1-negative portions of DTLs, and low urea permeability in ATLs (1 × 10⁻⁵ cm/s), substantial urea entered the longest loop, as shown in Fig. 2C1. Nonetheless, the large NaCl concentration (represented by the Na+ concentration) within the loop, and the relatively low NaCl concentration outside the loop, when coupled with high NaCl permeability in loop prebend segments and in the ATLs, resulted in a large efflux of NaCl around the loop bends (Fig. 2B1). Because the NaCl efflux from loops exceeds the influx of urea, the central core (i.e., merged interstitium and vasculature) is concentrated, and, consequently, the CD flows are concentrated (by osmotic water absorption) (Fig. 2A2), while the ATLs carry relatively dilute tubular fluid away from the loop bend (Fig. 2A1). The model concentrated to 1,265 mosmol/kgH2O with an appropriate urine flow, 0.0597 nl/(min × nephron). The NaCl and urea concentrations (466 and 223 mM, respectively) in the loop bend of the longest loop were similar to those reported by Pennell et al. (56) (475 and 287 mM, respectively). We acknowledge, however, that the pipe mode does not explain the very high urine osmolalities that have been found in some rats (nearly 3,000 mosmol/kgH2O) (4).
Fig. 2.
Results from the “pipe mode” model. Solid lines, base case (BC); dashed lines, simulated UT-A1/A3-null rat (SKO), which was based on a uniform inner medullary collecting duct (IMCD) urea permeability of 2 × 10⁻⁵ cm/s. ATL, longest ascending thin limb; DTL, longest descending thin limb; CD, collecting duct; CC, central core. A1 and A2: osmolalities; B1 and B2: Na+ concentrations; C1 and C2: urea concentrations, as a function of IM depth; D1 and D2: concentrations of Na+ and urea, respectively, in IM cross sections as a function of IM depth. Results for pipe mode adapted from Layton et al. (38).
The pipe mode may be regarded as a refinement of the passive mechanism that was proposed by Kokko and Rector (32) and Stephenson (64); however, the characterization of that mechanism as “passive” is misleading. Transport work is performed in the OM (mostly in thick ascending limbs) to separate NaCl from urea. Additional transport work is required in the CDs to actively transport NaCl to the interstitium and thus promote osmotic water absorption from the CDs and raise the urea concentration inside CDs, so that the urea will diffuse into the interstitium. In Layton et al. (38), we proposed that the passive mechanism is more appropriately called a “solute-separation, solute-mixing” (SSSM) mechanism, where the “mixing” refers to the intermingling, within the interstitium and vasculature, of NaCl from loops of Henle and urea from CDs.
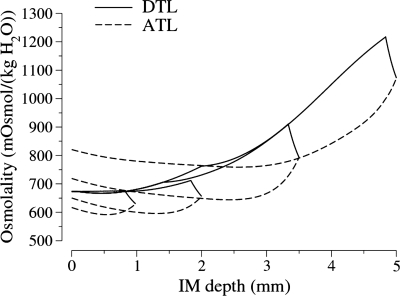
A paradox of the pipe mode is that the model IM concentrates even though the ATLs of sufficiently long loops carry fluid into the OM that has a higher osmolality than the fluid in the corresponding DTLs at the IM-OM boundary. The resolution of this paradox is suggested by the osmolality profiles for four representative long loops shown in Fig. 3. For long loops that are sufficiently short, the fluid in their ATLs at the OM-IM boundary is dilute relative to the fluid in corresponding DTLs at that level. Calculations show that when the contents of all the ATLs passing through the OM-IM boundary are combined, the net flow is dilute relative to the combined contents of all the DTLs.
Fig. 3.
Osmolality profiles in representative loops of Henle from the base case pipe mode model. Results adapted from Layton et al. (38).
Despite this resolution of the paradox, it would be much better, for the task of concentrating the IM, if the ATLs all carried fluid that is dilute relative to their respective DTLs into the IM. The principal reason that many ATLs instead carry concentrated fluid is that so much urea has been secreted into these loops, notwithstanding the low urea permeabilities that were assumed in the model. Moreover, the experimental evidence for substantial urea permeabilities in at least some portions of some DTLs and ATLs (20, 45) cannot be ignored, and no theory of the IM concentrating mechanism will be generally accepted without its being reconciled with that experimental evidence. Our findings regarding the three-dimensional relationships of tubules and vessels in the IM may contribute to such a reconciliation (see below), and these three-dimensional relationships may also help explain how very high urine osmolalities are obtained.
Three-Dimensional Lateral and Vertical Relationships of IM Tubules and Vessels
Loops of Henle and vasa recta are organized around CD clusters.
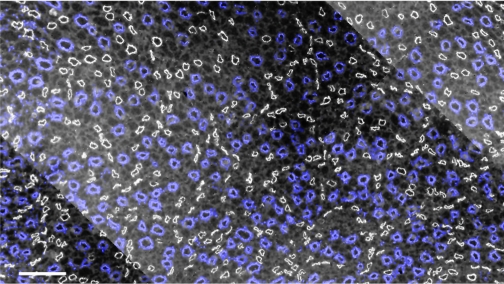
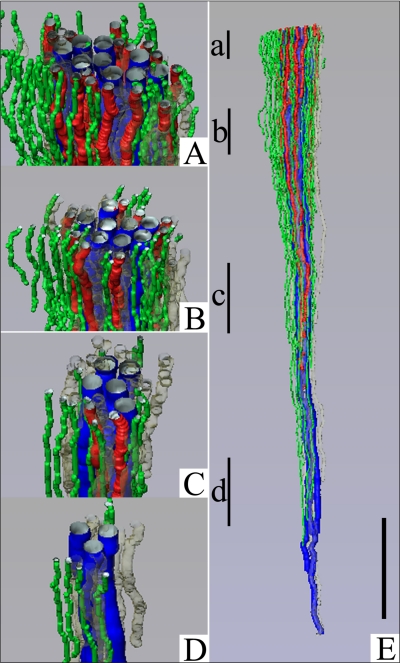
From the OM-IM boundary to deep within the IM, the dominating organizing structural elements for the arrangement of the thin limbs of Henle's loops and of the vasa recta are clearly distinguishable primary clusters of CDs (52, 53). The clusters appearing at the base of the IM are discrete groups of nearby CDs that, as they descend through the first 3.0–3.5 mm of the IM, coalesce to form a single CD, which joins with single CDs from other primary clusters to form new, but fewer, secondary clusters of CDs. Ducts continue to coalesce until only a few remain as the terminal ducts of Bellini at the papilla tip. The organizing pattern formed by these primary CD clusters, when viewed in transverse sections near the base of the IM, is shown in Fig. 4. This figure also shows that the DTLs of Henle's loops are not uniformly distributed in transverse sections but are instead nearly always located outside and surrounding the primary CD clusters (52). Like the DTLs, the DVR are also arranged outside and around the CD clusters (Fig. 5A) (53). The three-dimensional arrangement of DTLs and DVR around a single primary CD cluster is shown in Fig. 6.
Fig. 4.
Transverse section of IM taken ∼40 μm below the OM-IM boundary showing CD clusters in blue surrounded by DTLs in white. Scale bar, 100 μm. From Pannabecker and Dantzler (52).
Fig. 5.
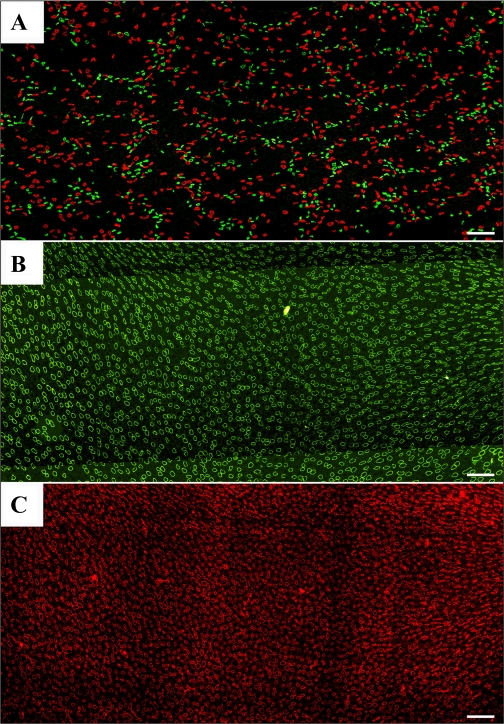
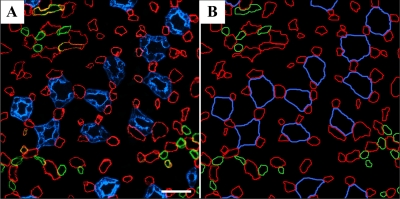
A: transverse section showing reticulated pattern formed by distribution of DTLs (AQP1; red) and descending vasa recta [DVR; urea transporter B (UT-B); green] across a single plane of the IM. Each void, or black space encompassed by DTLs and DVR, is filled by a single cluster of CDs that coalesce as a unit as the segments descend from the OM-IM boundary toward the papilla. A: ∼900 μm below OM-IM boundary. B and C: ∼1,300 μm below the OM-IM boundary, showing nearly uniform distribution of ATLs (ClC-K1; green) and ascending vasa recta (AVR; PV-1; red) in adjacent transverse sections from the renal IM. Unequal numbers of DTLs and ATLs reflect the prebend regions and AQP1-null DTLs. Scale bars, 100 μm. From Pannabecker and Dantzler (53).
Fig. 6.
Three-dimensional reconstruction showing spatial relationships of DVR (green tubules) and DTLs (red tubules) to CDs (blue tubules) for a single CD cluster. DTL segments that do not express AQP1 were identified by their expression of αB-crystallin and are shown in gray. DVR and DTLs are spatially separate from the CDs and panels A–D show that this relationship continues along the entire axial length of the CD cluster. Tubules in A–D have been rotated forward ∼20°. Axial positions of A–D are shown in E with lower case letters. Tubules are oriented in a corticopapillary direction, with the top edge of the image nearer the base of the IM. Scale bar, 500 μm. From Pannabecker and Dantzler (53).
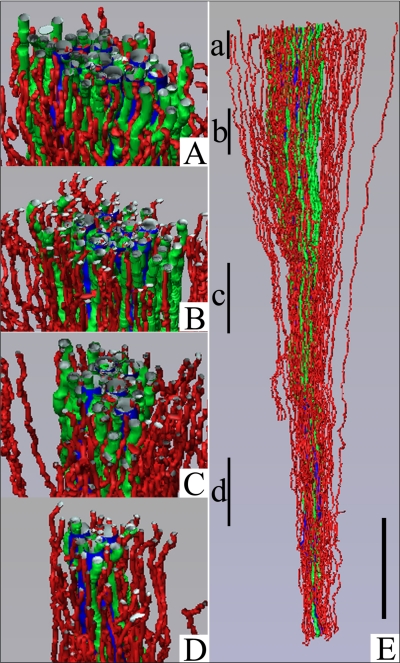
In contrast to the arrangement of the DTLs and DVR external to primary CD clusters, the ATLs and AVR are arranged nearly uniformly across the IM when viewed in transverse sections (Fig. 5, B and C) (52, 53). Therefore, ATLs and AVR are located both inside and outside the primary CD clusters (52, 53). The three-dimensional arrangement of ATLs and AVR both inside and outside a single primary CD cluster is shown in Fig. 7.
Fig. 7.
Three-dimensional reconstruction showing spatial relationships of AVR (red tubules) and ATLs (green tubules) to CDs (blue tubules) for the same CD cluster shown in Fig. 6. AVR and ATLs are distributed relatively uniformly outside and within the CD cluster, and A–D show that this relationship continues along the entire axial length of the CD cluster. Tubules in A–D have been rotated forward ∼20°. Axial positions of panels A–D are shown in E with lower case letters. Tubules are oriented in a corticopapillary direction, with the top edge of the image nearer the base of the IM. Scale bar, 500 μm. From Pannabecker and Dantzler (53).
Lateral relationships of loops of Henle, vasa recta, and CDs suggest functional compartmentation and preferential interactions.
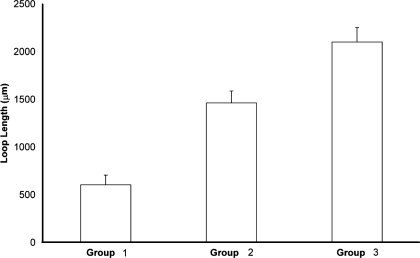
This arrangement of thin limbs of Henle's loops, vasa recta, and collecting ducts leads to significant lateral relationships. First, those ATLs within a CD cluster tend to be separated from their own DTLs, which are outside the cluster (52). This does not mean that the descending and ascending limbs of every individual loop are separated even at the base of the IM because some individual loops lie completely outside the clusters, and many DTLs and ATLs from different loops lie very close to each other outside the clusters (52). Moreover, the distance by which descending and ascending limbs of individual loops are separated from each other by their positions outside and inside the CD clusters decreases as the loops get longer. At the base of the IM, the ATLs closest to the center of each cluster belong to the very short loops with completely AQP-negative DTLs. ATLs further from the center belong to longer loops, and the ATLs at the border of the cluster belong to even longer loops. Thus, as the loops get longer and the branches of each CD cluster coalesce, the ATLs move toward the outside of the cluster and closer to their own DTLs. The position of the ATLs relative to the cluster is quantified in Fig. 8. However, in general, the two limbs of an individual loop do not appear to abut each other (Fig. 1) (51).
Fig. 8.
Relationships between proximity of ATLs to CDs and thin limb lengths. ATLs were categorized into 3 groups defined by their lateral relationships with CDs. Lengths of loops in each group (measured from IM base to loop bend; means ± SE) are shown for all ATLs associated with 3 primary CD clusters (open bars). The 3 mean values are significantly different from each other (ANOVA with Tukey's post hoc test; P < 0.05). Modified from Pannabecker and Dantzler (52).
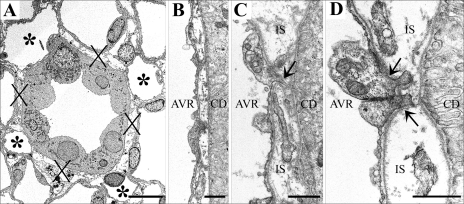
Second, the AVR lying inside the CD clusters appear to have a substantially different function from the AVR lying outside the collecting duct clusters in maintaining (and possibly establishing) the inner medullary osmotic gradient. Nearly all the AVR inside the clusters closely abut a CD and lie parallel to it for a considerable distance on the corticopapillary axis (Figs. 9 and 10) (53). The close relationship between these AVR and each CD is shown in more detail in Fig. 11. The basal plasma membrane of each ascending vas rectum is typically positioned ∼0.5–1.0 μm from the basal plasma membrane of the CD to which it abuts, but the AVR are not fused to the CD (Fig. 11B). Thus there is a clearly defined interstitial space between each ascending vas rectum and the CD. Although the AVR are not fused to the CDs that they abut, they are attached to these CDs by small basal processes arising from the vascular endothelial cells (Fig. 11, C and D), which have been described previously (5, 67). Throughout most of the IM, four of these AVR, on average, are arranged in a nearly symmetrical pattern around each CD so that ∼55% of the surface area of each CD is closely apposed to the surface of AVR. As the terminal CDs increase markedly in diameter in the final 1.0 mm (especially the final 0.5 mm) of the papilla, the number of AVR abutting these CDs increases so that the fraction of surface area apposed to AVR remains essentially constant (54). This arrangement suggests that a major function of those AVR abutting CDs is to move absorbate from the CDs rapidly toward the base of the IM. In contrast, many of the AVR outside the CD clusters are arranged adjacent to the many fewer DVR (Fig. 9). This arrangement will favor countercurrent exchange between AVR and DVR, thereby delaying washout of solute from the IM and helping to preserve the osmotic gradient. However, in the final 1.5–2.0 mm of the IM, all vessels are fenestrated, there are no UT-B containing vessels, and there is no clear evidence of a systematic arrangement of descending and ascending vessels that could function readily in countercurrent exchange in this terminal region (54).
Fig. 9.
Transverse section from near the base of the IM. A: IM AVR and capillaries (red) are symmetrically positioned around CDs (blue) and make intimate contact with adjacent CDs. This relationship extends from the base of the IM to the tip of the papilla for most CDs. IM UT-B-expressing DVR (green) tend to be distant from CDs. B: diagrammatic representation of tubules and vessels to facilitate pattern analysis. Scale bar, 30 μm. From Pannabecker and Dantzler (53).
Fig. 10.
Three-dimensional reconstruction of single CD segment (blue) with multiple AVR (red) butted up against it. Top: 90° axial rotation of segments shown in adjacent panels. Scale bar, 100 μm. From Pannabecker and Dantzler (53).
Fig. 11.
Electron micrographs showing transverse sections of CDs and AVR from ∼1.5 (A, B, and D) and 4 mm (C) below the base of the IM. A: CD surrounded by 4 AVR (asterisks). Other tubular structures surrounding the CD are ATLs. Interstitial nodal spaces (X) are formed between CD, AVR, and ATLs. Scale bar, 10 μm. B: AVR abuts CD with minimal direct contact. Scale bar, 1 μm. C: AVR abuts CD with microvillus (arrow). IS, interstitium. Scale bar: 1 μm. D: AVR abuts CD with microvilli (arrows). Scale bar, 1 μm. From Pannabecker and Dantzler (53).
Interstitial nodal spaces may serve as solute-mixing compartments.
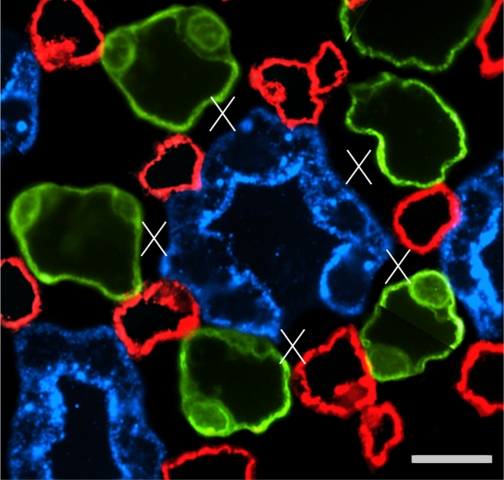
The arrangement of the CDs and some of the AVR and ATLs inside the CD clusters form interstitial nodal spaces when viewed in transverse sections (Figs. 11A and 12) (53). These spaces are bordered on one side by a CD (in which axial tubular flow is away from the medullary base), on the opposite side by one or more ATLs (in which axial tubular flow is toward the medullary base), and on the other two sides by AVR (in which the axial vascular flow is toward the medullary base) (Figs. 11A and Fig. 12). This arrangement continues along the corticopapillary axis of the IM, but the spaces are almost certainly not simple columns (53). Several studies showing interstitial cells in a ladder-like arrangement along the corticopapillary axis (28, 43, 67) suggest that these interstitial nodal spaces are ∼1 μm thick in the corticopapillary direction and are bordered above and below by transverse interstitial cells and/or their processes. Thus these interstitial nodal spaces, or microdomains, are probably arranged in stacks, not columns. The number of these spaces per unit volume of IM and their size is relatively constant throughout the upper 3–4 mm of the IM. However, as the loops of Henle turn back, particularly in the final millimeter, the number of these interstitial nodal spaces decreases slightly per papillary unit volume but their size increases markedly (54). Such repeating microdomains, each delimited by papillary-cortical-flowing ATLs and AVR on three sides, a cortical-papillary-flowing CD on the fourth side, and an interstitial cell or its processes above and below, could facilitate solute mixing and thus play an important role in generating the IM osmotic gradient (see below).
Fig. 12.
One single CD in transverse section showing interstitial nodal spaces (X) between CD (blue), AVR (red), and ATLs (green) in a composite image of 2 sections 3 μm apart, from near the IM base. Open space in wall of central CD is the location of an intercalated cell, which does not label for AQP2. Scale bar, 10 μm. From Pannabecker and Dantzler (53).
Broad transverse bends of loops of Henle reside in the papillary tip.
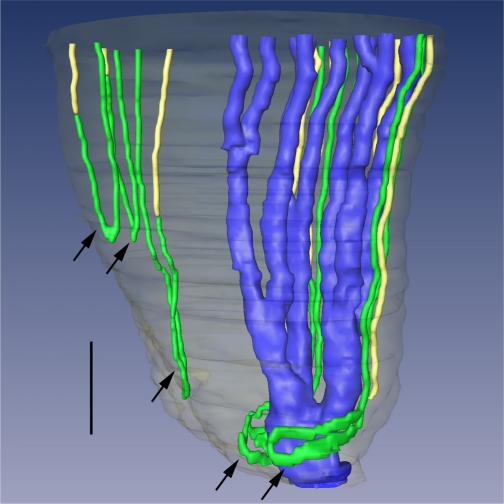
The bends of many loops of Henle change dramatically in the terminal 500 μm of the IM. About one-half the loops reaching this level, instead of having narrow hairpin bends with only small transverse segments, have bends with very broad transverse segments that include part of the ClC-K1-positive prebend region of the DTL and part of the ClC-K1-positive ATL (Fig. 13) (54). These broad bends tend to be close to and curved laterally around the terminal CDs in this region (Fig. 13). These transverse loop segments have not been described before and we are unaware of any transport studies that might have encompassed them. Moreover, aside from ClC-K1 expression, nothing is known about their expression of transport-related proteins. Nevertheless, because these broad transverse bends are ClC-K1 positive, we infer that, like the thin ascending limbs (20), they are highly permeable to sodium and chloride and may help deliver large amounts of these solutes to the interstitium at the very tip of the papilla despite the decrease in the number of loops reaching this region.
Fig. 13.
Three-dimensional reconstruction of several papillary CDs (AQP2, blue), ATLs (ClCK-1, green), and AQP1-null DTLs (AQP1 and α-B crystallin, yellow). Papillary surface epithelium is shown in gray. Tight narrow bends of loops of Henle (top 3 arrows) and wide transverse bends of loops of Henle (bottom 2 arrows) are shown. Wide transverse bends of 2 loops reaching to near the tip of the papilla almost completely encompass a final CD segment (blue) before its merging with the papillary wall (surface epithelium; translucent gray) to form a duct of Bellini. Relative diameters of loops and CDs in this image nearly approximate true dimensions. Scale bar, 200 μm. From Pannabecker and Dantzler (54).
The Case for a SSSM Mechanism
Experiments support solute mixing and a special role for urea.
As noted above, much effort has been directed to finding alternatives to the “passive” SSSM mechanism proposed by Kokko and Rector (32) and by Stephenson (64). The principal reason for seeking such alternatives has been microperfusion data that have indicated high urea permeabilities in long loops of Henle (9, 20, 45). Nonetheless, a substantial prima facie case can be made for a SSSM mechanism, and no convincing case has been made for any of the alternatives. Solute separation is generally acknowledged to occur, in that DTL tubular fluid entering the IM is believed to be rich in NaCl whereas the fluid entering the IMCD, under appropriate conditions, is believed to be rich in both urea and electrolytes (mostly KCL and NaCl), and the fluid in the terminal portion of the CDs can have urea as its predominant solute (10, 17). Moreover, ATLs in rat, hamster, and chinchilla have been found to be highly permeable to NaCl (9, 20), and, in the presence of vasopressin, the middle and terminal portions of the IMCDs have been found to be highly permeable to urea (27, 61). Because ATLs and CDs are generally found to be adjoining each other in the IM, and they appear to share common interstitial spaces (the nodes described above), there seems to be little reason to doubt that NaCl from ATLs mixes with urea from CDs, and that along with water absorbed from DTLs and IMCDs, these solutes form a substantial portion of the IM absorbate. Moreover, there is an active transepithelial transport process for NaCl, yet to be completely described, that not only expels NaCl from IMCDs but also aids the absorption of both water and urea from IMCDs (73) (the water absorption, by osmosis, is secondary to the NaCl absorption, and enhanced urea absorption, by facilitated diffusion, is secondary to the osmosis, which raises the CD tubular fluid urea concentration relative to interstitial urea concentration). The crucial, and unresolved, question is whether solute mixing is sufficient to explain the generation of the axial osmotic gradient by diluting the ATL fluid that enters the OM, relative to the fluid that enters the IM in DTLs, DVR, and CDs.
Several lines of evidence are consistent with, or supportive of, a solute-mixing mechanism. A number of experimental studies have suggested that urea plays a fundamental role in the concentrating mechanism of the IM (10–12, 14, 36, 58, 59, 77, 78). Mathematical models using reduced urea permeabilities and other idealized assumptions have demonstrated that, in principle, solute mixing can generate a substantial IM concentrating effect (38, 40, 42, 63, 65, 66). Studies in transgenic mice have shown that the elimination of transporter proteins that are thought to play a key role in IM solute mixing results in impaired urine concentrating capability. Mice lacking AQP1 (7) (found in upper DTLs) or ClC-K1 (found in long loop prebends and in ATLs) have greatly reduced concentrating capability, as do mice lacking UT-A1 and UT-A3 (found in IMCD) (11, 12). Moreover, urea transport proteins have not been identified in ATLs, and microperfusion studies show a scatter in urea permeabilities measured in ATL (20) (in hamster, values from ∼3 to 40 × 10−5 cm/s). Such a scatter suggests subpopulations of ATLs having differing urea permeabilities or variability in urea permeability as a function of location along ATLs.
Experiments in UT-A1/A3-null mice appear to be consistent with a SSSM mechanism.
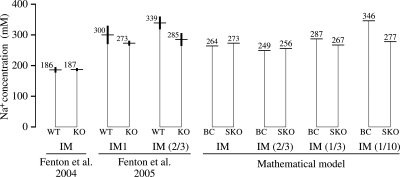
However, some findings appear to cast doubt on a fundamental role for a solute-mixing mechanism. Fenton and collaborators (11, 12) have interpreted their recent findings in UT-A1/A3-null mice as a disconfirmation of a SSSM concentrating mechanism in the IM. These mice, which in the antidiuretic state have very low IMCD urea permeabilities, have much reduced urine concentrating capability compared with antidiuretic wild-type mice. Whole IM tissue samples, and samples from portions of the IM, have shown relatively small differences in sodium concentration between wild-type and the UT-A1/A3-null mice (see Fig. 14). From these findings, Fenton et al. (11, 12) concluded that urea absorption from CDs has no significant effect on the accumulation of NaCl in the IM, and that, therefore, a SSSM mechanism like that described by Kokko and Rector (32) and by Stephenson (64) cannot be the mechanism that promotes NaCl accumulation in the IM.
Fig. 14.
Tissue sodium concentrations in IM: comparison of findings by Fenton et al. (11, 12) in wild-type (WT) and UT-A1/A3-null mice (KO) with analogous base-case (BC) and simulated knockout (SKO) results from pipe mode model for the rat. IM indicates whole inner medulla; IM1 indicates the base of the inner medulla; fractions indicate inner fractional portions of IM. Concentrations are labeled in each instance; thick vertical line segments represent SE. None of the Na+ concentration differences between WT and KO were judged to be significant by Fenton et al. (11, 12).
However, when we conducted simulation experiments in our pipe mode model for the rat (38) that were analogous to the experiments conducted by Fenton et al. (11, 12), our results were similar to those reported by them in the transgenic mice. A comparison of basic results for our model's BC and simulated knock-out (SKO) rat (i.e., simulated UT-A1/A3-null rat) is shown in Fig. 2. In our model, we reduced urea permeability from normally high physiological values (represented by an increasing permeability along the middle and terminal IMCD, attaining a maximum of 110 × 10−5 cm/s) to 2 × 10⁻⁵ cm/s along the entire course of the IMCD. As shown in Fig. 2B2, we found differences in sodium concentration that were similar to those reported by Fenton et al. (11, 12). Compared with the BC, the SKO results show greatly reduced concentrating capability (Fig. 2, A1 and A2), and significantly reduced sodium and urea concentrations (Fig. 2, B1, B2, C1, and C2). Our simulated tissue slice results, which take into account the decreasing populations of loops and CDs (but do not include cells, which are not represented in our model), predict that sodium concentrations differ only in the deepest portion of the IM (Fig. 2D1), and, consistent with the findings by Fenton and coworkers (11, 12), these calculations predict significantly less urea accumulation in the IM of transgenic animals than in wild-type animals (Fig. 2D2).
In Fig. 14 we compare results from the studies of Fenton et al. (11, 12) with our model results. In this figure, “IM” indicates the whole inner medulla, “IM1” indicates the base of the inner medulla, and a fraction following “IM” indicates an experiment or model calculation based on that fractional inner portion of the IM. In the case of the model results, the concentrations were weighted by cross-sectional area to obtain appropriate volume comparisons. The model results predict that a significant difference in sodium concentration may only be seen if comparisons are based on tissue from the innermost IM. Indeed, the model results suggest that the results found in vivo in UT-A1/A3-null mice are consistent with a SSSM mechanism and not inconsistent, as was claimed by Fenton and coworkers (11, 12).
In the interpretation of the data collected by Fenton and coworkers (11, 12), the volume where the highest IM concentrations are attained must be taken into consideration. Koepsell et al. (31) found steep exponential increases in Na+ and Cl− tissue concentrations only in the final millimeter of the rat IM; those increases were as much as half of the total increase along the entire medulla. By consideration of the data collected by Becker (3), it can be estimated that the tissue volume in this final millimeter is ∼4% of the total IM volume and <1% of the total volume of the rat renal medulla. These considerations suggest that the measurements from the mouse IM that were conducted by Fenton and coworkers (11, 12) are difficult to perform without the introduction of significant experimental error.
Implications of Functional Anatomy
As we continue to reconstruct the three-dimensional architecture of the IM, the emerging tubular-vascular patterns and relationships are suggesting new ideas about the solute and water exchanges that may be important for the urine concentrating mechanism. In the outer portion of the IM (the first 3–3.5 mm), the concentrating mechanism appears to be composed of two countercurrent systems: one localized in the central regions of the CD clusters, the other localized in the intercluster (or peripheral) regions that surround the CD clusters. A third countercurrent system appears to be localized in the inner portion of the IM (the last 1.5–2 mm), where the distinction between the central and peripheral regions is no longer present, but where transversely running loop of Henle portions that are of significant length and that label for ClC-K1 are present. These countercurrent systems appear to involve three functionally distinct subpopulations of long loops of Henle and perhaps as many as four distinct axial levels of the IM.
An intracluster countercurrent system.
The countercurrent system in the central region of the CD cluster appears to function specifically to raise the osmolality of CD tubular fluid by facilitating the targeted delivery of NaCl via prebend segments and corresponding postbend segments of long loops and by mostly confining absorbed NaCl, urea, and water within the CD clusters. The microdomains (or nodal spaces) formed by the CDs, AVR, and ATLs appear ideally configured to mix NaCl from loops with absorbate from the CDs (which consists mostly of water, urea, and NaCl) to produce isolated sites of high osmolality that will promote water withdrawal from adjoining CDs. The AVR alongside the CDs provide, at each medullary level, a low-resistance sink for absorbed solutes and water. Moreover, the absorbate, which we believe to be somewhat hyperosmotic relative to CD fluid at each medullary level, is carried via these AVR to higher levels in the CD cluster, where the local absorbate will likely have lower solute concentrations and lower osmolality. At the higher medullary levels, the solutes may diffuse from the AVR into the microdomains and augment the local concentrating effect, and the AVR fluid may promote osmotic water withdrawal from the nodes. In addition, a diffusion of urea from the AVR high in the IM may help limit the diffusion of urea from CDs so that sufficient urea for a SSSM mechanism can be delivered by the CDs to the deeper IM. More generally, the ascension in AVR fluid that is concentrated relative to local fluid would contribute to an optimization of concentrating efficiency.
We consider the countercurrent system in the CD cluster to consist essentially of the downward flows in the CDs and the ascending flows in the AVR. The prebend and corresponding postbend segments of each loop of Henle may be present only locally, for a few hundred micrometers, within the CD cluster. Therefore, in the reference frame of the loop tubular flow, delivery of NaCl to the interstitium in the vicinity of CDs may occur only transiently. The osmotic impact of this NaCl delivery to CD cluster interstitium may be counterbalanced by urea secretion into the near-bend portion of the loop. However, urea secretion may be limited if the NaCl permeability of the loop epithelium is sufficiently large, relative to urea permeability, and if the loop's contact with the nodal microdomain is sufficiently brief (39).
An intercluster countercurrent system.
In the outer 3–3.5 mm of the IM, the tubules and vessels of the peripheral regions of the CD clusters appear to form a second countercurrent system that is separated from the countercurrent system within the central regions of the CD clusters. In the peripheral regions, fluid in DTLs and DVR flows toward the tip of the papilla whereas fluid in ATLs and AVR flows toward the OM. It seems plausible that the principal role of this system is to remove water from the water-permeable portions of DTLs (the upper 40% of these limbs) and thus to raise the tubular fluid NaCl concentration within DTLs before they enter the central regions of the CD clusters and come in contact with the nodal spaces. The efflux of NaCl and urea from intercluster ATL portions and the upward flow of relatively concentrated AVR fluid may promote this water withdrawal, and the AVR may serve to carry the absorbate to the OM. Moreover, the separation of the loop-of-Henle portions in the CD cluster peripheral regions from the central CD clusters may shield those loop portions from the high NaCl and urea concentrations inside the clusters and thus serve to promote absorption of NaCl and urea from the intercluster ATLs into the interstitium of the cluster periphery. In addition, the absorption of NaCl and urea from ATLs may ensure that the fluid carried to the OM by ATLs has a sufficiently low osmolality that the overall concentrating function of the IM is not impaired through a needless osmotic dissipation.
A papillary countercurrent system.
A third countercurrent system can be identified in the final 1.5–2 mm of the IM, where the central and peripheral regions of the CD clusters can no longer be distinguished, the DTLs are intermingled among all the other tubules and vessels, and the vasa recta are all fenestrated and DVR cannot be readily distinguished from AVR. In this portion of the IM, the highest osmolalities and the highest concentrations of urea and NaCl are attained, and here the steepest axial gradients in these quantities are found (17, 31). It may be appropriate to view the inner portion of the IM as the focus of processes in the 3–3.5 mm of the outer IM: those processes determine the concentrations and flow rates of the tubular fluids and blood that enter the inner 1.5–2 mm of the IM and, therefore, those processes must play a fundamental role in enabling the concentrating mechanism in the inner portion of the IM. Thus the fluid entering via DTLs will have had its NaCl concentration raised in the outer portion of the IM, the osmolality of blood entering via DVR will have been increased, and the tubular fluid in CDs not only will have been well concentrated but also will have had its urea concentration raised, relative to NaCl, so that urea diffusion will be enhanced in the inner IM. Moreover, experiments have shown that the highest CD urea permeabilities are found in the terminal portions of the CDs (27, 61), and our preliminary microperfusion experiments indicate that the DTLs are water impermeable at this depth. Thus the CDs and DTLs at this level appear to be well configured for the delivery of urea and NaCl, respectively, for a solute-mixing mechanism, while not adding an unnecessary fluid load to that mechanism. Furthermore, the loops of Henle reaching into the inner IM are, like the other long loops of the IM, configured to deliver NaCl deeply and plentifully in the IM. Some of the loops reaching into the inner IM are similar to shorter loops in that they have prebend segments that label for the ClC-K1 transporter and thus are likely to support a rapid efflux of NaCl in the loop portion that is localized around the hairpin-like loop bend. Other loop bends have a transverse segment that labels for ClC-K1 and that may deliver a NaCl flux that is nearly transversely localized within a narrow band of the corticomedullary axis (54). Mathematical models have indicated that such localized delivery is optimal for concentrating efficacy (38, 41, 46). However, this efficacy may be further enhanced by a three-dimensional feature common to many of the transverse segments: they wrap around nearby CDs (54). Finally, in the inner IM, nodal spaces are also present, although they are larger and have less regularity than in the central CD regions of the outer IM. These nodal spaces are likely to be the principal sites of solute mixing.
Three distinguishable subpopulations of loops of Henle.
The three countercurrent systems of the IM can be understood in terms of three subpopulations of loops of Henle (although these three subpopulations do not coincide strictly with the three countercurrent systems distinguished above): 1) a subpopulation that corresponds to loops of Henle that reach no more than about 1 mm into the IM and that do not label for AQP1 in their descending limbs; 2) a subpopulation that corresponds to loops of Henle that reach >1 mm, and no more than ∼3–3.5 mm, into the IM, that label for AQP1 in the upper ∼40% of their descending limbs, and that usually enter and then ascend within the primary CD clusters for variable distances; and 3) a subpopulation of loops that reaches into the final 1–2 mm of the IM and that also label for AQP1 in the upper ∼40% of their descending limbs. This third category of loops may be further divided into two subpopulations: a: those loops having standard hairpin turns, and b) those loops having transversely running terminal segments of significant lengths (mean length, 94 μm) (54).
The loops of subpopulation 1 appear to pass directly from the OM into the CD cluster. It is likely that these loops encounter significant urea concentrations in the upper IM from the CDs (which nonetheless apparently have a nontrivial urea permeability of ∼3 × 10⁻⁵ cm/s at this level) (61) and, more importantly, from AVR that carry urea-laden fluid from deep in the IM. Owing to a high NaCl permeability in the prebend segment and in the entire IM ATL segment, significant NaCl is likely absorbed, and the ATL tubular fluid that reenters the OM is likely to be hyposmotic relative to the fluid in the corresponding DTLs at the OM-IM boundary.
The loops of subpopulation 2 appear to be more specialized. The first ∼40% of their DTLs are AQP1 positive, and our unpublished results show that they are highly water permeable. However, the terminal portions lack AQP1, and our preliminary data indicate that they are water impermeable. Consistent with classic descriptions of the IM countercurrent system, we hypothesize that the role of water permeability in the upper ∼40% of these DTLs is to allow water absorption so that tubular fluid NaCl concentrations can be elevated for the purpose of promoting plentiful NaCl delivery from loop bends to the microdomains within CD clusters. This water absorption may be driven by 1) relatively hyperosmotic fluid carried by nearby AVR from deep in the IM and 2) absorption of NaCl (and, also, perhaps urea; see above) from the corresponding ATLs after their return from the CD cluster.
The loops of subpopulation 3a are in most respects like those of subpopulation 2, except that their loop bends are alongside CDs of the innermost papilla and interact with microdomains there. It is likely that the distal, AQP1-null portions of the DTLs from subpopulation 3a are near enough to the terminal portions of the CD clusters to come under the influence of the concentrating effects generated by the longest loops of subpopulation 2, provided that the distal DTL portions of subpopulation 3a are sufficiently permeable to water. The loops of subpopulation 3b are similar to those of 3a, except that their transversely running terminal loop segments will allow NaCl absorption from each such segment at essentially one point of the corticopapillary axis. The impact of that absorption will be similar to the Dirac delta function-like absorption that has been predicted to be optimally efficacious (41). The transversely running segments, which are localized in the last half-millimeter of the IM, may be an essential component in the dramatic final stage of urine concentration, which is marked by a steep exponential increase in NaCl concentration (31).
Significance of urea permeability variation along loops of Henle remains an enigma.
Critical and interrelated issues in the central CD regions and in the inner portion of the IM are the role of urea, the degree of net solute absorption from the ATLs, and the capacity of the loops to act as a countercurrent system in which DTL fluid is concentrated while ATL is rendered hyposmotic relative to, e.g., CD tubular fluid at the same level. These issues are made difficult by a lack of information about urea permeabilities in long loops of Henle as a function of loop length and location along the loop. Moreover, determination of urea concentrations within the central regions of the CD clusters will be difficult without highly sophisticated modeling or very significant advances in experimental technology. However, it seems likely that there will be sufficient urea within the CD clusters to promote the passive absorption of NaCl along much of the ATL.
Because urea entry into loops of Henle of the IM has been found in mathematical models to be severely dissipative of the corticomedullary osmotic gradient (38, 42, 49, 65, 66, 74), a hypothetical zero permeability to urea in IM loops of Henle may seem at first consideration to be ideal for a SSSM concentrating mechanism. However, the case of zero permeability ignores a need for solute cycling in sustaining sufficient urea for absorption from CDs, and it ignores the likelihood that a significant degree of basal urea permeability (∼1–2 × 10⁻⁵ cm/s) may exist (13, 61), which may result in significant urea entry into loops of Henle owing to large inward-directed transepithelial urea gradients. Moreover, high urea permeability, especially in ATL portions of the IM that ascend near the OM-IM boundary, could serve to promote urea efflux from ATL, to dilute ATL tubular fluid, and perhaps to concentrate DTL tubular fluid. In DTLs, CDs, and DVR, experimental evidence indicates that urea permeability properties vary along the OM-IM axis, as do various other transport properties (38, 44, 61, 70). Thus it seems to us likely that the urea transport properties along the ATLs might also vary to serve the exigencies of a SSSM urine concentrating mechanism.
Conclusions
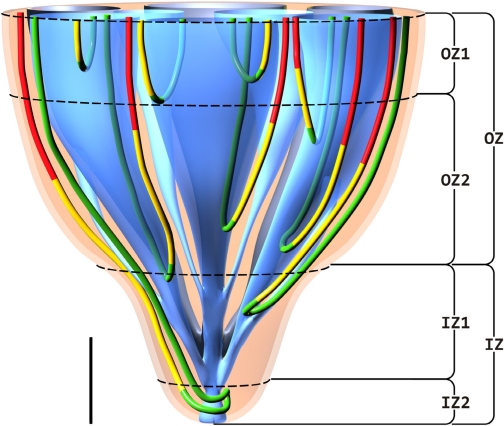
We consider the IM to be an intricate, highly specialized structure, having, as one of its important functions, a capability to produce highly concentrated urine. Our investigations suggest that the final concentrating process is accomplished in stages that can be associated with subsections, or zones, of the IM where distinguishable subpopulations of loops have their bends (loop turns). Four such zones are distinguishable based on data from Pannabecker et al. (55) (Fig. 15) : 1) an outermost zone, OZ1, of ∼1-mm thickness, just below the outer medulla, where loops expressing negligible or no AQP1 have their bends; 2) a larger outer zone, OZ2, just below the outermost zone, 2–2.5 mm in thickness, which contains well-organized CD clusters where tubules and vessels are tightly packed and where loops bend within the central portions of the clusters; 3) an “outer” inner zone, IZ1, where the organization of the CD clusters is diminishing and all vasa recta are fenestrated; and 4) an innermost zone, IZ2, where CD clusters can no longer be distinguished, where the CDs appear to dominate all other structures, where all vasa recta are fenestrated, and where a large fraction of loops exhibit substantial transversely running segments. The two inner zones make up the ∼1.5–2 mm of the papilla.
Fig. 15.
Four zones of the IM are distinguishable based on data from Pannabecker et al. (55). These include an outer zone, OZ, which encompasses the initial 3.0–3.5 mm below the OM/IM border and includes OZ1 and OZ2. CD clusters which coalesce into single CDs are shown in blue. AQP1-positive and AQP1-negative DTLs are shown in red and yellow, respectively. Prebend segments and ATLs are shown in green. In the OZ, CD clusters form the organizing motif around which loops of Henle and blood vessels (not shown) are arranged in an organized fashion. OZ1 includes those loops that express no detectable AQP1. Loops expressing AQP1 along their initial 40% are present in OZ1 and OZ2. An inner zone, IZ, encompasses the terminal 1.5–2.0 mm and includes IZ1 and IZ2. In the IZ, the central organizing motif of CD clusters is diminished and no detectable AQP1 is expressed in DTLs. No detectable AQP1 or UT-B is expressed in blood vessels, and all vasa recta are fenestrated. IZ2 includes the terminal 500 μm of the papilla tip where transverse-running segments lie. See text for additional details. Scale bar, 1 mm along the axial dimension; lateral dimensions are not to scale.
The IM anatomy and patterns of transporter labeling described herein, and the plausible ramifications of those findings as set forth above, are consistent with a SSSM concentrating mechanism in the rat IM. Therefore, we believe that it is premature to dismiss a SSSM mechanism as the fundamental principle of the IM urine concentrating process. However, we acknowledge that more subtle biophysical principles may also be at work, and that these principles may augment a SSSM mechanism, or that such principles may be fundamental to the urine concentrating mechanism of the IM. The certain identification of the IM concentrating mechanism will require much more experimental and theoretical investigation.
GRANTS
The author's work cited in this review was supported in part by National Institutes of Health (NIH) Research Grant DK-16294; Grant ES-06694 for the Southwest Environmental Health Sciences Center; and Training Grants HL-07249 and GM-08400 (W. H. Dantzler and T. L. Pannabecker); NIH Research Grant DK-42091 (H. E. Layton); and National Science Foundation Grant DMS-0715021 (A. T. Layton).
REFERENCES
- 1.Atherton JC, Green R, Thomas S. Influence of lysine-vasopressin dosage on the time course of changes in renal tissue and urinary composition in the conscious rat. Am J Physiol 213: 291–309, 1971. [DOI] [PMC free article] [PubMed] [Google Scholar]
- 2.Beck F, Dorge A, Rick R, Thurau K. Osmoregulation of renal papillary cells. Pflügers Arch 405: S28–S32, 1985. [DOI] [PubMed] [Google Scholar]
- 3.Becker B Quantitative Beschreibung der Innenzone der Rattenniere. 1978.
- 4.Beuchat CA Body size, medullary thickness, and urine concentrating ability in mammals. Am J Physiol Regul Integr Comp Physiol 258: R298–R308, 1990. [DOI] [PubMed] [Google Scholar]
- 5.Bulger RE, Trump BF. Fine structure of the rat renal papilla. Am J Anat 118: 685–722, 1966. [DOI] [PubMed] [Google Scholar]
- 6.Burg MB, Green N. Function of thick ascending limb of Henle's loop. Am J Physiol 224: 659–668, 1973. [DOI] [PubMed] [Google Scholar]
- 7.Chou CL, Knepper MA, Van Hoek AN, Brown D, Ma T, Verkman AS. Reduced water permeability and altered ultrastructure in thin descending limb of Henle in aquaporin-1 null mice. J Clin Invest 103: 491–496, 1999. [DOI] [PMC free article] [PubMed] [Google Scholar]
- 8.Chou CL, Knepper MA. In vitro perfusion of chinchilla thin limb segments: segmentation and osmotic water permeability. Am J Physiol Renal Fluid Electrolyte Physiol 263: F417–F426, 1992. [DOI] [PubMed] [Google Scholar]
- 9.Chou CL, Knepper MA. In vitro perfusion of chinchilla thin limb segments: urea and NaCl permeabilities. Am J Physiol Renal Fluid Electrolyte Physiol 264: F337–F343, 1993. [DOI] [PubMed] [Google Scholar]
- 10.Fenton RA, Chou CL, Sowersby H, Smith CP, Knepper MA. Gamble's “economy of water” revisited: studies in urea transporter knockout mice. Am J Physiol Renal Physiol 291: F148–F154, 2006. [DOI] [PubMed] [Google Scholar]
- 11.Fenton RA, Chou CL, Stewart GS, Smith CP, Knepper MA. Urinary concentrating defect in mice with selective deletion of phloretin-sensitive urea transporters in the renal collecting duct. Proc Natl Acad Sci USA 101: 7469–7474, 2004. [DOI] [PMC free article] [PubMed] [Google Scholar]
- 12.Fenton RA, Flynn A, Shodeinde A, Smith CP, Schnermann J, Knepper MA. Renal phenotype of UT-A urea transporter knockout mice. J Am Soc Nephrol 16: 1583–1592, 2005. [DOI] [PMC free article] [PubMed] [Google Scholar]
- 13.Galluci E, Micelli S, Lippe C. Non-electrolyte permeability across thin lipid membranes. Arch Int Physiol Biochem 79: 881–887, 1971. [DOI] [PubMed] [Google Scholar]
- 14.Gamble JL, McKann CF, Butler AM, Tuthill E. An economy of water in renal function referable to urea. Am J Physiol 109: 139–154, 1934. [Google Scholar]
- 15.Gottschalk CW, Mylle M. Micropuncture study of the mammalian urinary concentrating mechanism: evidence for the countercurrent hypothesis. Am J Physiol 196: 927–936, 1959. [DOI] [PubMed] [Google Scholar]
- 16.Gyory AZ, Beck F, Rick R, Thurau K. Electron microprobe analysis of proximal tubule cellular Na, Cl and K element concentrations during acute mannitol-saline volume expansion in rats: evidence for inhibition of the Na pump. Pflügers Arch 403: 205–209, 1985. [DOI] [PubMed] [Google Scholar]
- 17.Hai MA, Thomas S. The time-course of changes in renal tissue composition during lysine vasopressin infusion in the rat. Pflügers Arch 310: 297–319, 1969. [DOI] [PubMed] [Google Scholar]
- 18.Hargitay B, Kuhn W. Das Multiplikationsprinzip als Grundlage der Harnkonzentrierung in der Niere. Z Electrochem u ang physikal Chem 55: 539–558, 1951. [Google Scholar]
- 19.Hervy S, Thomas SR. Inner medullary lactate production and urine-concentrating mechanism: a flat medullary model. Am J Physiol Renal Physiol 284: F65–F81, 2003. [DOI] [PubMed] [Google Scholar]
- 20.Imai M Function of the thin ascending limb of Henle of rats and hamsters perfused in vitro. Am J Physiol Renal Fluid Electrolyte Physiol 232: F201–F209, 1977. [DOI] [PubMed] [Google Scholar]
- 21.Imai M, Kokko JP. Sodium chloride, urea, and water transport in the thin ascending limb of Henle. Generation of osmotic gradients by passive diffusion of solutes. J Clin Invest 53: 393–402, 1974. [DOI] [PMC free article] [PubMed] [Google Scholar]
- 22.Imai M, Kusano E. Effects of arginine vasopressin on the thin ascending limb of Henle's loop of hamsters. Am J Physiol Renal Fluid Electrolyte Physiol 243: F167–F172, 1982. [DOI] [PubMed] [Google Scholar]
- 23.Jamison RL Urinary concentrating mechanism. In: Membrane Transport and Renal Physiology. The IMA Volumes in Mathematics and Its Applications, edited by Layton HE and Weinstein AM. New York: Springer, 2002, p. 177–192.
- 24.Jamison RL, Kriz W. Urinary Concentrating Mechanism. New York: Oxford University Press, 1982.
- 25.Jen JF, Stephenson JL. Externally driven countercurrent multiplication in a mathematical model of the urinary concentrating mechanism of the renal inner medulla. Bull Math Biol 56: 491–514, 1994. [DOI] [PubMed] [Google Scholar]
- 26.Karlmark B, Jaeger P, Fein H, Giebisch G. Coulometric acid-base titration in nanoliter samples with glass and antimony electrodes. Am J Physiol Renal Fluid Electrolyte Physiol 242: F95–F99, 1982. [DOI] [PubMed] [Google Scholar]
- 27.Kato A, Naruse M, Knepper MA, Sands JM. Long-term regulation of inner medullary collecting duct urea transport in rat. J Am Soc Nephrol 9: 737–745, 1998. [DOI] [PubMed] [Google Scholar]
- 28.Kneen MM, Harkin DG, Walker DL, Alcorn D, Harris PJ. Imaging of renal medullary interstitial cells in situ by confocal fluorescence microscopy. Anat Embryol 200: 117–121, 1999. [DOI] [PubMed] [Google Scholar]
- 29.Knepper MA Measurement of osmolality in kidney slices using vapor pressure osmometry. Kidney Int 21: 653–655, 1982. [DOI] [PubMed] [Google Scholar]
- 30.Knepper MA, Saidel GM, Hascall VC, Dwyer T. Concentration of solutes in the renal inner medulla: interstitial hyaluronan as a mechano-osmotic transducer. Am J Physiol Renal Physiol 284: F433–F446, 2003. [DOI] [PubMed] [Google Scholar]
- 31.Koepsell H, Nicholson WAP, Kriz W, Höhling T. Measurements of exponential gradients of sodium and chloride in the rat kidney medulla using the electron microprobe. Pflügers Arch 350: 167–184, 1974. [DOI] [PubMed] [Google Scholar]
- 32.Kokko JP, Rector FC. Countercurrent multiplication system without active transport in inner medulla. Kidney Int 2: 214–223, 1972. [DOI] [PubMed] [Google Scholar]
- 33.Kriz W Der architektonische und funktionelle Aufbau der Rattenniere. Z Zellforsch 82: 495–535, 1967. [PubMed] [Google Scholar]
- 34.Kuhn W, Ramel A. Activer Salztransport als möglicher (und wahrscheinlicher) Einzeleffekt bei der Harnkonzentrierung in der Niere. Helv Chim Acta 42: 628–660, 1959. [Google Scholar]
- 35.Kuhn W, Ryffel K. Herstellung konzentrierter Losüngen aus verdünten durch blosse Membranwirkung: ein Modellversuch zur Funktion der Niere. Hoppe-Seylers Z Physiol Chem 276: 145–178, 1942. [Google Scholar]
- 36.Layton AT Role of UTB urea transporters in the urine concentrating mechanism of the rat kidney. Bull Math Biol 69: 887–929, 2007. [DOI] [PubMed] [Google Scholar]
- 37.Layton AT, Layton HE. A region-based mathematical model of the urine concentrating mechanism in the rat outer medulla. I. Formulation and base-case results. Am J Physiol Renal Physiol 289: F1346–F1366, 2005. [DOI] [PubMed] [Google Scholar]
- 38.Layton AT, Pannabecker TL, Dantzler WH, Layton HE. Two modes for concentrating urine in rat inner medulla. Am J Physiol Renal Physiol 287: F816–F839, 2004. [DOI] [PubMed] [Google Scholar]
- 39.Layton HE Concentrating urine in the inner medulla of the kidney. Comments Theor Biol 1: 179–196, 1989. [Google Scholar]
- 40.Layton HE Urea transport in a distributed loop model of the urine- concentrating mechanism. Am J Physiol Renal Fluid Electrolyte Physiol 258: F1110–F1124, 1990. [DOI] [PubMed] [Google Scholar]
- 41.Layton HE, Davies JM. Distributed solute and water reabsorption in a central core model of the renal medulla. Math Biosci 116: 169–196, 1993. [DOI] [PubMed] [Google Scholar]
- 42.Layton HE, Knepper MA, Chou CL. Permeability criteria for effective function of passive countercurrent multiplier. Am J Physiol Renal Fluid Electrolyte Physiol 270: F9–F20, 1996. [DOI] [PubMed] [Google Scholar]
- 43.Lemley KV, Kriz W. Cycles and separations: the histotopography of the urinary concentrating process. Kidney Int 31: 538–548, 1987. [DOI] [PubMed] [Google Scholar]
- 44.Lim SW, Han KH, Jung JY, Kim WY, Yang CW, Sands JM, Knepper MA, Madsen KM, Kim J. Ultrastructural localization of UT-A and UT-B in rat kidneys with different hydration status. Am J Physiol Regul Integr Comp Physiol 290: R479–R492, 2006. [DOI] [PubMed] [Google Scholar]
- 45.Liu W, Morimoto T, Kondo Y, Iinuma K, Uchida S, Imai M. “Avian-type” renal medullary tubule organization causes immaturity of urine-concentrating ability in neonates. Kidney Int 60: 680–693, 2001. [DOI] [PubMed] [Google Scholar]
- 46.Marcano M, Layton AT, Layton HE. An optimization algorithm for a distributed-loop model of an avian urine concentrating mechanism. Bull Math Biol 68: 1625–1660, 2006. [DOI] [PubMed] [Google Scholar]
- 47.Marsh DJ, Azen SP. Mechanism of NaCl reabsorption by hamster thin ascending limbs of Henle's loop. Am J Physiol 228: 71–79, 1975. [DOI] [PubMed] [Google Scholar]
- 48.Marsh DJ, Solomon S. Analysis of electrolyte movement in thin Henle's loops of hamster papilla. Am J Physiol 208: 1119–1128, 1965. [DOI] [PubMed] [Google Scholar]
- 49.Moore LC, Marsh DJ. How descending limb of Henle's loop permeability affects hypertonic urine formation. Am J Physiol Renal Fluid Electrolyte Physiol 239: F57–F71, 1980. [DOI] [PubMed] [Google Scholar]
- 50.Nielsen S, Terris J, Smith CP, Hediger MA, Ecelbarger CA, Knepper MA. Cellular and subcellular localization of the vasopressin-regulated urea transporter in rat kidney. Proc Natl Acad Sci USA 93: 5495–5500, 1996. [DOI] [PMC free article] [PubMed] [Google Scholar]
- 51.Pannabecker TL, Abbott DE, Dantzler WH. Three-dimensional functional reconstruction of inner medullary thin limbs of Henle's loop. Am J Physiol Renal Physiol 286: F38–F45, 2004. [DOI] [PubMed] [Google Scholar]
- 52.Pannabecker TL, Dantzler WH. Three-dimensional lateral and vertical relationships of inner medullary loops of Henle and collecting ducts. Am J Physiol Renal Physiol 287: F767–F774, 2004. [DOI] [PubMed] [Google Scholar]
- 53.Pannabecker TL, Dantzler WH. Three-dimensional architecture of inner medullary vasa recta. Am J Physiol Renal Physiol 290: F1355–F1366, 2006. [DOI] [PubMed] [Google Scholar]
- 54.Pannabecker TL, Dantzler WH. Three-dimensional architecture of collecting ducts, loops of Henle, and blood vessels in the renal papilla. Am J Physiol Renal Physiol 293: F696–F704, 2007. [DOI] [PubMed] [Google Scholar]
- 55.Pannabecker TL, Henderson C, Dantzler WH. Quantitative analysis of functional reconstructions reveals lateral and axial zonation in the renal inner medulla. Am J Physiol Renal Physiol 294: F1306–F1314, 2008. [DOI] [PubMed] [Google Scholar]
- 56.Pennell JP, Lacy FB, Jamison RL. An in vivo study of the concentrating process in the descending limb of Henle's loop. Kidney Int 5: 337–347, 1974. [DOI] [PubMed] [Google Scholar]
- 57.Rocha AS, Kokko JP. Sodium chloride and water transport in the medullary thick ascending limb of Henle. J Clin Invest 52: 612–623, 1973. [DOI] [PMC free article] [PubMed] [Google Scholar]
- 58.Sands JM Molecular approaches to urea transporters. J Am Soc Nephrol 13: 2795–2806, 2002. [DOI] [PubMed] [Google Scholar]
- 59.Sands JM Mammalian urea transporters. Annu Rev Physiol 65: 543–566, 2003. [DOI] [PubMed] [Google Scholar]
- 60.Sands JM, Layton HE. The urine concentrating mechanism and urea transporter. In: Seldin and Giebisch's The Kidney: Physiology and Pathophysiology (4th ed.), edited by Alpern RJ and Hebert SC. Amsterdam: Elsevier, 2008, p. 1143–1178.
- 61.Sands JM, Nonoguchi H, Knepper MA. Vasopressin effects on urea and H2O transport in inner medullary collecting duct subsegments. Am J Physiol Renal Fluid Electrolyte Physiol 253: F823–F832, 1987. [DOI] [PubMed] [Google Scholar]
- 62.Schmidt-Nielsen B The renal concentrating mechanism in insects and mammals: A new hypothesis involving hydrostatic pressures. Am J Physiol Regul Integr Comp Physiol 268: R1087–R1100, 1995. [DOI] [PubMed] [Google Scholar]
- 63.Stephenson J, Tewarson R, Mejia R. Quantitative analysis of mass and energy balance in non-ideal models of the renal counterflow system. Proc Natl Acad Sci USA 71: 1618–1622, 1974. [DOI] [PMC free article] [PubMed] [Google Scholar]
- 64.Stephenson JL Concentration of urine in a central core model of the renal counterflow system. Kidney Int 2: 85–94, 1972. [DOI] [PubMed] [Google Scholar]
- 65.Stephenson JL, Zhang Y, Tewarson R. Electrolyte, urea, and water transport in a two-nephron central core model of the renal medulla. Am J Physiol Renal Fluid Electrolyte Physiol 257: F399–F413, 1989. [DOI] [PubMed] [Google Scholar]
- 66.Stewart J, Valtin H. Computer simulation of osmotic gradient without active transport in renal inner medulla. Kidney Int 2: 264–270, 1972. [DOI] [PubMed] [Google Scholar]
- 67.Takahashi-Iwanaga H The three-dimensional cytoarchitecture of the interstitial tissue in the rat kidney. Cell Tissue Res 264: 269–281, 1991. [DOI] [PubMed] [Google Scholar]
- 68.Thomas SR Inner medullary lactate production and accumulation: a vasa recta model. Am J Physiol Renal Physiol 279: F468–F481, 2000. [DOI] [PubMed] [Google Scholar]
- 69.Thomas SR A brief history of theories concerning the mammalian urine concentrating mechanism. Acta Biotheoretica 49: 327–340, 2001. [DOI] [PubMed] [Google Scholar]
- 70.Wade JB, Lee AJ, Liu C, Ecelbarger C, Mitchell C, Bradford AD, Terris J, Kim GH, Knepper MA. UT-A2: a 55-kDa urea transporter in thin descending limb whose abundance is regulated by vasopressin. Am J Physiol Renal Physiol 278: F52–F62, 2000. [DOI] [PubMed] [Google Scholar]
- 71.Wang X, Thomas SR, Wexler AS. Outer medullary anatomy and the urine concentrating mechanism. Am J Physiol Renal Physiol 274: F413–F424, 1998. [DOI] [PubMed] [Google Scholar]
- 72.Wang XQ, Wexler AS. The effects of collecting duct active NaCl reabsorption and inner medulla anatomy on renal concentrating mechanism. Am J Physiol Renal Fluid Electrolyte Physiol 270: F900–F911, 1996. [DOI] [PubMed] [Google Scholar]
- 73.Weinstein AM A mathematical model of the inner medullary collecting duct of the rat: pathways for Na and K transport. Am J Physiol Renal Physiol 274: F841–F855, 1998. [DOI] [PubMed] [Google Scholar]
- 74.Wexler AS, Kalaba RE, March DJ. Passive, one-dimensional countercurrent models do not stimulate hypertonic urine formation. Am J Physiol Renal Fluid Electrolyte Physiol 253: F1020–F1030, 1987. [DOI] [PubMed] [Google Scholar]
- 75.Wexler AS, Kalaba RE, Marsh DJ. Three-dimensional anatomy and renal concentrating mechanism. I. Modeling results. Am J Physiol Renal Fluid Electrolyte Physiol 260: F368–F383, 1991. [DOI] [PubMed] [Google Scholar]
- 76.Wirz H, Hargitay B, Kuhn W. Lokalisation des Konzentrierungsprozesses in der Niere durch direkte Kryoskopie. Helv Physiol Acta 9: 196–207, 1951. [PubMed] [Google Scholar]
- 77.Yang B, Bankir L. Urea and urine concentrating ability: new insights from studies in mice. Am J Physiol Renal Physiol 288: F881–F896, 2005. [DOI] [PubMed] [Google Scholar]
- 78.Yang B, Bankir L, Gillespie A, Epstein CJ, Verkman AS. Urea-selective concentrating defect in transgenic mice lacking urea transporter UT-B. J Biol Chem 277: 10633–10637, 2002. [DOI] [PubMed] [Google Scholar]
- 79.Yool AJ, Brokl OH, Pannabecker TL, Dantzler WH, Stamer WD. Tetraethylammonium block of water flux in aquaporin-1 channels expressed in kidney thin limbs of Henle's loop and a kidney-derived cell line. BMC Physiol 2: 4, 2002. [DOI] [PMC free article] [PubMed] [Google Scholar]
- 80.Zhai XY, Thomsen JS, Birn H, Kristoffersen IB, Andreasen A, Christensen EI. Three-dimensional reconstruction of the mouse nephron. J Am Soc Nephrol 17: 77–88, 2006. [DOI] [PubMed] [Google Scholar]


