Abstract
A series of experimental data points to the existence of profound diffusion restrictions of ADP/ATP in rat cardiomyocytes. This assumption is required to explain the measurements of kinetics of respiration, sarcoplasmic reticulum loading with calcium, and kinetics of ATP-sensitive potassium channels. To be able to analyze and estimate the role of intracellular diffusion restrictions on bioenergetics, the intracellular diffusion coefficients of metabolites have to be determined. The aim of this work was to develop a practical method for determining diffusion coefficients in anisotropic medium and to estimate the overall diffusion coefficients of fluorescently labeled ATP in rat cardiomyocytes. For that, we have extended raster image correlation spectroscopy (RICS) protocols to be able to discriminate the anisotropy in the diffusion coefficient tensor. Using this extended protocol, we estimated diffusion coefficients of ATP labeled with the fluorescent conjugate Alexa Fluor 647 (Alexa-ATP). In the analysis, we assumed that the diffusion tensor can be described by two values: diffusion coefficient along the myofibril and that across it. The average diffusion coefficients found for Alexa-ATP were as follows: 83 ± 14 μm2/s in the longitudinal and 52 ± 16 μm2/s in the transverse directions (n = 8, mean ± SD). Those values are ∼2 (longitudinal) and ∼3.5 (transverse) times smaller than the diffusion coefficient value estimated for the surrounding solution. Such uneven reduction of average diffusion coefficient leads to anisotropic diffusion in rat cardiomyocytes. Although the source for such anisotropy is uncertain, we speculate that it may be induced by the ordered pattern of intracellular structures in rat cardiomyocytes.
Keywords: anisotropy, fluorescence correlation spectroscopy
the intracellular environment of rat cardiomyocytes is highly organized, leading to interactions between organelles (38). From the measurements of respiration affinity to ADP in permeabilized heart muscle fibers, it is clear that the diffusion between mitochondria and the surrounding solution is hindered (20, 31). In addition to possible obstruction of diffusion by mitochondrial outer membrane in this preparation, experiments showed that there is a diffusion restriction between mitochondria and the surrounding solution that groups together ATPases and mitochondria so that endogenously generated ADP has preferential access to mitochondria (14, 32, 34). From analysis of the kinetics data, it became clear that the diffusion is significantly hindered in rat cardiomyocytes (30, 36). A small value of apparent diffusion coefficient was required to explain the measurements on cardiac myofibrils (33) and the kinetics of ATP-sensitive potassium channel (1, 15). NMR diffusion spectroscopy analysis of ATP and phosphocreatine (PCr) in muscle cells suggests the existence of intracellular diffusion restrictions that have overall cylindrical orientation, possibly sarcoplasmic reticulum (12, 19). The diffusion restrictions, when estimated from the affinity of respiration to exogenous ADP in skinned fiber preparations, are considerably reduced after ischemia-reperfusion injury (16, 18). The physiological role of diffusion restrictions, the influence on bioenergetics, and how such influence is changed during ischemia-reperfusion damage are not clear.
To be able to analyze and estimate the role of intracellular diffusion restrictions on bioenergetics, the intracellular diffusion coefficients of ADP/ATP have to be determined. One of the methods that allows us to estimate the diffusion coefficients in parts of a cell is fluorescence correlation spectroscopy (FCS). In its classic form, the fluctuations of fluorescence are analyzed in the same focal volume. This limits its use in determination of diffusion coefficients in anisotropic media, unless anisotropy of diffusion leads to differences in diffusion coefficients that are 10–100-fold (11). Since in muscle cells intracellular structures are aligned in lattice, it is expected that diffusion of ATP can be anisotropic in rat cardiomyocytes. To estimate diffusion coefficients in anisotropic media, bleaching has been used as an alternative to FCS (23, 28). Although a powerful technique, the use of bleaching is problematic when combined with highly photostable dyes. Namely, the required laser intensity in that case could interfere with the autofluorescent proteins in mitochondria, leading to possible changes in intracellular structure. In addition, three-dimensional (3-D) assessment of the bleached volume would be required to analyze bleaching experiments, which makes the method hard to use in practice.
As an alternative to classic FCS, raster image correlation spectroscopy (RICS) has been proposed for estimation of diffusion coefficients in the cells (5, 7, 8). Based on the analysis of fluctuations of fluorescence in a focal volume, RICS allows us to study diffusion in cells without any gradients as required by the methods based on bleaching. The main difference between classic FCS and RICS is that RICS uses the spatial component of fluctuations in the fluorescence signal. By introducing the spatial component in the analysis, RICS has the potential to estimate the anisotropic diffusion tensor. RICS can be used in the commercial laser scanning confocal microscopes, making it a practical method for determination of diffusion coefficients.
The aims of this work are 1) to extend RICS protocols for determination of diffusion coefficients in anisotropic media and 2) to estimate diffusion coefficients of fluorescently labeled ATP in rat cardiomyocytes, taking into account the possible anisotropy of diffusion.
MATERIALS AND METHODS
Development and verification of the method consisted of several steps. First, the point spread function (PSF) of the microscope was measured to use for the RICS analysis. Second, recordings of diffusion of Alexa Fluor 488 and fluorescent microspheres in water were used to verify the method. Third, a program was written to simulate the 3-D movement of molecules in isotropic and anisotropic media. The simulated data were then analyzed as normal image data to ensure that the method was sensitive enough to detect anisotropy in diffusion coefficients. Last, experiments with Alexa Fluor 647-ATP in solution and in rat cardiomyocytes were performed.
Animals.
Adult Wistar rats of both sexes were used for the experiments. All animal procedures were approved by Estonian National Committee for Ethics in Animal Experimentation (Estonian Ministry of Agriculture).
Isolated cardiomyocytes.
Isolated ventricular rat cardiomyocytes were kindly provided by Tuuli Käämbre and Peeter Sikk. Intact ventricular cardiomyocytes were isolated from adult male Wistar rat heart as described previously (17).
Solutions.
The measurement solution contained (in mM) 0.5 K2EGTA (Fluka), 3.0 Mg-acetate (Fluka), 3.0 KH2PO4 (Sigma), 20 taurine (Fluka), 20 HEPES (Roche), 170 sucrose (Sigma), 0.5 dithiothreitol (Sigma), 5 glutamate (Merck), 2 malate (Sigma), 3 ATP (Roche), and 10 PCr (Roche). In addition, 5 mg/ml BSA (Roche) and, for permeabilization, 50 μg/ml saponin (Roche) were added, and pH was adjusted at 25°C to 7.1.
The fluorescent dyes and spheres were purchased from Molecular Probes (Invitrogen). We used fluorescent microspheres for PSF determination (175-nm diameter, 540-nm excitation, 560-nm emission; PS-Speck, product no. P-7220), fluorescent microspheres (actual size reported by Molecular Probes of 24 nm, nominal size of 20 nm; FluoSpheres, product no. F-8782), Alexa Fluor 488 (Alexa 488, product no. A-20000), and Alexa Fluor 647-ATP (Alexa-ATP, product no. A-22362).
Raster image correlation spectroscopy.
To determine diffusion coefficients in the media, we used RICS (5, 7, 8). In short, RICS uses spatial and temporal aspects of confocal images acquired using laser scanning. For simplicity, in the ideal case, the autocorrelation between fluctuations of intensities (F) in pixels of the image separated from each other by vector R is given by
 |
(1) |
where R is a spatial vector connecting two pixels, W is the PSF with the integration performed in space surrounding both pixels, c is the concentration of fluorescent probe, τ(R) is a delay time between acquisition of two pixels, 〈·〉p is averaging over space with the point vector p, and φ is a factor that depends on the properties of the fluorescent dye and confocal microscope. For the isometric case, the autocorrelation term 〈δc(p + r, 0)·δc(p + r′ + R, τ)〉p for diffusing molecule is given by
 |
(2) |
where D is a diffusion coefficient. For the anisotropic case, this relationship is transferred to
 |
where x, y, and z form the principal axes system for the diffusion tensor; x, y, z are components of r (similar notation is used for r′ and R), and Dx, Dy, and Dz are diagonal components of the diffusion tensor in the coordinate system composed of the principal axes.
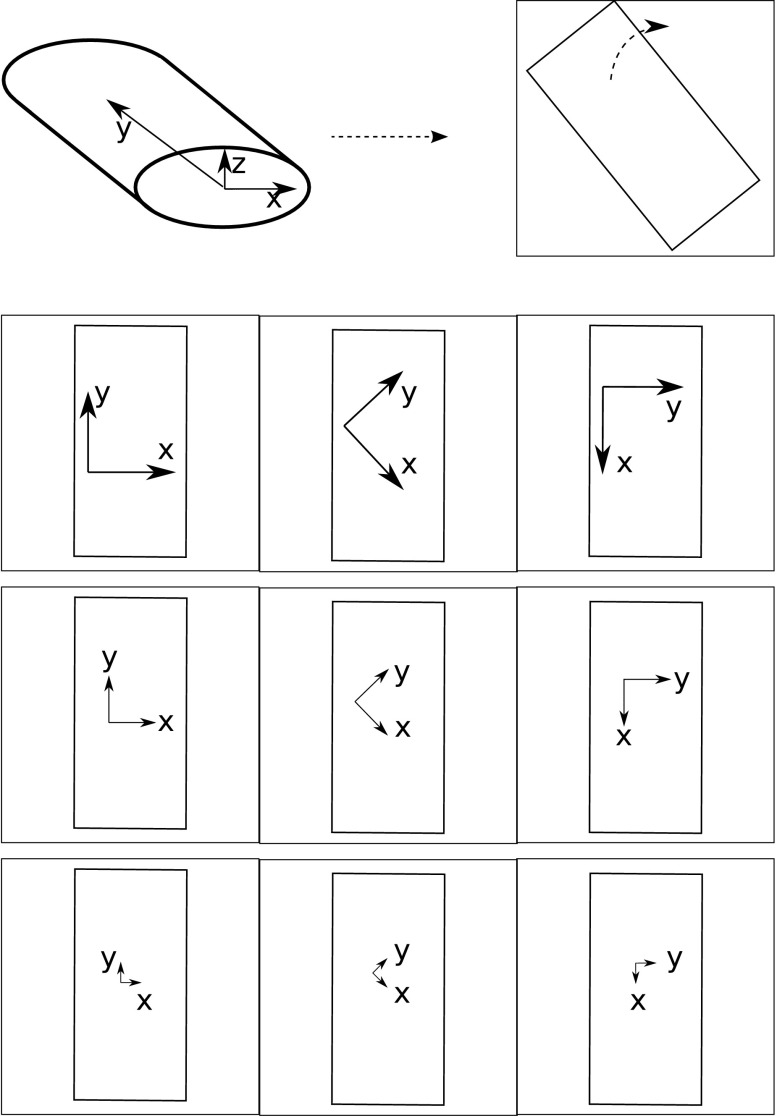
To determine the components of the diffusion tensor, the spatial and temporal aspects of RICS can be exploited. To get additional information on diffusion in anisotropic medium, we changed the angle of acquisition of confocal images (rotation angle in microscope software). By doing so, we changed the relationship between different spatial points and the delay of acquisition of the signal. Thus τ(R) was varied, and as a result, the autocorrelation relationship between fluctuations of fluorescence in different pixels varied as well. The method is illustrated in Fig. 1 for rat cardiomyocytes. Rat cardiomyocytes were considered as cylindrical symmetric cells. In those cells, we assumed that diffusion tensor principal axes were along and across the myofibril orientation. In the plane perpendicular to myofibril orientation, the transverse direction, the diffusion was assumed to be equal. Thus the diffusion tensor is given by two constants, one longitudinal (y-axis) and the other transverse (x and z axes). As shown in Fig. 1, all cardiomyocytes were first rotated by changing the angle of image acquisition so that the cells were aligned along the y axis. The images were then acquired with different relative rotation angle, stored, and analyzed.
Fig. 1.
Scheme showing the protocol of experiments on cardiomyocytes. Assuming that the cardiomyocyte has the shape of an elliptic cylinder (top left), the y-axis was defined as the longitudinal axis, the x-axis as the horizontal transverse axis, and the z-axis as the vertical transverse axis. Top right, the cell from above as viewed in the confocal microscope. Bottom panels describe acquisition of raster image correlation spectroscopy (RICS) images. First, the scanning field was rotated to orient the y-axis of the scanning field in parallel with the cell's longitudinal direction. This was defined as the position with an angle of 0°. A series of images was acquired at this position with a pixel size of 0.1116 μm. The scanning field was then rotated 45°, and a new series was acquired. The scanning field was then rotated again to a total of 90° so that the y-axis of the scanning field was parallel with the cell's transverse direction, and the last series was acquired. The acquisition at different angles was repeated at pixel sizes of 0.0558 and 0.0279 μm. This procedure was performed with 3 pixel dwell times: 25, 51, and 102 μs.
The autocorrelation function C computed from the images acquired from the microscope is different from G due to the noise of the system and other simplifications done in Eq. 1. Assuming that the noise (s) is the main component modifying the autocorrelation function and that it depends only on delay between pixels (τ), the following formula was used in this work:
 |
(4) |
where Δx is the distance between pixels along the fastest scanning direction of the laser (horizontal lines in images) and Δy is the distance between pixels in the direction perpendicular to x (distance between lines).
When not specified, the autocorrelation function analyzed in this work was normalized by the standard deviation of the fluorescence signal, i.e., C(0, 0). In our analysis, multiple (25–100) images were acquired with the same pixel size, dwell time, and scan rotation angle to calculate the autocorrelation function. When not specified otherwise, fluctuation of the fluorescence signal for each pixel was calculated relative to the average intensity of the pixels in the same position on all images. This allowed us to remove the influence of immobile intracellular structures on the autocorrelation function (7).
Confocal imaging.
Confocal images were acquired on an inverted confocal microscope (Zeiss LSM510 Duo) built around an Axio Observer Z1 with a ×63 water-immersion objective (1.2 NA) at room temperature. The signal was acquired via a high-voltage single photomultiplier tube (PMT) using 8-bit mode; the pinhole was set to one Airy disk. The imaging chamber consisted of a FlexiPERM silicone insert (Vivascience, Hanau, Germany) attached to a coverslip of 0.17 mm in thickness.
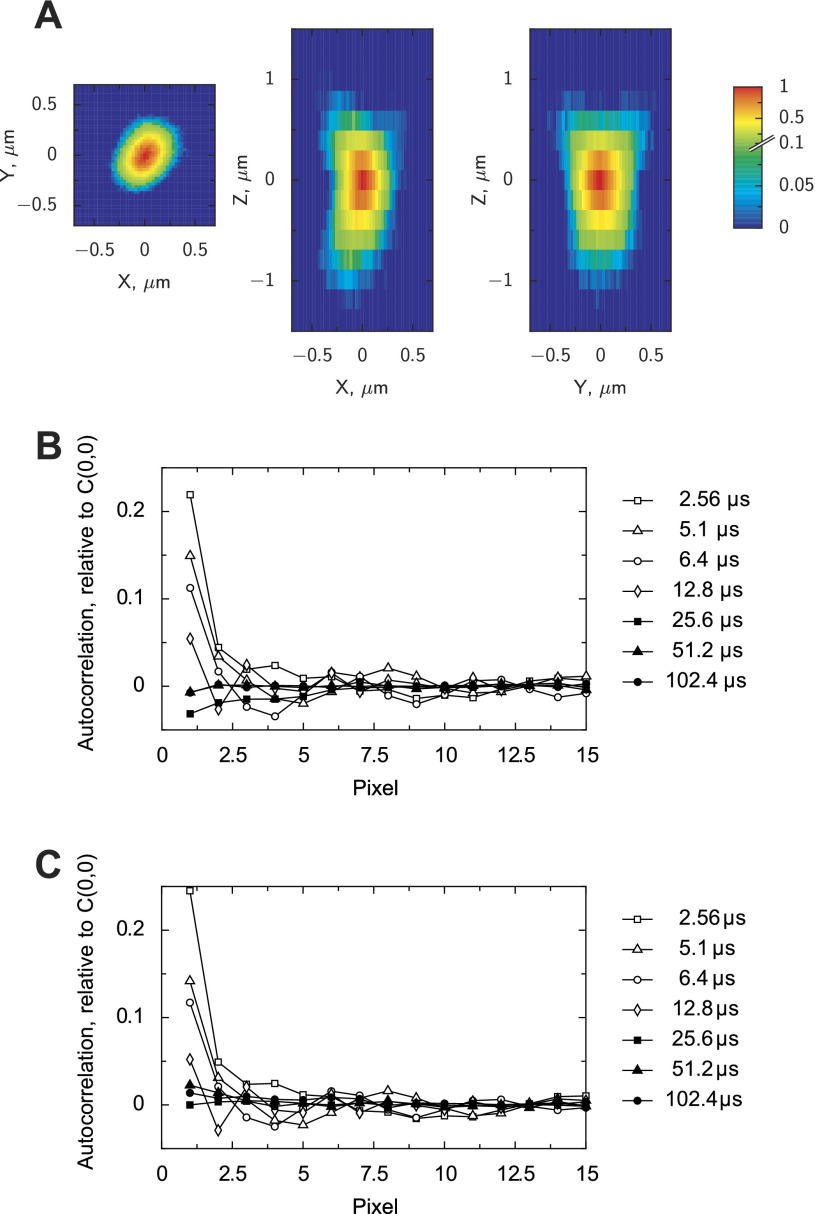
The microscope was characterized by measuring its PSF and determining the settings that would reduce the interference of acquisition noise and RICS analysis. To determine PSF, we used fluorescent microspheres with a diameter of 175 nm (540-nm excitation, 560-nm emission; PS-Speck, Molecular Probes, Invitrogen). The 3-D image stacks were acquired with several microspheres in focus, with the voxel size 0.027 × 0.027 × 0.191 μm. By averaging the intensity profiles acquired from different microspheres, we found the PSF of the system (Fig. 2A). This PSF was used in the analysis of the autocorrelation functions and in Brownian simulations of freely diffusing particles in three dimensions.
Fig. 2.
Characterization of the confocal microscope system used in this study, the Zeiss LSM510. Point spread function (PSF) measured using fluorescent beads is shown in A. The PSF is shown in the planes xy (z = 0 μm), xz (y = 0 μm), and yz (x = 0 μm). In B and C, the relative autocorrelation function is shown between pixels in the same line in the images recorded without laser illumination (B) or with illumination of pure water (C). Autocorrelation functions shown correspond to images acquired with pixel dwell times from 2.56 to 102.4 μs. Note that to avoid interference from the microscope, long pixel dwell times have to be used.
To estimate the noise component and find conditions where it is mainly influencing the standard deviation of the fluorescence signal [C(0, 0)], we recorded the series of images either without any illumination from the laser or from pure water with laser illumination. In both cases, the offset and gain of the PMT was adjusted so that the noise signal would be visible and there would be no pixels with either minimal or maximal intensity allowed by the image format. The autocorrelation functions determined for both cases are shown in Fig. 2, B and C. Similar to properties of the Olympus Fluoview 300 (5), the use of fast scanning speeds with small pixel dwell times led to strong autocorrelation between the neighboring pixels. To avoid such interference with the analysis of diffusion, we used images acquired with slow scan speeds (pixel dwell times larger than or equal to 25.6 μs).
For RICS analysis, timing information of image acquisition is needed. According to Zeiss, the signal is acquired during almost the full-pixel dwell time in the fast acquisition modes. For scan speeds slower than 6, three-fourths of pixel dwell time is used for recording the signal. The time between acquisition of the last pixel in the line and the first pixel in the next line (fly-back time) depends on the speed of imaging. For fast acquisition speeds, fly-back time is 1.34 times larger than the time for acquisition of a line. However, the maximal fly-back time is limited to 9.38 ms. This timing information was used in the analysis through τ(R).
RICS analysis was used to estimate the diffusion of fluorescent microspheres and Alexa 488 in water and of Alexa-ATP in solution and inside permeabilized cardiomyocytes. Irrespective of the preparation, the imaging protocol was the same. Confocal images with a resolution of 128 × 128 pixels were recorded in a single plane. Recordings were done at three different zooms of 10, 20, and 40, resulting in pixel sizes of 0.1116, 0.0558, and 0.0279 μm, respectively. At each zoom setting, the pixel dwell time was varied among 25.6, 51.2, and 102.4 μs. For each of these nine settings, we rotated the scanning field to record images at three different angles: 0°, 45°, and 90° (Fig. 1). This gave a total of 27 settings at which a series of 25–100 images were recorded.
The recordings of fluorescent dyes suspended in water and solution were straightforward. The recordings in rat cardiomyocytes were performed as follows. First, cardiomyocytes were suspended in 200 μl of measurement solution containing ∼0.25 μM Alexa-ATP. When saponin (50 μg/ml) was added to permeabilize the sarcolemma, Alexa-ATP diffused into the cell cytosol. As has been shown previously, saponin skinning leaves the cellular structure well preserved (22). For each cardiomyocyte, the scanning field was rotated so that the cell was positioned vertically in the field of view. Before the images were recorded for RICS analysis, imaging of mitochondrial autofluorescence with the 488-laser line ensured that the plane of scanning was inside the cell and in a region where mitochondria were organized in a highly ordered, crystal-like pattern (3, 35). Thus regions around the nuclei, where mitochondria appear smaller and not as organized, were avoided. When an appropriate region was found, RICS recordings of Alexa-ATP diffusion were commenced.
Simulations.
Calculation of autocorrelation functions and estimation of diffusion coefficients were done using software programs written in C++ and Python. First, images from each acquired time series were extracted from Zeiss LSM format by ImageJ (2) to a directory with raw files using a LSM Reader plug-in. During this extraction, scanning parameters were taken from the Zeiss LSM file and saved in a text file in the same directory. Second, the extracted raw files were processed by our program to calculate two-dimensional autocorrelation function from the fluctuations of pixel intensities (first part of Eq. 4). The found autocorrelation function was stored for further analysis.
Since the pixel dwell times used in this work were rather long, we assumed that the noise interfered with the autocorrelation function only at the value C(0, 0). With this assumption, the autocorrelation functions were normalized by C(0, 0) and fitted by minimizing the residuals (Res) as follows:
 |
(5) |
where Cexp is the autocorrelation found from images obtained by the confocal microscope, G is calculated on the basis of the second part of Eq. 1, and α is a shot noise contribution that depends only on pixel dwell time tpixel. In this formula, the summation was performed over all autocorrelations considered in a particular fit. In this work, the fit was performed using autocorrelation functions determined for images acquired at different zooms (pixel sizes), pixel dwell times, and image orientation (rotation angles). Since the studied fluorescent probes were fast-moving ones and the pixel dwell time was rather large, only the autocorrelation between pixels in the same line was considered in this work, i.e., Δy = 0.
To fit the autocorrelation functions determined from acquired images, diffusion coefficient D (or diffusion tensor components Dx,z and Dy in the anisotropic case) and shot noise component contribution α (different for different pixel dwell times) were varied. In addition, experimentally determined PSF was scaled to improve the fits by taking into account the variation in microscope settings and differences in wavelength used to determine PSF and RICS acquisitions. The PSF scaling factor was the same in all directions and considered to be the same for all images used in the fit (independent of pixel time, dwell time, and image orientation). The PSF scaling factor was usually 1.2–1.3 in the experiments performed in this study. When autocorrelation functions were normalized by C(1, 0) (autocorrelation between neighboring pixels in the same line), the shot noise component was ignored (α = 0).
The integral required to find G was calculated using the experimentally determined PSF (W in Eq. 1). Within each voxel used to measure PSF, PSF was considered constant. With this assumption, the integration was replaced by summation over all possible voxel combinations with the contribution of other components found using analytical expression for an integral within a voxel derived by Maple (Maplesoft, Waterloo, Ontario, Canada). The minimization of residual Res was performed using the Levenberg-Marquardt algorithm (25).
For testing the method, Brownian simulations were performed. For that, a program was written that simulates the movement of particles in three dimensions using Gaussian probability distribution to find the coordinates of the particle after each time step. The particle step was determined by floating point pseudo-random number with the mean zero and standard deviation of  (component along the coordinate axis n). To generate a simulated confocal image, experimentally determined PSF was used as well as spatial and temporal information of the laser scanning of Zeiss LSM510. The generated images were analyzed the same way as experimental images to find autocorrelation functions.
Fitting and Brownian simulations were paralleled for use in an available computer cluster. On average, simulations were performed using ∼100 parallel processes.
Statistical analysis.
Values are means ± SD. A Welsh two-sample t-test was used to determine the significance of the differences between mean values of diffusion coefficients as well as mean values of ratios of diffusion coefficients using the statistical software package R (http://www.r-project.org).
RESULTS
We first describe the protocol of RICS that allowed us to determine the diffusion coefficient of fast-diffusing molecules. Since the confocal microscope used in our experiments required rather long pixel dwell times, the analysis was limited to correlation between pixels in the same line. The RICS protocol was tested first in isotropic Brownian motion simulations and in solution. We then demonstrated an extension of RICS that allowed us to determine diffusion coefficients in anisotropic media. This protocol was first tested in anisotropic Brownian motion simulations to verify that the method could be used to detect anisotropy. Finally, the extended RICS protocol was applied to determine and compare the overall diffusion coefficients of Alexa-ATP in solution and in cardiomyocytes.
Using RICS for fast-diffusing molecules.
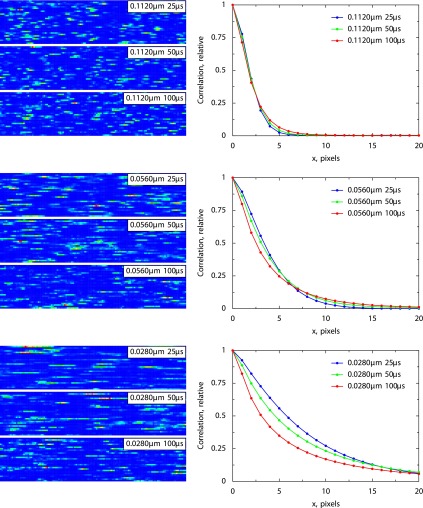
RICS is usually used with a single zoom (pixel size) and pixel dwell time. Since in our confocal microscope we had to use relatively long pixel dwell times (Fig. 2), the correlation between pixels in the different lines of the image was expected to be low for relatively fast-diffusing molecules. That is why our analysis was limited to autocorrelation between pixels in the same line of an image. To increase the number of data points, we acquired sets of image series with different pixel sizes and dwell times. To test the method, we performed Brownian simulations with freely diffusing point sources in 3-D space (Fig. 3). As shown, the variation of pixel size and dwell time modifies the autocorrelation function. By fitting simultaneously all obtained autocorrelation functions with the model, it is possible to estimate the diffusion coefficient.
Fig. 3.
Simulated pseudocolor images (left) and autocorrelation functions (right) of point sources moving in 3-dimensional (3-D) solution. The presented autocorrelation functions are calculated for signal originating from the same line in the image, i.e., zero Δy displacement. In the simulations, the diffusion coefficient was taken as equal to 50 μm2/s. The autocorrelation function is normalized by the standard deviation of the signal, or the value at Δx = Δy = 0. Note how changes in pixel size (indicated in μm) and pixel time (in μs) modify the images and corresponding autocorrelation functions.
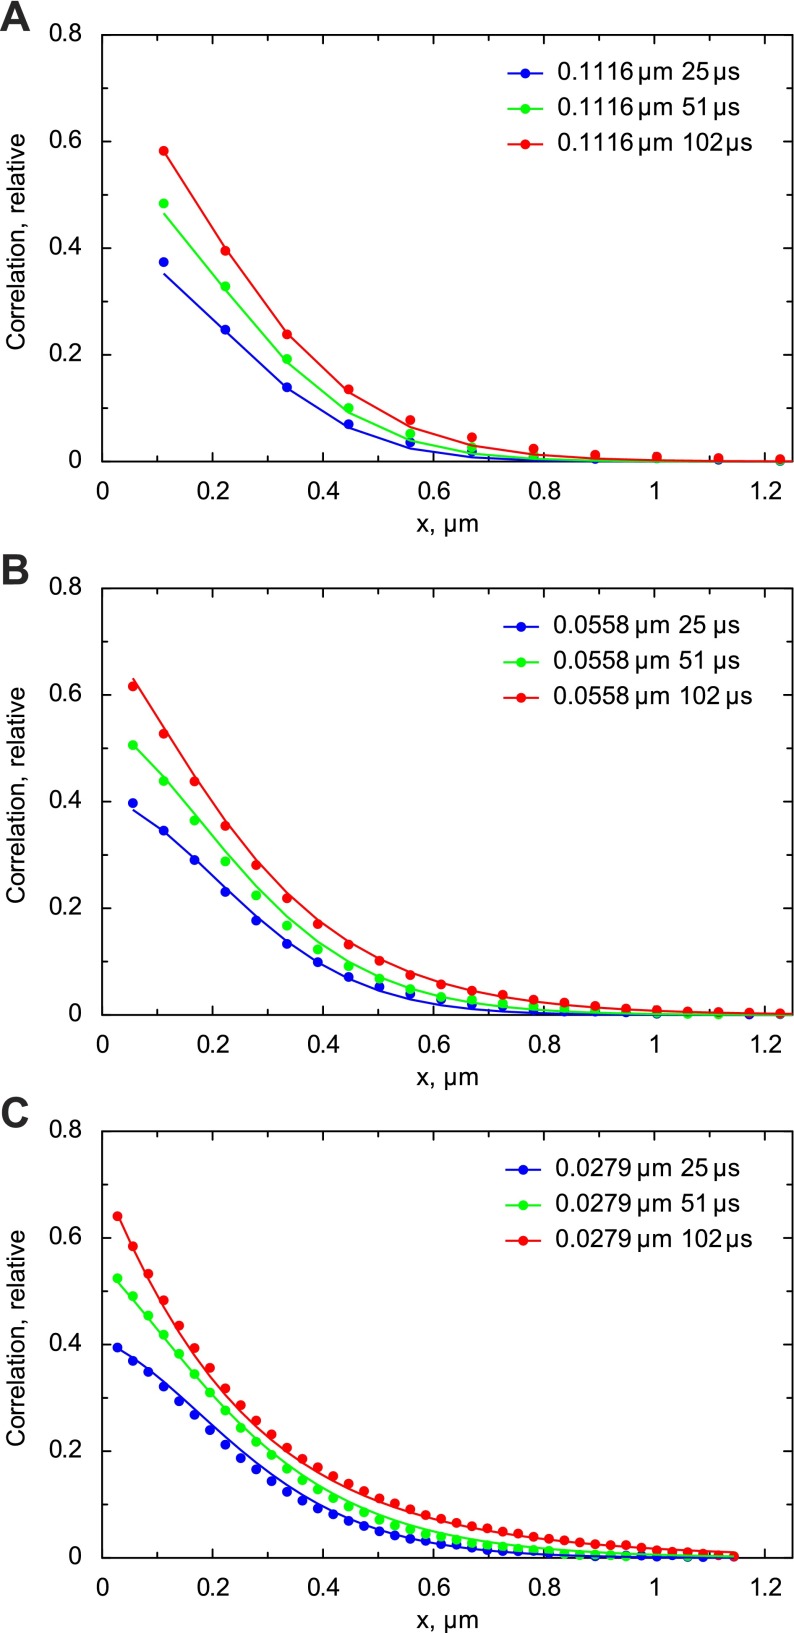
To verify the method for molecules with different diffusion speeds, we applied the RICS protocol to freely diffusing FluoSpheres and Alexa 488. The autocorrelation functions determined for FluoSpheres (actual size reported by Molecular Probes of 24 nm) are shown in Fig. 4. The shown autocorrelation functions were all normalized by the standard deviation of the signal, i.e., autocorrelation at x = y = 0. From the autocorrelation functions, it is clear that the shot noise contribution is different for different acquisition conditions. We assumed that the shot noise depends only on the pixel dwell time and not on the pixel size (see materials and methods, Eq. 5). Using three pixel dwell times, we were able to fit the determined autocorrelation functions (data points in Fig. 4) by the model (lines in Fig. 4) and obtain the estimate of the diffusion coefficient for FluoSpheres: 24.5 μm2/s. This estimate is slightly different from that based on the Stokes-Einstein formula. According to this formula, the diffusion coefficient of spheres with a diameter of 24 nm is 19 μm2/s (taking a water viscosity coefficient equal to 9.5 × 10⁻³ Pa·s). The same protocol was used to estimate the diffusion coefficient of Alexa 488. From the fit (not shown), we obtained the estimate of 273 μm2/s, which is close to the values reported previously: 240 μm2/s (26), 250 μm2/s (24), and 196 μm2/s (29). This shows that the method is reliable for estimating diffusion coefficients in the range of 20–300 μm2/s.
Fig. 4.
Experimentally determined autocorrelation functions for fluorospheres with a diameter of 24 nm. The autocorrelation functions shown were found for images obtained with different zooms (A–C; pixel sizes in μm) and different pixel times (in μs). By fitting the experimental data (data points) by the model solution (lines), the following estimations were obtained: a diffusion coefficient of 24.5 μm2/s and a relative contribution of shot noise equal to 0.60 (pixel time 25 μs), 0.46 (51 μs), and 0.29 (102 μs).
Using RICS for detection of anisotropy.
Since RICS relates the spatial and temporal fluorescence fluctuations, we used the spatial component of RICS analysis to determine diffusion anisotropy. For that, the angle of confocal image acquisition was changed and the autocorrelation functions corresponding to each angle were found. Cardiac cells, analyzed below, were assumed to have cylindrical symmetry induced by myofibrils with the diffusion coefficient different in the longitudinal and transverse directions. Thus, in those cells, diffusion can be characterized by two diffusion coefficients: one in the longitudinal and one in the transverse direction. For clarity, directions are marked as follows: x and z for the transverse directions and y for the longitudinal direction (Fig. 1). Because of the sedimentation of cardiac cells in the experiment, x and y are assumed to be in the confocal scanning plane and z is perpendicular to the scanning plane.
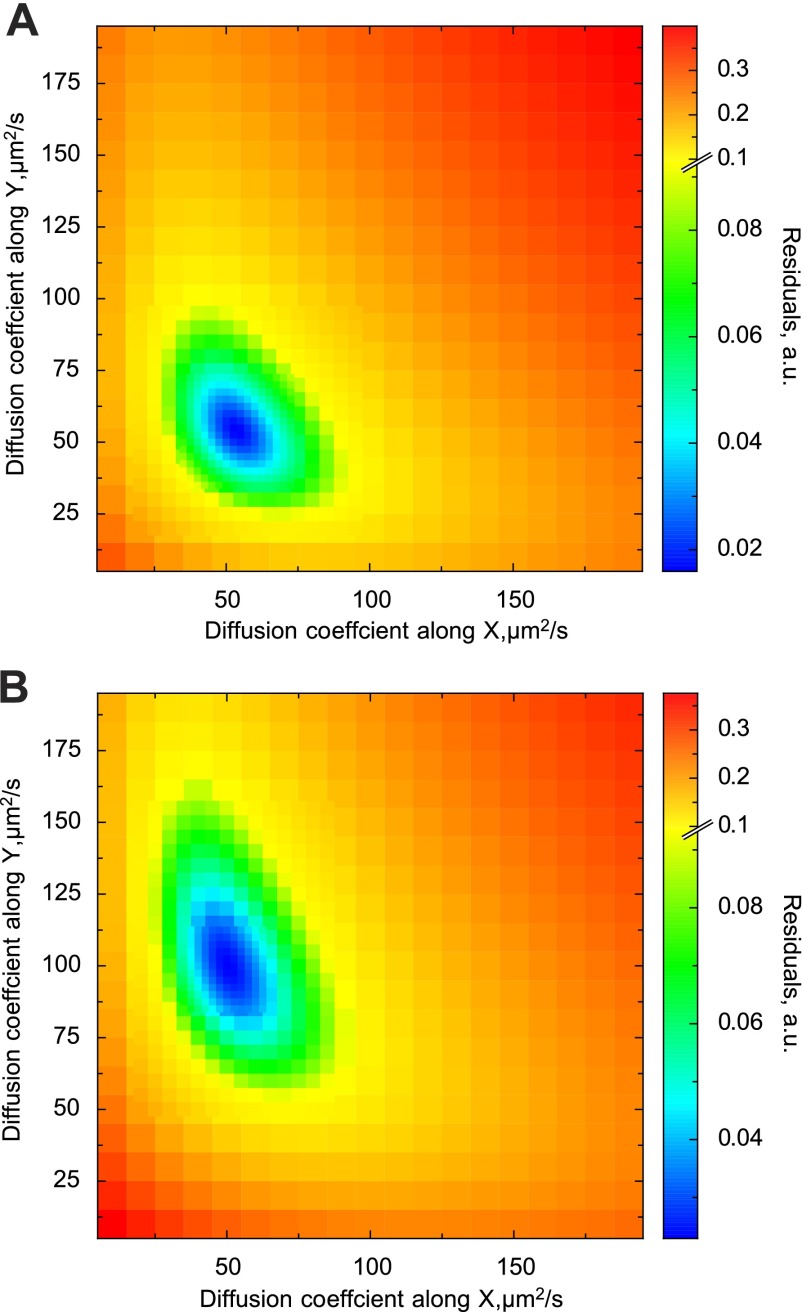
To illustrate the method, Brownian simulations with freely diffusing point sources in a 3-D anisotropic space are shown in Fig. 5. In those simulations, the diffusion coefficient along the y-axis was assumed to be two times larger than along the x and z axes, 100 and 50 μm2/s, respectively. By varying the image acquisition angle in the simulations, it is possible to move the laser scanning direction from the x-axis (angle 0°) to the y-axis (90°), as explained in the protocol for the experiments (Fig. 1). As a result, the autocorrelation functions change slightly due to anisotropy (Fig. 5). The change is small but significant. This is clear from the sensitivity analysis presented in Fig. 6. In Fig. 6, the autocorrelation functions found from stochastic simulations for isotropic (Fig. 3) and anisotropic (Fig. 5) cases were compared with the model solutions found using different combinations of diffusion coefficient values for the longitudinal (y-axis) and transverse directions (x and z axes, considered to have the same diffusion coefficient). The goodness of fit is presented by the sum of residuals (see materials and methods, Eq. 5). As is clear from Fig. 6, the regions with the best fits (blue) correspond well to the studied cases. In the isotropic case (Fig. 6A), the best fits were obtained with the diffusion coefficients in all directions similar to each other. In the anisotropic case (Fig. 6B), the region with the best fits clearly shifts toward the part of the diagram that corresponds to much a larger diffusion coefficient in the y direction than in the x and z direction.
Fig. 5.
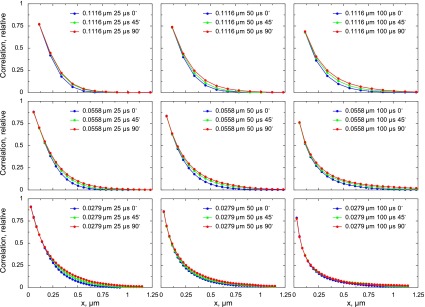
Autocorrelation functions of point sources moving in 3-D solution based on the simulations. In those simulations, the diffusion was assumed to be anisotropic with the diffusion coefficient equal to 50 μm2/s along the x- and z-axes and equal to 100 μm2/s along the y-axis. By rotating the image acquisition angle from 0° (direction of x-axis) to 90° (direction of y-axis), it is possible to identify the changes of autocorrelation functions induced by anisotropy. The autocorrelation functions were calculated for different pixel sizes (rows) and pixel times (columns).
Fig. 6.
Sensitivity analysis of the model solution based on the simulated movement of the particles. Autocorrelation functions obtained for isotropic (A; see Fig. 3) and anisotropic cases (B; see Fig. 5) were compared with the model solution. The model solution was obtained for different diffusion coefficient combinations, and the goodness of fit was assessed using the sum of residuals (see materials and methods, Eq. 5). Note that for the isotropic case, the best fit (blue area) is in the region where both the diffusion coefficients are close to each other. For the anisotropic case, the region with the best fit shifts significantly, indicating the difference in diffusion coefficients.
Alexa-ATP diffusion in solution.
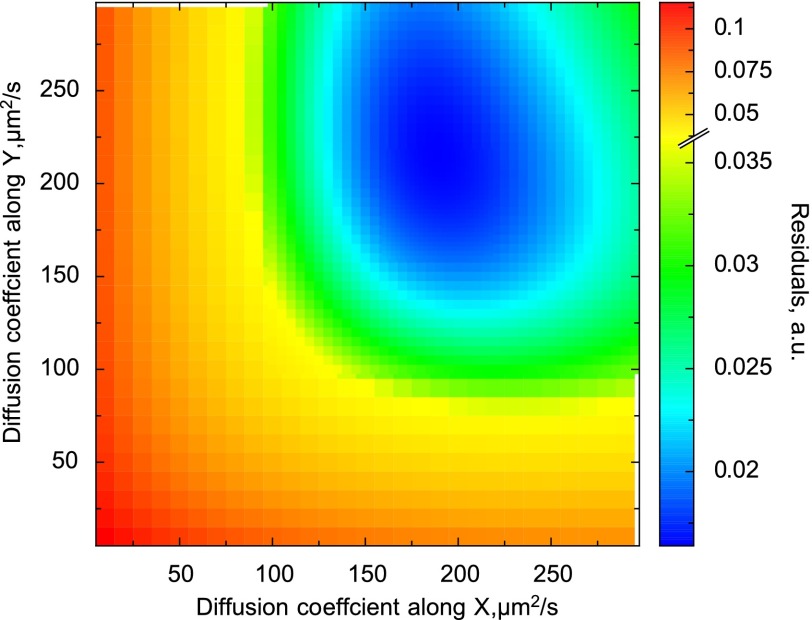
To test the method and determine the diffusion coefficient of Alexa-ATP in measurement solution, we acquired the confocal images of Alexa-ATP diffusing in solution. The autocorrelation functions corresponding to images acquired with the different image acquisition angles, pixel sizes, and dwell times are represented by data points in Fig. 7. As shown, the autocorrelation functions did not change significantly with the change of acquisition angle. When this particular experiment was fitted by the model (lines in Fig. 7), the estimated diffusion coefficient values were 189 and 217 μm2/s in the x and z direction and in the y direction, respectively. According to the sensitivity analysis (Fig. 8), although the region with the reasonable fits was relatively large, it was around the part of the diagram where diffusion coefficients were similar in all directions. When the estimations of diffusion coefficients from all performed experiments (n = 5) were analyzed statistically, the following values were obtained: the diffusion coefficient in the x and z direction (assumed to be equal) was 183 ± 27 μm2/s, and the diffusion coefficient in the y direction was 184 ± 24 μm2/s. The ratio of diffusion coefficients (y to x) was 1.01 ± 0.11. Thus, in the case of Alexa-ATP in measurement solution, the diffusion coefficients are the same (P > 0.95), as expected for an isometric medium.
Fig. 7.
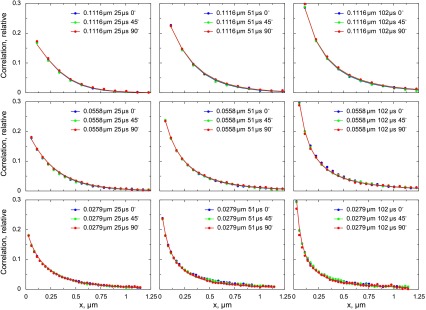
Autocorrelation functions calculated from confocal images of Alexa-ATP in measurement solution. The autocorrelation functions were calculated from images for different pixel sizes (rows), pixel times (columns), and different directions of the scan. Note that the change in direction does not influence the autocorrelation functions significantly, as expected in isotropic medium. The autocorrelation functions calculated from images (data points) were fitted by the model (lines), leading to the following estimation of diffusion coefficients: 189 μm2/s in x and z directions (grouped in the model) and 217 μm2/s in the y direction.
Fig. 8.
Sensitivity analysis of the fit obtained for Alexa-ATP in measurement solution (the fit is shown in Fig. 7). The residuals computed at different combinations of diffusion coefficients are shown. Note that the area with the smallest residuals is in the range where diffusion coefficients are similar for all directions.
Alexa-ATP diffusion in cardiomyocytes.
Figure 9A shows a representative transmission image of isolated rat cardiomyocytes. An illustrative confocal image of Alexa-ATP with nonpermeabilized cardiomyocytes is shown in Fig. 9B. As shown in this confocal image, Alexa-ATP cannot enter the cell with the intact sarcolemma. The cells were permeabilized in the measurement chamber by the addition of saponin. After saponin was added, Alexa-ATP entered the cell and we were able to record the images required for RICS analysis. A representative image is shown in Fig. 9C, with the image taken in the center of the cardiomyocyte. There is a slightly uneven pattern visible in Fig. 9C that is probably induced by intracellular organelles, such as mitochondria. This pattern also is visible in the autocorrelation function, when correlation between pixels in different image lines was found (Fig. 9D). As shown previously (7), this pattern disappears if the average intensity of each pixel in the series of images is taken into account (Fig. 9E). In all our analyses presented below, such correction has been applied.
Fig. 9.
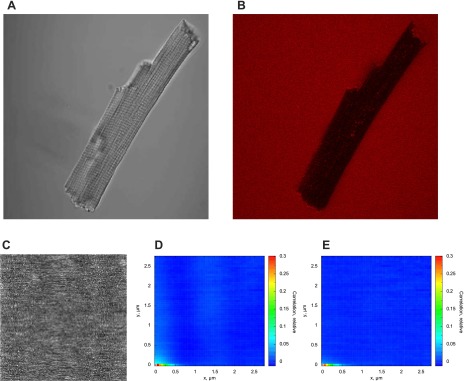
Representative images showing the different stages of the experiment and its analysis. An example transmission image of a cardiomyocyte (A) and a confocal image of the cardiomyocyte with Alexa-ATP added to the solution (B) before permeabilization of the cells by saponin. Note that before the addition of saponin, Alexa-ATP is mainly visible outside the cell and in long stripes within the cell, presumably t tubules. C: a confocal image of Alexa-ATP acquired for RICS analysis with a pixel size of 0.0558 μm and a pixel dwell time of 51 μs. The autocorrelation function calculated from the series of images acquired in the same conditions as C is shown before (D) and after (E) correction for average intensity in each pixel. Note that after the correction for average intensity of each pixel, the autocorrelation is considerably reduced for the pixels at the different lines of the image (Δy > 0).
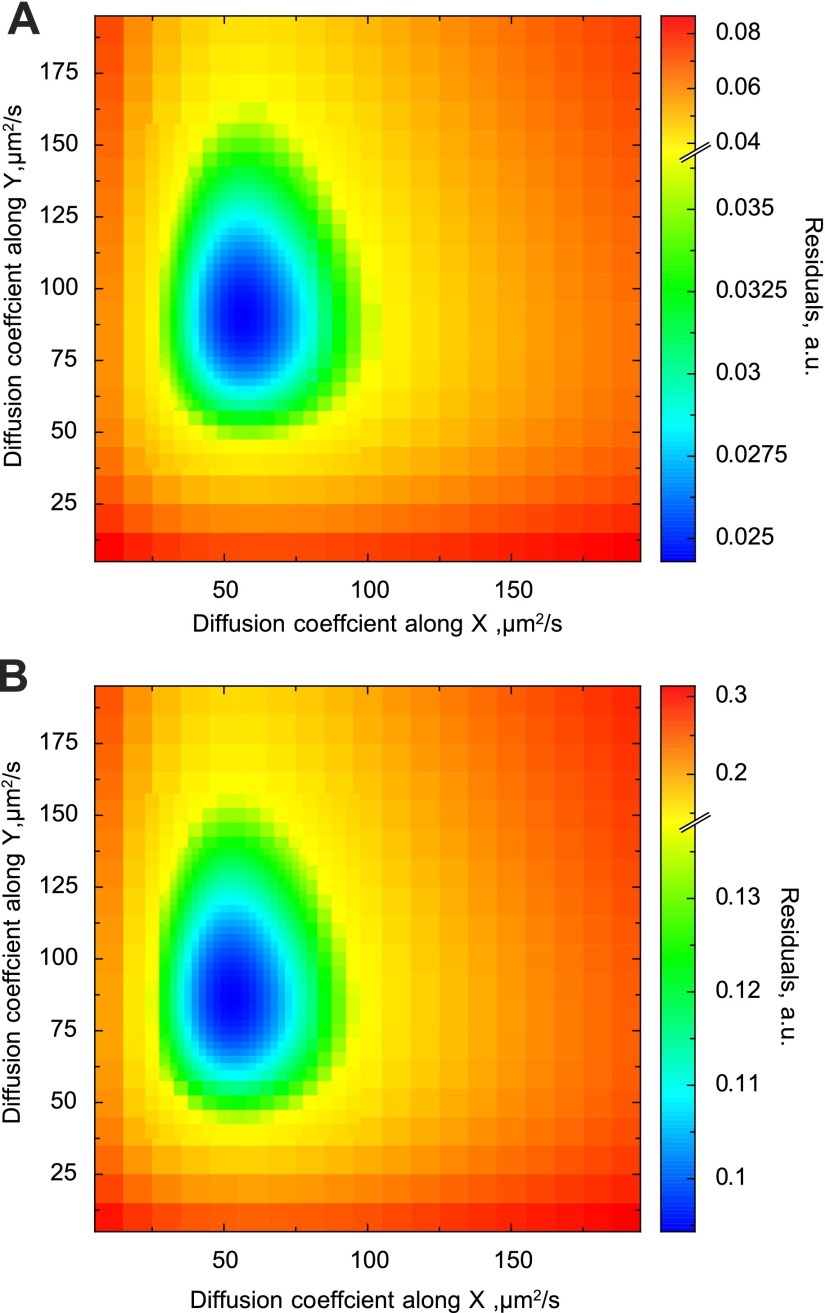
The analysis of the data acquired on one of the cardiomyocytes is shown in Fig. 10. The differences in autocorrelation functions induced by changes of the scanning direction were relatively small but, as shown below, significant. When the autocorrelation functions determined from experimental images were fitted by the model, the diffusion coefficient estimated for the longitudinal (y) direction was larger than for the transverse (x and z) direction. For the analysis shown in Fig. 10, the diffusion coefficient was 91 μm2/s in the longitudinal and 57 μm2/s in the transverse direction. To test whether possible changes in shot noise during the experiment would influence the model fit, we normalized the autocorrelation functions by autocorrelation between two neighboring pixels, i.e., C(1, 0). The corresponding autocorrelation functions determined from the experiment and the fit are shown in Fig. 11. In this case, the model fitted the experiment with slightly different diffusion coefficient values: 86 μm2/s in the longitudinal and 53 μm2/s in the transverse direction. Regardless of normalization, the sensitivity analysis of the fit (Fig. 12) clearly shows that the smallest residuals (the best fit) are in the region that corresponds to the diffusion coefficients being unequal in the longitudinal and transverse directions. Compared with the diffusion coefficients determined for Alexa-ATP in measurement solution, the diffusion coefficients in cardiomyocytes are considerably smaller (compare Figs. 8 and 12).
Fig. 10.
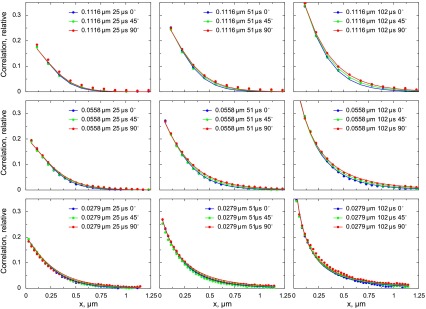
Autocorrelation functions calculated from confocal images of Alexa-ATP in permeabilized cardiomyocytes. The autocorrelation functions were calculated from images for different pixel sizes (rows), pixel times (columns), and different directions of the scan. Note that the change in direction induces a small variation in the autocorrelation functions. The autocorrelation functions calculated from images (data points) were fitted by the model (lines), leading to the following estimation of diffusion coefficients: 57 μm2/s in x and z (transverse) directions and 91 μm2/s in the y (longitudinal) direction.
Fig. 11.
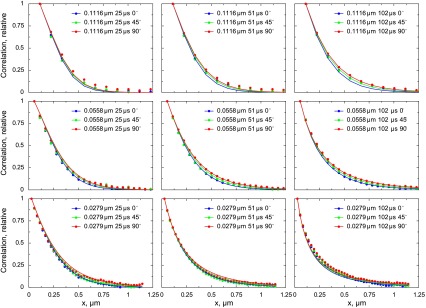
Same experiment as shown in Fig. 10 but with the normalization of autocorrelation functions by C(1, 0), i.e., autocorrelation between 2 neighboring pixels along the fast scanning direction on the image. Such normalization should reduce the influence of the changes in shot noise during the acquisition. As in Fig. 10, the model fit predicts anisotropic diffusion of Alexa-ATP in cardiomyocytes with diffusion coefficients equal to 53 μm2/s in the transverse direction and 86 μm2/s in the longitudinal direction.
Fig. 12.
Sensitivity analysis of the fit obtained for Alexa-ATP in cardiomyocytes. The analysis was performed for the fits in Figs. 10 (corresponding to subplot in A) and 11 (corresponding to the subplot in B). The residuals computed at different combinations of diffusion coefficients are shown. Note that the area with the smallest residuals is in the range where diffusion coefficients along the longitudinal direction (y-axis) are considerably larger than in the transverse direction (x-axis).
In the cardiomyocytes, the mean values for estimated diffusion coefficients were 83 ± 14 μm2/s in the longitudinal and 52 ± 16 μm2/s in the transverse direction (n = 8). This is true when the autocorrelation functions were normalized by the standard deviation of the pixel intensity [C(0, 0)]. With the use of a different normalization [C(1, 0)], the values of diffusion coefficients in cardiomyocytes were slightly larger. The data are summarized in Table 1. As shown, the diffusion coefficients were significantly different in solution and in the cell regardless of normalization. The same applies to the ratio of diffusion coefficients determining the anisotropy of diffusion. Whereas in solution, the ratio of diffusion coefficients in the longitudinal to transverse direction (arbitrary selection in case of solution) was close to one, in cardiomyocytes, the ratio was ∼1.7.
Table 1.
Diffusion constants derived from the raster image correlation spectroscopy at 22°C
 |
Values were obtained in water, measurement solution (solution), or cardiomyocytes. For Alexa-ATP, the diffusion coefficients derived for the longitudinal and transverse directions are shown as means ± SD. “Ratio” refers to the ratio of diffusion coefficients estimated for the longitudinal to the transverse direction (means ± SD). For measurement solution and cardiomyocytes, the analysis was performed with normalization of the autocorrelation function by C(0, 0) or C(1, 0), as explained in materials and methods (Eq. 5). C is shown depending on Δx (the distance between pixels along the fastest scanning direction of the laser) only, since in this work we considered the autocorrelation between pixels in the same line only. The difference between values determined for cardiomyocytes and solution were analyzed statistically using a t-test between the sets of data that were normalized the same way. *P < 0.01; †P < 0.001.
DISCUSSION
In this work, we extended the original RICS protocol to measure the diffusion coefficient tensor in anisotropic media. In addition, we used combinations of different pixel sizes and dwell times to increase the number of data points for better determination of diffusion coefficients of fast-diffusing molecules. As a result, we propose a practical method to determine the diffusion coefficient tensor of fluorescently labeled probes in anisotropic media. Whereas this method was developed to determine and compare the average diffusion of fluorescent ATP (Alexa-ATP) in solution and inside cardiomyocytes, its ease of use makes it a valuable tool for many future studies.
The main finding of this work is that the average diffusion of Alexa-ATP is anisotropic in rat cardiomyocytes. Compared with the value of the diffusion coefficient in measurement solution, the reduction of the diffusion coefficient in the longitudinal direction was 1.8–2.2 times. This is close to the reduction of the diffusion coefficient by a factor of two in frog muscles compared with the value in water (21). However, in the transverse direction, the reduction of the diffusion coefficient was more profound, 3.2–3.5 times smaller values than in measurement solution. This clearly demonstrates that diffusion of Alexa-ATP in rat cardiomyocytes is anisotropic.
Extending RICS to use in anisotropic media.
In this work, diffusion of rather small molecules was studied. As a result, there is a little chance that a molecule remains in the same area while the laser scans a line of a confocal image. Thus the autocorrelation between pixels in different lines is rather small, and the informative part of autocorrelation function is mainly reduced to autocorrelation between pixels in the same line of the image. Such an effect is further amplified in confocal microscopes that require relatively long pixel dwell times, such as the microscope used in this study (Fig. 2). To increase the number of informative data points, we acquired images at different combinations of pixel sizes and dwell times. By fitting all corresponding autocorrelation functions with the same parameters, an estimation of diffusion coefficient was obtained (method illustrated in Figs. 3 and 4). The estimated values for diffusion coefficients were either similar to the measurements by others (Alexa 488) or to the estimation based on the Stokes-Einstein formula (FluoSpheres). To our knowledge, there have been no estimations done for Alexa-ATP diffusion coefficient so far. The value we found (∼180 μm2/s) is a bit smaller than that of ∼250 μm2/s reported for Alexa 647 (39), as expected for Alexa 647-labeled ATP. Thus estimations of diffusion coefficients using multiple pixel sizes and dwell times were close to the expected ones, indicating that it is possible to use confocal microscopes with relatively long pixel dwell times to determine the diffusion coefficient of fast-diffusing molecules in practice.
The extension of RICS that allowed us to study diffusion in anisotropic media is based on the fact that RICS relates spatial and temporal information in the analysis (5, 7, 8). Such a relationship between spatial and temporal fluctuations gives RICS a great advantage compared with the classic FCS. By modifying the direction of the laser scan, we altered the relationship between spatial and temporal fluctuations. This allowed us to relate autocorrelation functions recorded with direction of the scan and to discriminate the differences in diffusion coefficients in different directions. To reduce the number of parameters, we assumed that the principal axes of diffusion tensor were aligned along and perpendicular to myofilament direction with the diffusion coefficient values in the transverse direction (x and z) equal to each other. Although it may be possible to determine directions of some principal axes of diffusion tensor without such assumptions by performing more measurements, there is an important limitation in getting information from RICS analysis regarding diffusion in a direction that is perpendicular to the image plain (commonly referred to as the z direction). Namely, the focus of the objective is changed more slowly than the scanning point of the laser scanning confocal microscope. Unless the motion of slower molecules is studied, this limitation of the method requires assumption(s) regarding the diffusion coefficient in the z direction.
When the limitation described above does not impose problems, the extensions of RICS protocol we have proposed lead to a practical method for determination of diffusion coefficient in anisotropic media. Namely, it is possible to use RICS and its extension on the common commercial laser scanning microscopes without any specific hardware. Alternatively, one could use classic FCS with two focal points and try to cross-correlate the fluorescence fluctuations that have been measured simultaneously in each of the focuses. By changing the distance and direction between two focal points, it should be possible to find the diffusion tensor in anisotropic media, since there is a spatial and temporal component in the analyzed cross-correlation. However, the main problem in applying this method is the requirement for a dedicated setup that is far from trivial. As an alternative to the methods based on FCS, one could impose a gradient of fluorescence and study the properties of this gradient. One common way of imposing the gradient is to bleach the sample. However, in that case, 3-D analysis of the gradient would be required, leading to rather slow scans in the z direction and requiring the stability of the gradient. In the case of bleaching, one has to determine the 3-D bleaching effect. In practice, that would require bleaching to be induced by a separate laser scanner that keeps the bleached volume stable while the other laser scanner is performing confocal measurements of fluorescence distribution in 3-D. Although systems that allow simultaneous bleaching and scanning by two scanning heads are commercially available, it is impossible to bleach and record in the different focal planes simultaneously on such systems. As a result, a dedicated setup is needed if bleaching is used to determine diffusion tensor in anisotropic media and 3-D spatial distribution of bleaching volume is to be taken into account. As demonstrated in our work, the use of extended RICS protocols allows us to determine diffusion coefficients in anisotropic media relatively simply, and it is possible to apply the method on commercially available confocal scanning microscopes, allowing the simple adoption of the method in many imaging facilities.
Diffusion in rat cardiomyocytes.
In this work, we determined the average diffusion coefficient that was used to fit the data obtained for spatial fluctuations of fluorescence over the distance of ∼1 μm without discrimination of cellular regions. Thus our analysis gives overall reduction of diffusion coefficients in the rat cardiomyocytes. By recording in the sections of the cell that were populated by mitochondria and myofibrils, the estimated average diffusion coefficient should correspond to the part where the main intracellular fluxes of ATP and ADP are expected.
In our measurements, we have obtained a relatively large reduction in diffusion coefficient in the transverse direction compared with the value in solution. Usually, on the basis of measurements of several ions in frog skeletal muscle (21), the factor of two is considered common for such a reduction of diffusion coefficient. Intriguingly, measurements by Kushmerick and Podolsky (21) were done for ions diffusing along the fiber. This is consistent with our estimation of diffusion coefficient along the myofibril direction, which was reduced by a factor of two compared with the diffusion coefficient in solution. Since Kushmerick and Podolsky (21) cut the fiber in the transverse section and looked only in the longitudinal distribution of radioactive labeling, the diffusion coefficients in the transverse directions were left undetermined in that work.
A reduction of diffusion coefficient by a factor larger than two has been reported for the molecules that bind to the proteins. For example, in analysis of diffusion of fura-2 and indo-1 by bleaching, the considerably larger reduction of diffusion coefficient was explained by protein binding of the fluorescent calcium indicators (4). In this work, we used Alexa-ATP in solution, which contained ∼10,000-fold larger concentration of ATP. Without ATP, Alexa-ATP was found to bind strongly to intracellular structures associated with myofibrils (results not shown). However, such an effect was abolished with the use of ATP in solution. Although Alexa-ATP has been found to get into some mitochondria and accumulate in the nucleus after permeabilization of cardiomyocytes with saponin, the binding to the proteins in solution with physiological ATP concentration was probably minor. This is supported by the fact that the diffusion coefficient in the longitudinal direction was consistent with the values expected for nonbinding ions (4, 21). Thus the reductions of diffusion coefficient in the transverse direction are probably induced by the specific organization of the cells, not protein binding.
There have been mixed results regarding anisotropy of diffusion in muscle cells. The dependence of diffusion on direction has been studied earlier using fluorescence recovery after photobleaching (28). In that study (28), diffusion of fluorescently labeled myoglobin, lactalbumin, and ovalbumin was analyzed in isolated soleus fibers and cardiomyocytes. For all those proteins, diffusion coefficients in lateral and transverse directions were found to be the same. The diffusion coefficient was found to be anisotropic for intracellular water with the use of NMR techniques (6). The anisotropy in diffusion coefficient is an important part of contemporary NMR spectroscopy techniques (13, 27) and is used to determine fiber orientation in the heart (10), for example. Anisotropy also has been found when studying calcium waves in cardiomyocytes with the wave moving faster in the longitudinal than in the transverse direction (9). Our results, with profound anisotropy in diffusion coefficient values, are consistent with the results obtained for smaller molecules.
The source for anisotropy in diffusion coefficients of Alexa-ATP is not clear. One possible explanation for anisotropic diffusion coefficients is the anisotropic arrangement of diffusion obstacles, such as mitochondria, myofibrils, and sarcoplasmic reticulum, in the cells. This was considered the reason for anisotropic propagation of calcium waves in cardiomyocytes (9). Interesting conclusions have been obtained from the analysis of PCr and ATP diffusion by 31P-NMR diffusion spectroscopy measurements in muscle fibers of lobster (19) and in rat skeletal muscle (12). Namely, the estimation of transverse diffusion coefficient was dependent on diffusion time. On the basis of such time dependence, it was suggested that the diffusion of ATP and PCr is mainly restricted by intracellular structures with overall cylindrical orientation (12, 19), such as sarcoplasmic reticulum (19). In addition, rows of mitochondria form cylinders that also may restrict diffusion in the transverse direction (3). Similar to the findings by NMR diffusion spectroscopy, the existence of local diffusion restrictions has been suggested on the basis of our analysis of kinetic measurements of respiration performed on saponin-treated rat cardiomyocytes (36). According to our models, the functional interaction among mitochondria, sarcoplasmic reticulum, and myofibrils (14, 32, 34) can be interpreted by the existence of diffusion restrictions that isolate ATPases and mitochondria from the surrounding solution (30). When different diffusion restriction distributions were compared with each other, only the model that assumed local diffusion restrictions in the transverse direction was able to fit all acquired data (36).
Our results show that there is an anisotropy of diffusion in rat cardiomyocytes but do not provide evidence for the mechanism responsible for anisotropy. To find the source of anisotropy in rat cardiomyocytes, a series of further studies is needed. By using cells with different structural organization and determining the components of the diffusion tensor with the method proposed in this work, it should be possible to estimate the contribution of intracellular structures in restricting diffusion and making it anisotropic. For example, a study of diffusion in nonmuscle cells such as Chinese hamster ovary and human embryonic kidney cells would indicate the role of organized pattern induced by actin and myosin packing. The structurally remodeled cardiomyocytes isolated from hypertrophied and failing hearts would show the changes in intracellular diffusion in pathology. Finally, following the changes in diffusion tensor during the development of cardiomyocytes from neonatal to mature cells would show how the formation of intracellular organization affects the anisotropy of diffusion.
When interpreting our results, it has to be realized that we estimated the average diffusion coefficient for fluorescently labeled ATP, not for ATP itself. Indeed, the fluorescence of the studied molecule is required when estimating the diffusion coefficients on the basis of classic FCS or derived methods. Thus we were forced to use fluorescently labeled ATP (Alexa-ATP), which is a larger molecule than ATP. Furthermore, although based around ATP, interaction with intracellular proteins and structures can be different for ATP and Alexa-ATP. Thus we have to be careful when comparing the diffusion coefficients of ATP and Alexa-ATP. Nevertheless, the properties of diffusion of Alexa-ATP give information about the intracellular environment of cardiomyocytes.
The physiological implications of anisotropy in rat cardiomyocytes are not clear. According to our simulations, significant gradients of ADP start to form between adjacent mitochondria and myofibrils at apparent diffusion coefficients that are 20 times smaller than in water (37). Thus the found anisotropy would play a role on the communication between parts of the cell that are considerably separated from each other. As discussed above, the degree of anisotropy of diffusion in rat cardiomyocytes has been found to be different for different molecules. To determine the physiological implications of anisotropy, we have to find which molecules have an anisotropic diffusion tensor and which do not. Only then can the implications of anisotropy on the physiology of the cell be studied, and we will be able to analyze how anisotropy affects cell function. For diffusion of ATP and ADP, possible implications of anisotropic diffusion include facilitated transport of ATP and ADP along the cell. Thus mitochondria along the cell predominantly support each other, reducing the chance of formation of rigor along the cell. This is advantageous, because if part of a myofibril still has sufficient energy supply, it can be stretched by rigor formed in another part along the myofibril. In other words, the anisotropy would predominantly protect actomyosin that is connected in series, not in parallel, reducing the chance of overstretching actomyosin that is not in rigor.
Conclusions.
In conclusion, we have developed an extension of the RICS protocol that allows us to determine diffusion coefficients in anisotropic media. As a RICS protocol, the proposed extension allows the use of commercially available confocal scanning microscopes, making it a practical choice for determination of diffusion tensor in anisotropic cases. We applied the extended RICS protocol to determine diffusion coefficients in rat cardiomyocytes. We found that diffusion of fluorescently labeled ATP is anisotropic, with the diffusion considerably more restricted in the transverse than in the longitudinal direction.
GRANTS
This work was supported by Wellcome Trust Fellowship WT081755MA.
Acknowledgments
We thank Tuuli Käämbre and Peeter Sikk (National Institute of Chemical Physics and Biophysics, Tallinn, Estonia) for providing rat cardiomyocytes and discussions, Heiti Paves (Department of Gene Technology, Tallinn University of Technology) for discussions, Ardo Illaste (Institute of Cybernetics, Tallinn University of Technology) for modification of the ImageJ LSM-Reader plug-in, and Maire Peitel (Institute of Cybernetics, Tallinn University of Technology) for technical assistance.
The costs of publication of this article were defrayed in part by the payment of page charges. The article must therefore be hereby marked “advertisement” in accordance with 18 U.S.C. Section 1734 solely to indicate this fact.
REFERENCES
- 1.Abraham MR, Selivanov VA, Hodgson DM, Pucar D, Zingman LV, Wieringa B, Dzeja PP, Alekseev AE, Terzic A. Coupling of cell energetics with membrane metabolic sensing. Integrative signaling through creatine kinase phosphotransfer disrupted by M-CK gene knock-out. J Biol Chem 277: 24427–24434, 2002. [DOI] [PubMed] [Google Scholar]
- 2.Abramoff MD, Magelhaes P, Ram S. Image processing with ImageJ. Biophotonics Int 11: 36–42, 2004. [Google Scholar]
- 3.Birkedal R, Shiels HA, Vendelin M. Three-dimensional mitochondrial arrangement in ventricular myocytes: from chaos to order. Am J Physiol Cell Physiol 291: C1148–C1158, 2006. [DOI] [PubMed] [Google Scholar]
- 4.Blatter LA, Wier WG. Intracellular diffusion, binding, and compartmentalization of the fluorescent calcium indicators indo-1 and fura-2. Biophys J 58: 1491–1499, 1990. [DOI] [PMC free article] [PubMed] [Google Scholar]
- 5.Brown CM, Dalal RB, Hebert B, Digman MA, Horwitz AR, Gratton E. Raster image correlation spectroscopy (RICS) for measuring fast protein dynamics and concentrations with a commercial laser scanning confocal microscope. J Microsc 229: 78–91, 2008. [DOI] [PMC free article] [PubMed] [Google Scholar]
- 6.Cleveland GG, Chang DC, Hazlewood CF, Rorschach HE. Nuclear magnetic resonance measurement of skeletal muscle: anisotrophy of the diffusion coefficient of the intracellular water. Biophys J 16: 1043–1053, 1976. [DOI] [PMC free article] [PubMed] [Google Scholar]
- 7.Digman MA, Brown CM, Sengupta P, Wiseman PW, Horwitz AR, Gratton E. Measuring fast dynamics in solutions and cells with a laser scanning microscope. Biophys J 89: 1317–1327, 2005. [DOI] [PMC free article] [PubMed] [Google Scholar]
- 8.Digman MA, Sengupta P, Wiseman PW, Brown CM, Horwitz AR, Gratton E. Fluctuation correlation spectroscopy with a laser-scanning microscope: exploiting the hidden time structure. Biophys J 88: L33–L36, 2005. [DOI] [PMC free article] [PubMed] [Google Scholar]
- 9.Engel J, Fechner M, Sowerby AJ, Finch SA, Stier A. Anisotropic propagation of Ca2+ waves in isolated cardiomyocytes. Biophys J 66: 1756–1762, 1994. [DOI] [PMC free article] [PubMed] [Google Scholar]
- 10.Geerts L, Bovendeerd P, Nicolay K, Arts T. Characterization of the normal cardiac myofiber field in goat measured with MR-diffusion tensor imaging. Am J Physiol Heart Circ Physiol 283: H139–H145, 2002. [DOI] [PubMed] [Google Scholar]
- 11.Gennerich A, Schild D. Anisotropic diffusion in mitral cell dendrites revealed by fluorescence correlation spectroscopy. Biophys J 83: 510–522, 2002. [DOI] [PMC free article] [PubMed] [Google Scholar]
- 12.De Graaf RA, van Kranenburg A, Nicolay K. In vivo 31P-NMR diffusion spectroscopy of ATP and phosphocreatine in rat skeletal muscle. Biophys J 78: 1657–1664, 2000. [DOI] [PMC free article] [PubMed] [Google Scholar]
- 13.Jones DK, Horsfield MA, Simmons A. Optimal strategies for measuring diffusion in anisotropic systems by magnetic resonance imaging. Magn Reson Med 42: 515–525, 1999. [PubMed] [Google Scholar]
- 14.Kaasik A, Veksler V, Boehm E, Novotova M, Minajeva A, Ventura-Clapier R. Energetic crosstalk between organelles: architectural integration of energy production and utilization. Circ Res 89: 153–159, 2001. [DOI] [PubMed] [Google Scholar]
- 15.Kabakov AY Activation of KATP channels by Na/K pump in isolated cardiac myocytes and giant membrane patches. Biophys J 75: 2858–2867, 1998. [DOI] [PMC free article] [PubMed] [Google Scholar]
- 16.Kay L, Daneshrad Z, Saks VA, Rossi A. Alteration in the control of mitochondrial respiration by outer mitochondrial membrane and creatine during heart preservation. Cardiovasc Res 34: 547–556, 1997. [DOI] [PubMed] [Google Scholar]
- 17.Kay L, Li Z, Mericskay M, Olivares J, Tranqui L, Fontaine E, Tiivel T, Sikk P, Kaambre T, Samuel JL, Rappaport L, Usson Y, Leverve X, Paulin D, Saks VA. Study of regulation of mitochondrial respiration in vivo: an analysis of influence of ADP diffusion and possible role of cytoskeleton. Biochim Biophys Acta 1322: 41–59, 1997. [DOI] [PubMed] [Google Scholar]
- 18.Kay L, Saks VA, Rossi A. Early alteration of the control of mitochondrial function in myocardial ischemia. J Mol Cell Cardiol 29: 3399–3411, 1997. [DOI] [PubMed] [Google Scholar]
- 19.Kinsey ST, Moerland TS. Metabolite diffusion in giant muscle fibers of the spiny lobster Panulirus argus. J Exp Biol 205: 3377–3386, 2002. [DOI] [PubMed] [Google Scholar]
- 20.Kümmel L Ca,Mg-ATPase activity of permeabilized rat heart cells and its functional coupling to oxidative phosphorylation of the cells. Cardiovasc Res 22: 359–367, 1988. [DOI] [PubMed] [Google Scholar]
- 21.Kushmerick MJ, Podolsky RJ. Ionic mobility in muscle cells. Science 166: 1297–1298, 1969. [DOI] [PubMed] [Google Scholar]
- 22.Kuznetsov AV, Tiivel T, Sikk P, Kaambre T, Kay L, Daneshrad Z, Rossi A, Kadaja L, Peet N, Seppet E, Saks VA. Striking differences between the kinetics of regulation of respiration by ADP in slow-twitch and fast-twitch muscles in vivo. Eur J Biochem 241: 909–915, 1996. [DOI] [PubMed] [Google Scholar]
- 23.Leddy HA, Haider MA, Guilak F. Diffusional anisotropy in collagenous tissues: fluorescence imaging of continuous point photobleaching. Biophys J 91: 311–316, 2006. [DOI] [PMC free article] [PubMed] [Google Scholar]
- 24.Masuda A, Ushida K, Okamoto T. New fluorescence correlation spectroscopy enabling direct observation of spatiotemporal dependence of diffusion constants as an evidence of anomalous transport in extracellular matrices. Biophys J 88: 3584–3591, 2005. [DOI] [PMC free article] [PubMed] [Google Scholar]
- 25.Moré JJ, Sorensen DC, Hillstrom KE, Garbow BS. The MINPACK project. In: Sources and Development of Mathematical Software, edited by Cowell WJ. Englewood Cliffs, NJ: Prentice-Hall, 1984.
- 26.Módos K, Galántai R, Bárdos-Nagy I, Wachsmuth M, Tóth K, Fidy J, Langowski J. Maximum-entropy decomposition of fluorescence correlation spectroscopy data: application to liposome-human serum albumin association. Eur Biophys J 33: 59–67, 2004. [DOI] [PubMed] [Google Scholar]
- 27.Nicolay K, Braun KP, Graaf RA, Dijkhuizen RM, Kruiskamp MJ. Diffusion NMR spectroscopy. NMR Biomed 14: 94–111, 2001. [DOI] [PubMed] [Google Scholar]
- 28.Papadopoulos S, Endeward V, Revesz-Walker B, Jurgens KD, Gros G. Radial and longitudinal diffusion of myoglobin in single living heart and skeletal muscle cells. Proc Natl Acad Sci USA 98: 5904–5909, 2001. [DOI] [PMC free article] [PubMed] [Google Scholar]
- 29.Pristinski D, Kozlovskaya V, Sukhishvili SA. Fluorescence correlation spectroscopy studies of diffusion of a weak polyelectrolyte in aqueous solutions. J Chem Phys 122: 14907, 2005. [DOI] [PubMed] [Google Scholar]
- 30.Saks V, Kuznetsov A, Andrienko T, Usson Y, Appaix F, Guerrero K, Kaambre T, Sikk P, Lemba M, Vendelin M. Heterogeneity of ADP diffusion and regulation of respiration in cardiac cells. Biophys J 84: 3436–3456, 2003. [DOI] [PMC free article] [PubMed] [Google Scholar]
- 31.Saks VA, Belikova YO, Kuznetsov AV. In vivo regulation of mitochondrial respiration in cardiomyocytes: specific restrictions for intracellular diffusion of ADP. Biochim Biophys Acta 1074: 302–311, 1991. [DOI] [PubMed] [Google Scholar]
- 32.Saks VA, Kaambre T, Sikk P, Eimre M, Orlova E, Paju K, Piirsoo A, Appaix F, Kay L, Regitz-Zagrosek V, Fleck E, Seppet E. Intracellular energetic units in red muscle cells. Biochem J 356: 643–657, 2001. [DOI] [PMC free article] [PubMed] [Google Scholar]
- 33.Selivanov VA, Krause S, Roca J, Cascante M. Modeling of spatial metabolite distributions in the cardiac sarcomere. Biophys J 92: 3492–3500, 2007. [DOI] [PMC free article] [PubMed] [Google Scholar]
- 34.Seppet EK, Kaambre T, Sikk P, Tiivel T, Vija H, Tonkonogi M, Sahlin K, Kay L, Appaix F, Braun U, Eimre M, Saks VA. Functional complexes of mitochondria with Ca,MgATPases of myofibrils and sarcoplasmic reticulum in muscle cells. Biochim Biophys Acta 1504: 379–395, 2001. [DOI] [PubMed] [Google Scholar]
- 35.Vendelin M, Beraud N, Guerrero K, Andrienko T, Kuznetsov A, Olivares J, Kay L, Saks VA. Mitochondrial regular arrangement in muscle cells: a “crystal-like” pattern. Am J Physiol Cell Physiol 288: C757–C767, 2005. [DOI] [PubMed] [Google Scholar]
- 36.Vendelin M, Eimre M, Seppet E, Peet N, Andrienko T, Lemba M, Engelbrecht J, Seppet EK, Saks VA. Intracellular diffusion of adenosine phosphates is locally restricted in cardiac muscle. Mol Cell Biochem 256/257: 229–241, 2004. [DOI] [PubMed] [Google Scholar]
- 37.Vendelin M, Kongas O, Saks V. Regulation of mitochondrial respiration in heart cells analyzed by reaction-diffusion model of energy transfer. Am J Physiol Cell Physiol 278: C747–C764, 2000. [DOI] [PubMed] [Google Scholar]
- 38.Weiss JN, Korge P. The cytoplasm: no longer a well-mixed bag. Circ Res 89: 108–110, 2001. [PubMed] [Google Scholar]
- 39.Yin D, Lunt EJ, Barman A, Hawkins AR, Schmidt H. Microphotonic control of single molecule fluorescence correlation spectroscopy using planar optofluidics. Opt Express 15: 7290–7295, 2007. [DOI] [PubMed] [Google Scholar]


