

Abstract
Impairment of the normal spatiotemporal pattern of intracellular Ca2+ ([Ca2+]i) signaling, and in particular, the transition to an irreversible “Ca2+ overload” response, has been implicated in various pathophysiological states. In some diseases, including pancreatitis, oxidative stress has been suggested to mediate this Ca2+ overload and the associated cell injury. We have previously demonstrated that oxidative stress with hydrogen peroxide (H2O2) evokes a Ca2+ overload response and inhibition of plasma membrane Ca2+-ATPase (PMCA) in rat pancreatic acinar cells (Bruce JI and Elliott AC. Am J Physiol Cell Physiol 293: C938–C950, 2007). The aim of the present study was to further examine this oxidant-impaired inhibition of the PMCA, focusing on the role of the mitochondria. Using a [Ca2+]i clearance assay in which mitochondrial Ca2+ uptake was blocked with Ru-360, H2O2 (50 μM–1 mM) markedly inhibited the PMCA activity. This H2O2-induced inhibition of the PMCA correlated with mitochondrial depolarization (assessed using tetramethylrhodamine methylester fluorescence) but could occur without significant ATP depletion (assessed using Magnesium Green fluorescence). The H2O2-induced PMCA inhibition was sensitive to the mitochondrial permeability transition pore (mPTP) inhibitors, cyclosporin-A and bongkrekic acid. These data suggest that oxidant-induced opening of the mPTP and mitochondrial depolarization may lead to an inhibition of the PMCA that is independent of mitochondrial Ca2+ handling and ATP depletion, and we speculate that this may involve the release of a mitochondrial factor. Such a phenomenon may be responsible for the Ca2+ overload response, and for the transition between apoptotic and necrotic cell death thought to be important in many disease states.
Keywords: calcium overload, oxidative stress, pancreatitis
acute pancreatitis is a serious and often fatal inflammatory disease primarily of pancreatic acinar cells and leads to autodigestion of the pancreas (6, 50). The major function of pancreatic acinar cells is the exocytotic secretion of powerful digestive enzymes, prepackaged as inactive zymogens. Impairment of exocytosis and/or its regulatory control mechanisms can lead to intracellular activation of zymogens (55), triggering a cascade of cellular events that culminate in autodigestion. Although several predisposing factors for pancreatitis have been identified, the major ones being alcoholism and gallstones, the underlying pathology, particularly the cellular triggering event, remains controversial. However, an impairment of the normal pattern of intracellular calcium ([Ca2+]i) signaling, which controls exocytosis and/or the control of normal resting [Ca2+]i, has emerged in recent years as a possible unifying underlying mechanism (18). In particular, an irreversible increase in [Ca2+]i or “Ca2+ overload” has been shown to cause intracellular enzyme activation and is linked to the associated necrotic cell injury that is the hallmark of acute pancreatitis (50).
The transition between apoptotic and necrotic cell death has been suggested to be one of the most important features of acute pancreatitis, regardless of the causative agent or process (6). Apoptotic cell death is a carefully controlled event that leads to the “clean” dismantling of the cellular constituents and the ultimate removal of cell remnants by phagocytosis. In this respect, apoptosis in the pancreas can be protective, although in excess it can lead to the progressive loss of pancreatic tissue (and thus function) that is the hallmark of chronic pancreatitis (6). Necrosis, on the other hand, is a more uncontrolled event that leads to the “messy” and chaotic destruction of the cell, and it is characterized by vacuole formation, blebbing, and, ultimately, cell lysis. This leads to the release of potentially damaging cellular constituents, such as activated proteases, that can damage neighboring cells, resulting in a spiral of self-perpetuating tissue damage and inflammation. The Ca2+ overload response has been suggested to underlie this transition between apoptosis and necrosis (47) and thus represents an important mechanism in further understanding the pathology of acute pancreatitis.
Oxidative stress has been implicated in several models of acute and chronic pancreatitis and has been shown to induce both apoptosis and necrosis in pancreatic acinar cells (6). We have previously reported that increased oxidative stress (H2O2) profoundly altered the normal pattern of cholecystokinin (CCK)-evoked [Ca2+]i signaling and resulted in an irreversible Ca2+ overload response in an increasing proportion of cells as H2O2 concentration was increased (9). This H2O2-induced Ca2+ overload also corresponded to a marked inhibition of the plasma membrane Ca2+-ATPase (PMCA), suggesting that this may, at least in part, be responsible for the oxidant-induced Ca2+ overload response (9). The aim of the present study was to further explore the mechanism of this oxidant-impaired inactivation of the PMCA, focusing on the role of the mitochondria. The results show that the H2O2-induced inactivation of the PMCA correlates with mitochondrial depolarization, but it appears to be largely independent of mitochondrial Ca2+ handling and ATP depletion. Furthermore, H2O2-induced PMCA inactivation was sensitive to inhibitors of the mitochondrial permeability transition pore (mPTP), suggesting that a factor or factors released from the mitochondria may inhibit the PMCA. Such a phenomenon may be responsible for the irreversible nature of the Ca2+ overload response and thus for the transition between apoptotic and necrotic cell death that is thought to underlie the pathology of acute pancreatitis.
MATERIALS AND METHODS
Cell isolation.
Small clusters of pancreatic acinar cells were isolated by collagenase-digestion of the pancreas of Sprague-Dawley rats by the method previously described (11), using 800 units of collagenase-P per gram of tissue (Roche Diagnostics), 0.12 mg/ml soybean trypsin inhibitor (Sigma), and 1% (wt/vol) bovine serum albumin (BSA, Fraction V, Sigma) in a HEPES-buffered physiological saline solution (HEPES-PSS) (composition in mM: 137 Na+, 4.7 K+, 0.56 Mg2+, 1.28 Ca2+, 143.54 Cl−, 1 HPO42−, and 10 HEPES, with a pH of 7.4). Following digestion, cells were resuspended in HEPES-PSS containing 0.1% BSA and kept on ice until use. Animals were humanely killed by an approved method as set out in Schedule 1 of the UK Animals Scientific Procedures Act 1986 (Certificate of Designation No 50/2506).
Digital imaging of fura-2 fluorescence.
Cells were loaded with 4 μM fura-2-AM (Invitrogen, Paisley, UK) in HEPES-PSS for 30 min at room temperature. Dye-loaded cells were allowed to adhere to a glass coverslip that formed the base of a gravity-fed perfusion chamber, continually perfused with HEPES-PSS with automatic valves for rapid switching of solutions (Harvard Apparatus, Kent, UK). All fluorescence imaging experiments were performed using an identical microscope and imaging system as previously described (1, 9). Briefly, this comprised a Nikon TE2000S microscope equipped with a CoolSNAP HQ CCD camera (Roper Scientific Photometrics, Tucson, AZ), and Cairn monochromator (Cairn Research, Kent, UK) controlled by MetaFluor imaging software (Molecular Devices, Downington, PA). Background-subtracted 340-nm and 380-nm fluorescence images were captured using 3 × 3 binning at a rate of 0.2 Hz to prevent excessive photobleaching and phototoxicity. The fura-2 fluorescence was calibrated into “estimated” [Ca2+]i using the equation: [Ca2+]i = Kd(R − Rmin)/(Rmax − R)(SF380/SB380), where Kd is the fura-2 dissociation constant, R is any given 340/380 ratio value, SF380/SB380 is the ratio of fluorescence measured for Ca2+-free and Ca2+-bound fura-2, and Rmin and Rmax are the minimum and maximum ratio values following in situ calibration experiments (9). All experiments were carried out at room temperature (20–22°C).
Measurement of mitochondrial membrane potential.
Estimations of changes in mitochondrial membrane potential (ΔΨm) were made using the fluorescent dye tetramethylrhodamine methylester (TMRM), which accumulates in mitochondria driven by the highly negative inner mitochondrial membrane potential. Pancreatic acinar cells were preincubated with 100 nM TMRM for 15 min at 37°C, and 100 nM TMRM was added to all perfusion solutions during experiments. TMRM-loaded cells were excited with 545 ± 10 nm excitation light (50-ms exposure) at a rate of 0.2 Hz, and background-subtracted images were captured with no binning (to increase the spatial resolution) through a Fura/TRITC dual band dichroic (Chroma). Fluorescent signals from subcellular regions defined by high mitochondrial fluorescence were normalized to the average fluorescence from the initial 10 frames (expressed as F/F0). Other experimental details were similar to those previously described (56).
Indirect measure of intracellular ATP concentration using Magnesium Green.
The Mg2+-sensitive fluorescent dye, Magnesium Green (MgGreen), was used to measure cytosolic ATP depletion, as described in previous studies (19, 34, 39). This is based on the principle that almost all cytosolic ATP exists as MgATP, such that ATP depletion causes an increase in free Mg2+ concentration ([Mg2+]i). Since MgGreen has a Kd for Mg2+ of ∼0.9 mM, close to the resting [Mg2+]i, this makes MgGreen useful as an indirect indicator of ATP concentration changes around the physiological range (39). In cardiac myocytes, similar MgGreen measurements of ATP have been shown to be comparable to those obtained using NMR methods (44). Pancreatic acinar cells were incubated with 4 μM MgGreen for 30 min at room temperature and excited with 496 ± 10 nm excitation light (50-s exposure) at a rate of 0.1 Hz. Background-subtracted images were captured using 5 × 5 binning (to increase signal detection) through a FITC dichroic (Chroma). Cells were selected on the basis of moderate fluorescence (neither very bright nor very low) to exclude cells with poor dye loading (very low fluorescence) or “unhealthy” cells with low initial cytosolic [ATP] and hence high MgGreen fluorescence. Fluorescent signals were normalized as relative fluorescence from the initial 10 frames (F/F0).
Solutions.
In all imaging experiments, cells were perfused with a HEPES-PSS. Solutions containing H2O2 were made up fresh each day and were periodically assayed using a fluorimetric assay as described previously (9). For experiments with La3+ (1 mM) to block the PMCA, HPO42− ions were replaced with Cl− to prevent precipitation of La3+ salts. Stock solutions (1 mM) of Ru-360 (Calbiochem) were dissolved in deoxygenated water immediately before use.
Data analysis and experimental design.
In some experiments, an unpaired experimental design was used, whereby parameters such as normalized linear [Ca2+]i clearance rate (see results) were compared between groups of experiments (e.g., control versus treatment). Where appropriate, an unpaired Student's t-test or Mann-Whitney test was used to determine statistical significance. In other experiments, a paired experimental design was used, whereby clearance rate in the presence of a treatment was compared with a control clearance time course in the same cells and expressed as a percentage of control. In these experiments, a one-sample t-test was then used to determine statistical significance within a group and a Mann-Whitney test was used for comparisons between groups (see results). For any given parameter analyzed, an “experimental average response” was determined from several cells in a particular experiment. These values were in turn averaged to give the true overall average and are expressed in the text as means ± SE.
RESULTS
Validation of PMCA activity assay.
To test the effects of oxidative stress on PMCA activity, we used a modified in situ [Ca2+]i clearance assay. In this method, all other [Ca2+]i clearance pathways were inhibited and PMCA activity was effectively isolated, similar to our previous studies in pancreatic and parotid acinar cells (1, 9). Briefly, this technique involved depleting the ER Ca2+ stores with the sarco(endo)plasmic reticulum Ca2+-ATPase (SERCA) inhibitor, cyclopiazonic acid (CPA), in the absence of external Ca2+. This caused a small increase in [Ca2+]i, presumably due to leak from the ER, which then returned to around or slightly below the baseline [Ca2+]i, presumably due to Ca2+ extrusion by the PMCA. Readdition of external Ca2+ then caused a rapid increase in [Ca2+]i (9), due to store-operated Ca2+ entry (SOCE) (51), which then reached a plateau, presumably due to a balance of Ca2+ influx and Ca2+ efflux (Ref. 9 and Fig. 1). Subsequent removal of external Ca2+ caused a rapid clearance of [Ca2+]i, which was then used as a measure of PMCA activity (Ref. 9 and Fig. 1). In our previous study, readdition of “physiological” external Ca2+ (1.28 mM) led to a relatively small steady-state increase in [Ca2+]i of around 50–100 nM (9), due to either limited SOCE or high [Ca2+]i clearance activity. This therefore limited the measurement of clearance to a relatively low range of Ca2+ concentrations below 200 nM. To remedy this problem, in the current study, we modified the assay by adding back 20 mM external Ca2+, thereby increasing the driving force for Ca2+ entry and increasing [Ca2+]i to much higher steady-state levels (459 ± 67 nM, Fig. 1A). This allowed [Ca2+]i clearance, and thus PMCA activity, to be monitored over a large range of intracellular Ca2+ concentrations. [Ca2+]i clearance was quantified by fitting the falling phase of the clearance to a single exponential decay. This gave an average time constant (τ) of 59 ± 10 s (n = 5, 116 cells, Fig. 1A) in untreated control cells. In our previous study under similar conditions (i.e., when SERCA was inhibited), the major [Ca2+]i clearance pathway was found to be the PMCA. The basis of this conclusion was that the PMCA inhibitor, La3+ (1 mM), almost completely inhibited [Ca2+]i clearance, while preincubation with the specific mitochondrial Ca2+ uptake inhibitor, Ru-360 (10 μM) (10, 36), had no significant effect (9). However, in the present study, since [Ca2+]i clearance was monitored over a greater range of Ca2+ concentration, mitochondrial Ca2+ uptake might be expected to have a much greater contribution, due to the low affinity and high capacity of the uptake process (17). This was therefore investigated further in the present study by preincubating cells with 10 μM Ru-360 for 30 min immediately before beginning the clearance assay. Under these conditions, the average time constant (τ) was 94 ± 11 s (n = 8, 134 cells, Fig. 1B), a marginally significant increase (P = 0.054) compared with untreated control cells. It was also noticeable that the rate of increase in [Ca2+]i was slowed, and the steady-state [Ca2+]i, following addition of 20 mM Ca2+, was significantly lower in Ru-360-treated cells (steady-state [Ca2+]i = 312 ± 27 nM) compared with untreated control cells ([Ca2+]i = 459 ± 67 nM, P < 0.01).
Fig. 1.
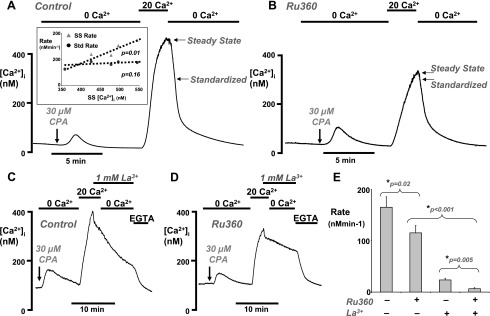
Validation of plasma membrane Ca2+-ATPase (PMCA) activity assay. A and B: representative traces showing the intracellular Ca2+ ([Ca2+]i) clearance assay (see results) in untreated fura-2-loaded pancreatic acinar cells (A) and cells treated with 10 μM Ru-360 for 30 min, to inhibit mitochondrial Ca2+ uptake (B). Cells were treated with 30 μM cyclopiazonic acid (CPA), as indicated by the arrow, in the absence of external Ca2+ (0 Ca2+) to deplete endoplasmic reticulum Ca2+. CPA was present in all solutions throughout the remainder of each experiment. [Ca2+]i clearance was initiated by the addition of 20 mM external Ca2+ (20 Ca2+), followed by the subsequent removal of external Ca2+ (0 Ca2+). Arrows represent the steady-state [Ca2+]i (see results) and the standardized [Ca2+]i (300 nM) from which the linear rate of [Ca2+]i clearance was measured (E). The inset in A represents the mean steady-state [Ca2+]i (SS [Ca2+]i) plotted against the mean linear clearance rate measured from the steady-state [Ca2+]i value (SS rate, gray triangles) or standardized 300 nM value (Std rate, black circles). There was a clear correlation between SS rate and SS [Ca2+]i (slope = 1.1 min−1, which was significantly different from zero; P = 0.01), but there was no such correlation between Std rate and SS [Ca2+]i (slope = 0.16 min−1, which was not significantly different from zero; P = 0.16). C and D: inhibition of PMCA activity with 1 mM La3+ in control (C) and Ru-360-treated cells (D). EGTA (1 mM) was used to remove the La3+ and restore PMCA activity. E: mean standardized linear [Ca2+]i clearance rate in untreated control cells (shown in A), compared with Ru-360-treated cells with or without La3+ (*statistical significance as assessed using an unpaired t-test).
Similar to our previous studies (9, 10), treatment with H2O2 (0.1–1 mM) slowed the clearance to such an extent that the rate could no longer be fitted to an exponential decay. Therefore, we adopted an alternative method of quantifying clearance by fitting the first 60 s of the clearance time course by linear regression (see arrow and steady state, Fig. 1, A and B). However, the steady-state [Ca2+]i varied markedly, even between control cells, but particularly following treatment with either H2O2 or mitochondrial inhibitors. Therefore, the data were standardized by measuring the linear clearance rate over a 60-s period from a starting value of 300 nM Ca2+ (see arrow and standardized, Fig. 1, A and B). This allowed direct comparisons to be made between control and treated cells and prevented the initial [Ca2+] from influencing the measured linear clearance rate. In untreated control cells, the mean steady-state clearance was 250 ± 44 nM/min, whereas the standardized clearance in the same cells was 165 ± 20 nM/min (n = 5, 116 cells, Fig. 1, A and E). This suggests that [Ca2+] influences the linear clearance rate, and, indeed, closer analysis revealed that there was a clear correlation between the mean steady-state [Ca2+]i and the mean linear clearance rate when measured at the steady-state [Ca2+]i (see triangles within inset of Fig. 1A, slope = 1.1 min−1, P < 0.01). This would be expected for clearance that follows a single exponential decay, viz. the linear rate is faster the higher the starting [Ca2+]i from which the rate was measured. However, if the mean linear rate of clearance measured at the standardized value of 300 nM [Ca2+]i was plotted against the same steady-state [Ca2+]i in the same cells, there was no significant correlation (see circles within inset of Fig. 1A, slope = 0.16 min−1, P = 0.16). This means that, on average, the linear clearance rate had slowed to approximately the same value by the time [Ca2+]i had reached 300 nM regardless of the steady-state [Ca2+]i the cell had attained. This suggests that prior exposure to high [Ca2+] does not differentially regulate [Ca2+]i clearance as would be expected if the PMCA exhibited memory, at least over the time course of the clearance assay.
Using this method of analysis it was found that, on average the standardized clearance rate in Ru-360-treated cells (115 ± 14 nM/min, n = 8, 96 cells, Fig. 1, B and E) was significantly less than untreated control cells (165 ± 20 nM/min, n = 5, 116 cells, P = 0.02, Fig. 1, A and E). This therefore suggests that when [Ca2+]i clearance is measured over a much greater concentration range, mitochondrial Ca2+ uptake contributes to clearance and is independent of the cells attaining a lower steady-state [Ca2+]i. However, under these conditions, the residual [Ca2+]i clearance in Ru-360-treated cells would suggest that the relative contribution of mitochondrial Ca2+ uptake is much less than the PMCA. This was tested further by adding the PMCA inhibitor La3+ (1 mM) at the steady-state [Ca2+]i before the removal of external Ca2+ to initiate clearance. La3+ inhibits Ca2+ influx with μM affinity and inhibits Ca2+ efflux with mM affinity (5, 48). Therefore, in control cells, addition of 1 mM La3+ caused an initial rapid decrease, presumably due to an immediate inhibition of Ca2+ entry (48), followed by an abrupt slowing of the rate of decrease of [Ca2+]i as La3+ accumulated to sufficiently high enough concentrations to inhibit the PMCA (Fig. 1C). The [Ca2+]i continued to slowly decline during the La3+ exposure at a constant low rate (25 ± 3 nM/min, n = 4, 38 cells; Fig. 1C and mean data in Fig. 1E). This slow La3+-insensitive clearance was unaffected by the subsequent removal of external Ca2+ (Fig. 1C) until EGTA (1 mM) was applied to chelate the La3+ from the cells, a treatment that restored PMCA activity. The La3+-insensitive [Ca2+]i clearance was presumably due to mitochondrial Ca2+ uptake, because it was greatly reduced in Ru-360-treated cells (8 ± 2 nM/min, n = 4, 52 cells; Fig. 1D and mean data in Fig. 1E, P = 0.004).
Collectively, these data provide convincing evidence that when [Ca2+]i is relatively high (200–500 nM), mitochondrial Ca2+ uptake as well as PMCA activity contributes to the measured [Ca2+]i clearance. Furthermore, Ru-360 effectively blocked this mitochondrial Ca2+ uptake, consistent with previous studies (9, 10, 36). Therefore, to prevent mitochondrial Ca2+ uptake (and thus any possible subsequent mitochondrial Ca2+ release) from contaminating the measured [Ca2+]i clearance and thus the assessment of PMCA activity, all subsequent experiments were performed in Ru-360-treated cells.
H2O2 inhibits the PMCA activity in the presence of mitochondrial Ca2+ uptake inhibitors.
We have previously demonstrated that either pretreatment or acute treatment of pancreatic acinar cells with H2O2 (>100 μM) inhibited the PMCA activity (9). However, it was necessary to further examine the effects of H2O2 using the modified [Ca2+]i clearance assay employed in the present study. When acutely applied 2–5 min before the addition of 20 mM external Ca2+, H2O2 was even more effective than in our previous study (9), causing a concentration-dependent inhibition and, ultimately, inactivation of the PMCA (Fig. 2). At 50 μM, H2O2 reduced the clearance rate from 115 ± 14 nM/min to 47 ± 10 nM/min (P = 0.001, n = 8, 96 cells), whereas 100 μM reduced the clearance to 22 ± 7 nM/min (P < 0.001, n = 5, 56 cells, Fig. 2). At 0.5 and 1 mM, H2O2 reduced the clearance to 26 ± 4 nM/min (P < 0.001, n = 6, 72 cells) and 23 ± 7 nM/min (P < 0.001, n = 5, 47 cells), respectively. It must be noted, however, that in many of the cells treated with 0.5 and 1 mM H2O2, clearance could not be measured from the standardized 300 nM, because the clearance slowed to such an extent that the [Ca2+]i rarely fell to this value. Rather than exclude these cells from analysis, linear clearance was measured from the steady-state [Ca2+]i, which was much above 300 nM. According to the data from untreated control cells, measurement of clearance from a higher steady-state [Ca2+]i value would result in a higher rate due to the nature of the exponential decay. However, in most cases, clearance slowed to such an extent that it resembled a linear rather than exponential relationship. Therefore, extrapolation of the rate to 300 nM would presumably be the same as if it were measured at the steady-state [Ca2+]i, thereby removing this confounding problem. In addition, in cells where [Ca2+]i exceeds 500 nM and the fura-2 ratio approaches the Rmax, the calibrated [Ca2+]i values become less reliable, which may contribute to the high variability of the computed clearance rates. Finally, many cells treated with high concentrations of H2O2 underwent rapid cell lysis, causing dye leakage (as indicated by the arrows in Fig. 2, D and E) and making quantification difficult. Nevertheless, these technical and analytical difficulties, if anything, are likely to underestimate the inhibitory effectiveness of high concentrations of H2O2 on PMCA activity. In conclusion, these data suggest that in the presence of mitochondrial Ca2+ uptake inhibitors (Ru-360), H2O2 substantially inhibited PMCA activity, even at the lowest concentration tested (50 μM), and completely inactivated the pump at higher concentrations (>100 μM).
Fig. 2.
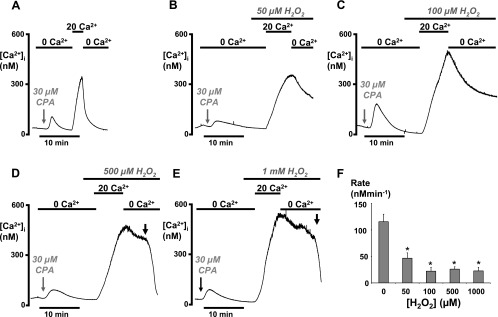
H2O2 (50–1,000 μM) inhibited PMCA activity under conditions in which mitochondrial Ca2+ uptake was inhibited. Pancreatic acinar cells were pretreated with 10 μM Ru-360 for 30 min, to inhibit mitochondrial Ca2+ uptake, immediately before the start of the [Ca2+]i clearance assay in all experiments. H2O2 was added 2–5 min before the addition of 20 mM external Ca2+. Representative traces show control cells (A) and the effects of 50 μM (B), 100 μM (C), 500 μM (D), and 1 mM (E) H2O2. Gray arrows indicate the point at which CPA was added, which was then present throughout the experiment. Black arrows in D and E show rapid loss of dye due to cell lysis. F: mean data showing the standardized linear [Ca2+]i clearance rate following treatment with varying concentrations of H2O2 (*P < 0.001, as assessed using an unpaired t-test).
It was also observed that the initial increase in [Ca2+]i following the addition of 20 mM external Ca2+ (Ca2+ repletion) was slower in the presence of H2O2 (Fig. 2, B–E) compared with control (Fig. 2A). This is classically believed to be a much better representation of store-operated Ca2+ entry (SOCE), compared with the steady-state [Ca2+]i. This is because the opposing contribution of Ca2+ clearance pathways (e.g., PMCA) will be minimal during this initial increase in [Ca2+]i but then begin to counter the Ca2+ entry as [Ca2+]i increases. This therefore slows the apparent rate of increase in [Ca2+]i until it reaches a new steady state where there is a balance between Ca2+ entry and Ca2+ efflux.
Effects of mitochondrial inhibitors on PMCA activity.
The mitochondria are central to the control of multiple cellular processes including many Ca2+ transport pathways (22) and are the major fuel source for ATP-consuming processes, including the PMCA. It is therefore possible that the PMCA has an intimate dependence on functional mitochondria. In addition, oxidants have been shown extensively to impair mitochondrial function (30, 54). We therefore examined the effects of three mechanistically distinct mitochondrial inhibitors to test if these have similar effects to H2O2. CCCP is a protonophore that dissipates proton gradients across organelle membranes, most notably the inner mitochondrial membrane. This causes rapid depolarization of the mitochondrial membrane potential (Ψm) and uncouples ATP synthesis from oxidative metabolism (22). Antimycin-A is an inhibitor of complex-III of the electron transport chain of mitochondria and therefore inhibits ATP synthesis (23). However, antimycin-A has also been shown to cause mitochondrial release of reactive oxygen species and to slowly depolarize Ψm (27, 43). Oligomycin is an inhibitor of the F1/F0-ATP synthase, which thereby inhibits ATP synthesis and is not known to affect Ψm (34). All these agents were added (similarly to H2O2 in previous experiments) 2–5 min before the addition of 20 mM Ca2+ (Fig. 3, B–D). CCCP (4 μM) and antimycin-A (0.5 μM) had very similar inhibitory effects on PMCA activity, significantly reducing [Ca2+]i clearance from 115 ± 14 nM/min to 58 ± 7 nM/min (P = 0.003, n = 7, 118 cells, Fig. 3, Bi, Bii, and E) and 51 ± 11 nM/min (P = 0.01, n = 5, 53 cells, Fig. 3, C and E), respectively. However, CCCP had variable effects when applied to cells following ER depletion with CPA in the absence of external Ca2+ before the addition of 20 mM Ca2+. In 60% of cells (n = 4, 71 cells), CCCP increased [Ca2+]i (Fig. 3Bi), whereas in the remaining 40% of cells (n = 3, 47 cells), CCCP had no effect (Fig. 3Bii). This suggests that CCCP may be causing mitochondrial Ca2+ release in 60% of cells; however, antimycin-A failed to have such an effect in any cell (Fig. 3C). This therefore suggests that CCCP may have nonspecific effects, such as dissipating proton gradients across other organelle membranes, that may facilitate Ca2+ leak. Oligomycin, on the other hand, had no significant effect on [Ca2+]i clearance (163 ± 14 nM/min, n = 7, 66 cells Fig. 3, D and E) compared with control (115 ± 14 nM/min, P = 0.09).
Fig. 3.
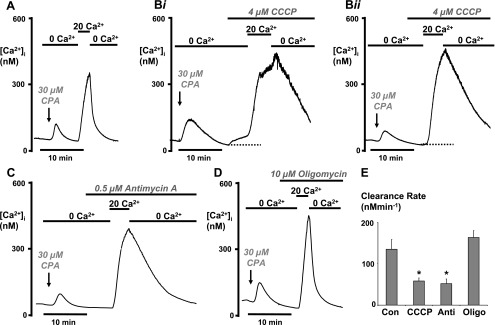
Antimycin-A and CCCP, but not oligomycin, inhibited PMCA activity. As in Figs. 1 and 2, cells were pretreated with Ru-360 (10 μM for 30 min) to inhibit mitochondrial Ca2+ uptake in all experiments. Representative traces show control cells (A) and the effects of 4 μM CCCP (Bi and Bii), 0.5 μM antimycin-A (C), and 10 μM oligomycin (D). Arrows indicate the point at which CPA was added, which was then present throughout the experiment. In 60% of cells, CCCP evoked an increase in [Ca2+]i when added in the absence of external Ca2+ (Bi) but had no effect in the remaining 40% of cells (Bii). E: mean data showing the standardized linear [Ca2+]i clearance rate following treatment with each mitochondrial inhibitor (*P < 0.05, as assessed using an unpaired t-test). Con, control; Anti, antimycin; Oligo, oligomycin.
Effects of H2O2 and mitochondrial inhibitors on ATP depletion.
Because of the intimate functional relationship between the mitochondria and the PMCA, it is tempting to speculate that H2O2-induced inhibition of the PMCA is due to ATP depletion. However, all the mitochondrial inhibitors used in the above experiments, including oligomycin, are likely to inhibit mitochondrial ATP synthesis regardless of mechanism. Therefore, to test this further, we measured ATP depletion indirectly using MgGreen, similar to previous studies (19, 34, 39). As a positive control, and to determine the maximum dynamic range of the dye, cells were treated with an “ATP-depletion” cocktail of 100 μM carbachol (CCh), 2 mM iodoacetate, and 10 μM oligomycin. CCh was used at a maximal concentration (100 μM) to rapidly increase [Ca2+]i, thereby activating Ca2+-ATPases (and presumably other Ca2+-dependent processes) that will likely consume ATP. Iodoacetate was used to inhibit glycolytic ATP production, while oligomycin inhibits mitochondrial ATP production (4). Addition of CCh, iodoacetate, or oligomycin alone is likely to deplete ATP only slightly, because either glycolysis or oxidative metabolism should be able to compensate and maintain cytosolic ATP. However, the combined use of all three reagents together is designed to rapidly and maximally deplete ATP, similar to previous studies (4). The effects of all other reagents (H2O2, antimycin-A, CCCP, and oligomycin) used singly were then compared with this maximum ATP depletion in an attempt to normalize the MgGreen responses.
Addition of the ATP-depletion cocktail caused a slow increase in MgGreen fluorescence (48 ± 4% F/F0, n = 7, 34 cells), with an average latency of ∼8 min (2–25 min range; Fig. 4A, black trace). In addition, the time to reach a maximum was highly variable between cells, ranging from 11 to 39 min (∼30 min on average). In some cells, there was a small but rapid spikelike increase in fluorescence as the ATP-depletion cocktail was applied that rapidly declined back to baseline levels before the slower secondary increase in fluorescence. This may have reflected an initial spikelike increase in [Ca2+]i caused by CCh, since MgGreen is sensitive to Ca2+, with a reported Kd of 4 μM (39), and CCh-evoked changes in [Ca2+]i are very likely to reach micromolar concentrations at the peak of the response. However, the slower Ca2+ overload-type response evoked by H2O2 (9) or by metabolic inhibition is only likely to reach submicromolar [Ca2+]i (500–700 nM) (9). Nevertheless, this was tested further by incubating cells with 10 μM BAPTA-AM for 30 min at room temperature. BAPTA-AM loads into the cells, similarly to fura-2, and rapidly buffers and thus markedly attenuates changes in [Ca2+]i (12). Consistent with our previous assertion, the slow increase in MgGreen fluorescence evoked by the ATP-depletion cocktail was unaffected by preincubation with BAPTA-AM (58 ± 4% F/F0; n = 9, 29 cells, Fig. 4A, gray trace) compared with control cells (52 ± 3% F/F0; n = 10, 42 cells, Fig. 4A, black trace). This was despite markedly attenuating the CCh-evoked [Ca2+]i response (240 ± 84 nM in BAPTA-loaded cells, n = 5, 22 cells) compared with control cells (1,088 ± 197 nM, n = 8, 38 cells). This therefore provides evidence that any contamination of the H2O2-evoked or ATP-depletion cocktail-evoked increase in MgGreen fluorescence by [Ca2+]i changes is likely to be minimal and thus represents a reliable readout of ATP depletion. Moreover, it was also noticed that a number of cells exhibited a rapid increase in MgGreen fluorescence followed by a rapid decline in fluorescence that fell well below the resting fluorescence (as indicated by gray arrow in Fig. 4A, inset). This is consistent with rapid dye loss and thus cell lysis. Therefore these cells were excluded from analysis. The increase in MgGreen fluorescence in these cells reached a plateau level that was well above the maximum reached in “healthy” cells, suggesting that in these cells the MgGreen fluorescence had reached saturation, possibly due to increased Mg2+ permeability that preceded total cell lysis. These results were broadly in line with experiments in cardiac myocytes (39).
Fig. 4.

Effects of H2O2, CCCP, antimycin, and oligomycin on ATP depletion (ATP-dep). Pancreatic acinar cells were loaded with 4 μM Magnesium Green (MgGreen) for 30 min at room temperature to indirectly measure cytosolic ATP concentration. Representative traces show the relative MgGreen fluorescence (F/F0; arbitrary units) in response to the “ATP depletion” cocktail with (gray trace) or without (black trace) preincubation with 10 μM BAPTA (A), 50 μM H2O2 (B), 500 μM H2O2 (C), 4 μM CCCP (D), 0.5 μM antimycin (E), and 10 μM oligomycin (F). The ATP depletion cocktail consisted of 100 μM carbachol (CCh), 10 μM oligomycin, and 2 mM iodoacetate and was used as a positive control to induce maximum ATP depletion. Cells that exhibited a rapid increase followed by a rapid decrease below the baseline fluorescence (see inset in A) were excluded from analysis because these likely represented cells undergoing cell lysis. Vertical bar represents 0.3 F/F0 and horizontal bar represents 5 min. G: mean data were quantified and normalized by expressing the change in F/F0 as a percentage of the ATP depletion cocktail response (*P < 0.05, as assessed using a one-sample t-test).
The effect of H2O2 or the mitochondrial inhibitors was quantified for each intervention by expressing the fluorescence change as a percentage of the maximum increase in MgGreen fluorescence evoked by the ATP-depletion cocktail (see Fig. 4). At the high concentration of 500 μM, which caused almost complete inactivation of the PMCA activity, H2O2 produced a significant increase in MgGreen fluorescence (16 ± 3% F/F0, n = 4, 12 cells, P < 0.05 one-sample t-test). However, this was still significantly less than that produced by the ATP-depletion cocktail (54 ± 5% of maximum cocktail response, P = 0.01, Fig. 4C). CCCP (4 μM) and antimycin-A (0.5 μM) also significantly increased the MgGreen fluorescence by 22 ± 6% (n = 4, 12 cells; P = 0.001, Fig. 4D) and 18 ± 6% (n = 4, 12 cells; P < 0.001, Fig. 4E) of the maximum cocktail response, respectively. Oligomycin (10 μM), which had no effect on PMCA activity (see Fig. 3D), also increased the MgGreen fluorescence by 18 ± 4% of the maximum ATP-depletion cocktail response (n = 6, 17 cells; P < 0.001, Fig. 4F). Furthermore, the lower concentration of H2O2 tested (50 μM), which also inhibited PMCA activity, had no significant effect on MgGreen fluorescence (2 ± 1% of maximum cocktail response, n = 4, 9 cells, Fig. 4B). These data therefore suggest that H2O2-induced inhibition of PMCA activity can occur independently of ATP depletion. Moreover, the ATP depletion caused by oligomycin, which was equivalent to CCCP and antimycin-A, did not inhibit PMCA activity.
Effects of H2O2 and mitochondrial inhibitors on mitochondrial membrane potential.
In an attempt to elucidate the mechanism of the effects of H2O2 and mitochondrial inhibitors on PMCA activity, we next tested the effects of all these agents on mitochondrial membrane potential (Ψm), using the membrane potential-sensitive fluorescent dye, TMRM, similar to previous studies (19, 27, 56). TMRM accumulates in the mitochondria based on the highly negative membrane potential and redistributes following depolarization. Following loading, TMRM fluorescence exhibited a punctate distribution consistent with mitochondrial accumulation (see image A associated with Fig. 5, A–F ; see also Refs. 19, 27, and 56). As expected, CCCP (4 μM) caused a rapid decrease in the relative TMRM fluorescence and the punctate fluorescence became rapidly diffuse (see image B, Fig. 5A). On average, CCCP rapidly decreased fluorescence by 47 ± 6% of the initial fluorescence (F/F0, n = 21, 123 cells). CCCP was therefore used as a positive control in TMRM experiments, and the subsequent effect of other reagents (H2O2, antimycin-A, and oligomycin) was quantified by normalizing them to the CCCP response. Antimycin-A (0.5 μM) caused a slow but substantial decrease in TMRM fluorescence to 68 ± 4% of the CCCP response (n = 6, 34 cells), which was significantly different when compared with corresponding time-matched control (8 ± 2%, n = 6, 84 cells, P < 0.001 as assessed by Mann-Whitney test). Over a minimum of 10 min exposure of antimycin-A, a corresponding loss of punctate TMRM fluorescence was also seen (see image B, Fig. 5B). However, oligomycin (10 μM) had no significant effect on TMRM fluorescence (7 ± 2%, n = 6, 28 cells), when compared to the time-matched control, nor did the drug affect the punctate distribution of TMRM fluorescence (see image B, Fig. 5C). H2O2 also caused a slow concentration-dependent decrease in TMRM fluorescence (50 μM = 35 ± 5%; n = 4, 56 cells; Fig. 5D and 500 μM = 53 ± 3%; n = 5, 36 cells, P < 0.001), which also corresponded to a loss of punctate TMRM fluorescence (image B, Fig. 5, D and E). These data suggest that CCCP rapidly depolarizes Ψm, while H2O2 and antimycin-A slowly depolarize the mitochondria and oligomycin had no effect on mitochondrial membrane potential in acinar cells.
Fig. 5.
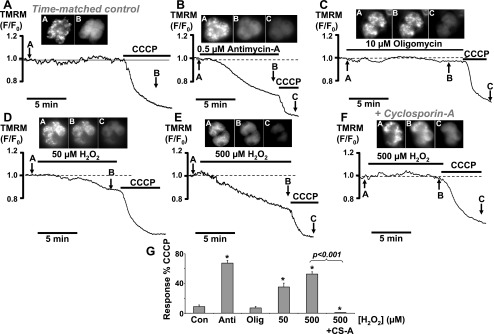
Effects of mitochondrial inhibitors and H2O2 on the mitochondrial membrane potential (ΔΨm). Representative traces show the relative tetramethylrhodamine methylester (TMRM) fluorescence (F/F0; arbitrary units) and corresponding TMRM fluorescent images of time-matched control (A) and cells treated with 0.5 μM antimycin-A (B), 10 μM oligomycin (C), 50 μM H2O2 (D), 500 μM H2O2 (E), and 500 μM H2O2 in the presence of 5 μM cyclosporin (F). A decrease in relative TMRM fluorescence represents mitochondrial depolarization. Inset images in A–C were taken at the corresponding points on the trace as indicated by the arrows. Image A from each experiment indicates a punctate TMRM fluorescence distribution consistent with mitochondrial staining, from which fluorescence changes were measured. In each experiment, 4 μM CCCP was used as a positive control to evoke maximum mitochondrial depolarization. G: mean data were quantified and normalized by expressing the change in F/F0 as a percentage of the CCCP response (*P < 0.05, as assessed using a Mann-Whitney test). CS-A, cyclosporin-A.
One possible explanation for the H2O2-induced mitochondrial depolarization is due to the opening of the mPTP. This was therefore tested using cyclosporin-A, which binds cyclophilin-D, a component of the mPTP, and has been shown to potently inhibit the mPTP (8). After preincubation of cells for 30 min and in the continued presence of 5 μM cyclosporin-A, the mitochondrial depolarization evoked by 500 μM H2O2 was completely abolished (1.5 ± 0.3% of the CCCP response), compared with the effect of 500 μM H2O2 alone (53 ± 3% of the CCCP response; P < 0.001). In fact, this was found to be statistically lower than that produced during time-matched controls (8 ± 2%, P = 0.03), suggesting that there may have been a slight hyperpolarization of the mitochondrial membrane potential. The data suggest that inhibition of the mPTP protects the mitochondria from oxidant-induced depolarization and support the idea that H2O2 mediates the opening of the mPTP.
Inhibition of the mPTP partially prevents the H2O2-induced inhibition of the PMCA.
So far, our data suggest that H2O2-evoked inhibition of PMCA activity correlates with mitochondrial depolarization but is unlikely to be due to mitochondrial Ca2+ handling or to ATP depletion. The opening of the mPTP has been shown to mediate the release of a variety of pro-apoptotic factors, such as cytochrome c, which then activate a cascade of apoptotic pathways (27, 40). It is therefore tempting to speculate that a similar mechanism may be responsible for the inhibition of the PMCA during H2O2 treatment. We tested this hypothesis using the mPTP inhibitor, cyclosporin-A (8), to determine whether this could protect the PMCA from inhibition by H2O2. Cylosporin-A was applied in combination with CPA at the beginning of the experiment and was then present throughout. In an attempt to improve the reproducibility, and reduce the variability of the clearance assay, we adopted a paired experimental design whereby an initial control [Ca2+]i clearance phase (R1, Fig. 6A) was compared with a second [Ca2+]i clearance phase (R2, Fig. 6A) during which the cells were exposed to H2O2 (see Fig. 6, B–D). The linear rate of [Ca2+]i clearance, measured from a starting Ca2+ of 300 nM (see dotted line, Fig. 6, B–D) as in previous experiments, was then normalized by expressing the second clearance rate as a percentage of the first (R2/R1 × 100%, Fig. 6E mean data), thus allowing each cell to act as its own control. Data using cyclosporin-A (Fig. 6C) were then compared with a time-matched control (Fig. 6A) and a positive control, whereby cells were treated with H2O2 during the second clearance phase in the absence of cyclosporin-A (Fig. 6B). The first observation from these data was that cyclosporin-A, when applied alone during the first clearance phase (see R1, Fig. 6C), did not significantly affect the clearance (τ = 86 ± 8 s; linear rate = 145 ± 33 nM/min, n = 5, 58 cells) as compared with the equivalent clearance phase (see R1, Fig. 6A) during the time-matched control (τ = 91 ± 9 s; linear rate = 137 nM/min ± 27, n = 5, 74 cells). This suggests that inhibition of the mPTP, which is thought to mediate mitochondrial Ca2+ release under certain conditions, has no effect on [Ca2+]i clearance under the conditions of these experiments (i.e., when mitochondrial Ca2+ uptake had been prevented with Ru-360). Second, during time-matched control experiments, the second clearance phase (R2, Fig. 6A) was not significantly different from the first clearance phase (R1, Fig. 6A; 101 ± 3% n = 5, 74 cells, as assessed by one-sample t-test), making this an ideal method for normalizing the data. Furthermore, analysis of these normalized data revealed that, as expected, H2O2 dramatically inhibited [Ca2+]i clearance to 15 ± 4% of the initial control clearance phase (Fig. 6B; n = 4, 59 cells; P < 0.001 as assessed by one-sample t-test) compared with the equivalent time-matched control (Fig. 6A; P < 0.001, as assessed by Mann-Whitney test). More importantly, however, in the presence of cyclosporin-A, the extent of the H2O2-evoked inhibition of [Ca2+]i clearance was significantly reduced to 39 ± 6% of the initial control clearance phase (Fig. 6C; n = 5, 58 cells, P = 0.02 as assessed by Mann-Whitney test). However, clearance under these conditions was still significantly lower than the time-matched control, where cells were neither treated with H2O2 nor cyclosporin-A (P < 0.001 as assessed by one-sample t-test).
Fig. 6.
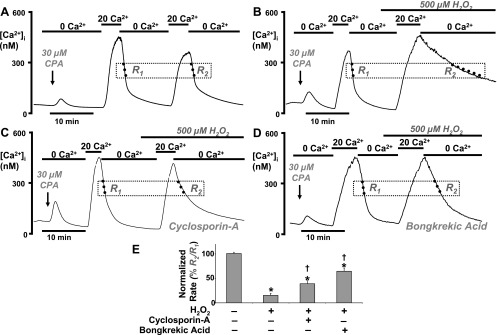
Inhibition of the mitochondrial permeability transition pore partially protects the H2O2 induced inhibition of the PMCA. Representative traces show a paired experimental design whereby two repetitive [Ca2+]i clearance phases (R1 and R2) were invoked by successive application of 20 mM (20 Ca2+) and zero external Ca2+ (0 Ca2+). A: a time-matched control. B: effect of 500 μM H2O2 applied during the second clearance phase (R2). C: combined effect of 500 μM H2O2 and 5 μM cyclosporin-A (applied at the same time as CPA and throughout the experiment). D: effect of 500 μM H2O2 following preincubation with 50 μM bongkrekic acid for 30 min. E: mean data were quantified and normalized by expressing the linear rate (standardized at 300 nM Ca2+) during the second clearance phase as a percentage of the linear rate during the first clearance phase (R2/R1 × 100%). *P < 0.05, statistical significance as assessed using a paired one-sample t-test; †P < 0.05, statistical significance as assessed using a Mann-Whitney test.
Since cyclosporin-A has been reported to have multiple molecular targets (41), further experiments were carried out using the highly specific and functionally distinct mPTP inhibitor, bongkrekic acid (21). This inhibits the adenine nucleotide translocase, responsible for ATP/ADP transfer between the mitochondrial matrix and cytosol, and is also another molecular component of the mPTP (21). Pancreatic acinar cells were preincubated with 50 μM bongkrekic acid for 30 min before beginning the [Ca2+]i clearance assay. Using a similar paired experimental design, cells were treated with H2O2 during the second clearance phase and compared with the first clearance phase (Fig. 6D and mean data in Fig. 6E). Consistent with experiments using cyclosporin-A, preincubation with bongkrekic acid markedly attenuated the H2O2-induced inhibition of [Ca2+]i clearance (65 ± 7% of the initial control clearance phase; Fig. 6D; n = 7, 64 cells; P < 0.001) compared with the effect of H2O2 alone (15 ± 4% of the initial control clearance phase) but significantly lower than time-matched control (P = 0.002, as assessed by one-sample t-test). These data therefore suggest that inhibition of the mPTP partially protects the PMCA from inhibition by H2O2. Moreover, since inhibition of the mPTP was found to fully protect the mitochondrial from H2O2-induced depolarization, any residual inhibition of the PMCA by H2O2 is likely to be independent of mitochondria.
DISCUSSION
We have previously demonstrated that increased oxidative stress (H2O2) altered the normal pattern of CCK-evoked [Ca2+]i signaling and gradually resulted in an irreversible Ca2+ overload response in an increasing proportion of cells as H2O2 concentration was increased (9). This H2O2-induced Ca2+ overload also corresponded to a marked inhibition of the PMCA, which occurred at H2O2 concentrations above 100 μM (9). Using a modified assay, whereby [Ca2+]i clearance was monitored over a much greater range of [Ca2+]i concentrations, the present study confirms that H2O2 inhibited PMCA activity (9). The present results show that mitochondrial depolarization, independent of mitochondrial Ca2+ handling and ATP depletion, correlates with and may be responsible for the H2O2-induced inactivation of the PMCA. This phenomenon was sensitive to the mPTP inhibitors, cyclosporin-A and bongkrekic acid, suggesting that opening of the mPTP may be partly responsible for the inhibition of the PMCA, perhaps via the release of a mitochondrial factor or factors. Such a phenomenon is of interest because it may be one of the earliest, or most critical, events responsible for determining the irreversible nature of the Ca2+ overload response and thus the transition between apoptotic and necrotic cell death. In the pancreas this transition may be key in the progression to acute pancreatitis as previously argued (6, 50).
In the current study, whereby [Ca2+]i clearance was measured over a much greater range of [Ca2+]i concentrations, H2O2 was much more effective compared with our previous study (9), suggesting that at least a component of the H2O2-induced inhibition of the PMCA is Ca2+ dependent. This interpretation depends on all major [Ca2+]i clearance pathways other than PMCA being inactive under the conditions of our [Ca2+]i clearance measurements. In our experiments, SERCA was inhibited by CPA, and the Na+/Ca2+-exchanger is not thought to be expressed in pancreatic acinar cells to levels sufficient to influence Ca2+ extrusion (42). Mitochondrial Ca+ uptake, on the other hand, due to its low affinity and high capacity (17), is likely to make a significant contribution to [Ca2+]i clearance when [Ca2+]i is elevated to such high levels (300–600 nM). Therefore, either inhibition of mitochondrial Ca2+ uptake or activation of mitochondrial Ca2+ release (or both) by H2O2 could conceivably contribute to the observed [Ca2+]i clearance when [Ca2+]i is high. Indeed, the specific mitochondrial Ca2+ uptake inhibitor, Ru-360, significantly inhibited the measured [Ca2+]i clearance and reduced the La3+-insensitive [Ca2+]i clearance to negligible values, suggesting that mitochondrial Ca2+ uptake does contribute.
It was notable that Ru-360 slowed the increase in [Ca2+]i and significantly reduced the steady-state [Ca2+]i following addition of 20 mM external Ca2+. The rate of [Ca2+]i increase under these conditions is classically believed to be governed by SOCE, and the steady-state [Ca2+]i is thought to be due to a balance of SOCE and [Ca2+]i clearance (51). This observation may therefore seem counterintuitive, as one might expect inhibition of mitochondrial Ca2+ uptake to have the opposite effect, i.e., a larger and faster increase in [Ca2+]i because there is less clearance to oppose the influx. However, studies have shown that SOCE, specifically that via Ca2+ release-activated Ca2+ current (ICRAC), is inhibited by mitochondrial Ca2+ uptake inhibitors (28) that increase the local [Ca2+] close to the CRAC channels, thus facilitating Ca2+-dependent inactivation of ICRAC (60). The effect of Ru-360 on Ca2+ repletion is consistent with Ru-360 inhibiting mitochondrial Ca2+ uptake in the present study and provides further validation that all subsequent [Ca2+]i clearance experiments on Ru-360-treated cells most likely represent PMCA activity. Nevertheless, although Ru-360 has proved effective in inhibiting mitochondrial Ca2+ uptake in the present study (see Fig. 1, B and D) and in previous studies (10, 36), we cannot completely rule out the possibility that Ru-360 is not 100% effective in every cell and that there is some residual mitochondrial Ca2+ uptake. However, mitochondrial Ca2+ uptake (La3+-insensitive clearance) only represented ∼15% of the total clearance in untreated control cells, which was then reduced to <5% in Ru-360-treated cells. Therefore, any residual mitochondrial Ca2+ uptake from Ru-360-treated cells is unlikely to contribute to such a dramatic inhibition of [Ca2+]i clearance observed with H2O2 and suggests that an alternative mechanism is responsible for the H2O2-induced inhibition of PMCA activity that is independent of mitochondrial Ca2+ handling.
The current study also demonstrated that H2O2 inhibited the rate of increase in [Ca2+]i following Ca2+ repletion, which is classically believed to be governed by SOCE. This is either due to a direct effect of H2O2 on the SOCE channels, most notably the candidate SOCE channel, Orai, or an indirect effect on the coupling of STIM (the ER depletion sensor) with Orai (or transient receptor potential channels) (32). An alternative explanation is that inhibition of the PMCA indirectly inhibits SOCE due to the accumulation of [Ca2+] close to the channels, causing Ca2+-dependent inactivation, similar to that described for mitochondria.
The most obvious explanation for the inhibitory effect of both H2O2 and mitochondrial inhibitors on PMCA activity is that inhibition of mitochondria causes ATP depletion. PMCA activity is critically dependent on ATP, and the PMCA has a high-affinity catalytic site (Km ∼ 3 μM) and a low-affinity regulatory site (Km ∼ 145 μM) (52). This raises two important questions. First, by how much would ATP levels have to drop in such a short amount of time (5–10 min) to account for the dramatic inhibition of PMCA activity observed with H2O2 and the mitochondrial inhibitors? Second, would inhibition of mitochondrial metabolism alone be enough to deplete ATP levels sufficiently to inhibit the PMCA activity, especially if glycolytic ATP production remains active, for example, in experiments with CCCP and antimycin-A?
The absolute ATP dependency of the PMCA is controversial and has recently been suggested to be more complex than proposed in earlier studies (24). This is partly due to the fact that most studies to determine ATP dependency of the PMCA have used cell-free in vitro assays. This makes extrapolation to experiments using intact cells difficult, especially when one considers the numerous cytosolic factors and plasma membrane interactions that might also influence PMCA activity. Nevertheless, several lines of evidence suggest that severe ATP depletion can inhibit PMCA activity (4, 15, 19). However, it remains unclear whether ATP depletion from inhibition of mitochondrial metabolism alone would be sufficient to inhibit PMCA activity. Indeed, it has been suggested that the PMCA has its own localized glycolytic ATP supply that may render it largely insensitive to inhibition of mitochondrial metabolism (49).
In the present study, we used MgGreen fluorescence to measure ATP levels and found that maximum ATP depletion could only be achieved with an ATP-depletion cocktail designed to maximize ATP consumption and simultaneously inhibit all ATP production. In addition, even using this ATP depletion cocktail, the rise in MgGreen fluorescence (fall in ATP concentration) took 11–39 min to reach a maximum with a latency of ∼8 min. This suggests that ATP depletion is unlikely to be responsible for the dramatic inhibition of the PMCA that occurred within 5–10 min. All three mitochondrial inhibitors (CCCP, antimycin-A, and oligomycin) depleted ATP levels by similar amounts (∼20%), consistent with inhibition of mitochondrial metabolism. ATP depletion by the high concentration of H2O2 (500 μM) was greater than the mitochondrial inhibitors (∼55%), suggesting that at this concentration, H2O2 may also partially inhibit glycolysis, consistent with previous studies (33). However, the ATP depletion observed with these agents was always much less than the maximum ATP depletion achieved with the ATP-depletion cocktail. If one extrapolates these data and assumes an initial [ATP]i of 1 mM (3) and an approximately linear relationship between MgGreen fluorescence and [ATP]i, this suggests that high concentrations of H2O2 would, at the most, only decrease ATP to ∼500 μM. This raises the question as to whether this would be sufficient to inhibit the PMCA. In addition, at the lower concentration (50 μM), H2O2 had no effect on ATP depletion yet significantly inhibited PMCA activity by ∼50%. Furthermore, oligomycin caused similar ATP depletion to CCCP and antimycin-A, yet had no effect on PMCA activity, suggesting that this level of ATP depletion is insufficient to inhibit the PMCA. Collectively these data strongly imply that ATP depletion alone is unlikely to be responsible for the inhibition of the PMCA activity by H2O2. The only caveat to these conclusions is that acidic phospholipids, such as phosphatidylserine (PS), increase the ATP sensitivity of the PMCA (45) and loss of PS from the membrane decreases the affinity for ATP (Km ∼ 5–10 mM) (53). Therefore, H2O2-induced depletion of PS from the membrane (13) or membrane externalization of PS (31) may be sufficient to render the PMCA highly sensitive to only mild ATP depletion. However, these exciting possibilities are highly speculative and remain to be determined.
Data from the present study do not dispute the importance of ATP depletion in acute pancreatitis (6) nor do they rule out the possibility that “complete” ATP depletion can inhibit PMCA activity (4). However, our data do suggest that, under conditions of metabolic inhibition or high oxidant stress when ATP depletion is only partial, non-ATP-dependent mechanisms can also inhibit PMCA activity, thus revealing a potentially novel mechanism.
So far, our data suggest that H2O2-evoked inhibition of the PMCA is independent of mitochondrial Ca2+ handling and unlikely to be due to ATP depletion, at least over the time course of the [Ca2+]i clearance assay (5–15 min). Interestingly, all the reagents tested that inhibited the PMCA also caused mitochondrial Ψm depolarization (H2O2, CCCP, and antimycin-A, but not oligomycin). This suggests that collapse of the mitochondrial Ψm may be responsible, at least in part, for the inhibition of the PMCA activity or that both phenomena share a common cause. Previous studies have also shown that oxidants, CCCP, and antimycin-A all cause mitochondrial Ψm depolarization in pancreatic acinar cells (19, 27), whereas oligomycin has no appreciable effect in adrenal chromaffin cells (34), consistent with the present study. This H2O2-induced mitochondrial Ψm depolarization is likely to be due to opening of the mPTP (27, 40) since this was completely prevented by the mPTP inhibitor, cyclosporin-A. Moreover, cyclosporin-A (8) and the functionally distinct mPTP inhibitor, bongkrekic acid, partially prevented the H2O2-induced inhibition of the PMCA, suggesting that this is partly mediated by the opening of the mPTP.
Opening of the mPTP is likely to cause dissipation of mitochondrial inner membrane ion gradients, most notably Ca2+ and/or H+. Under normal conditions, dissipation of Ca2+ gradients would cause substantial mitochondrial Ca2+ release and presumably mask the clearance by the PMCA. However, under the conditions of our [Ca2+]i clearance assay, whereby mitochondrial Ca2+ uptake is inhibited by Ru-360, opening of the mPTP is unlikely to cause substantial mitochondrial Ca2+ release and therefore has minimal effects on the apparent [Ca2+]i clearance. Dissipation of the mitochondrial H+ gradient could also conceivably inhibit the PMCA as Ca2+ efflux is coupled to H+ influx (14). However, previous studies in pancreatic acinar cells have shown that CCCP has no appreciable effect on bulk cytosolic pH (57), although local pH changes, for example if mitochondria are in close proximity to the plasma membrane (35), cannot be ruled out.
Another possibility is that opening of the mPTP causes the release of some mitochondrial factor that directly binds to or activates a secondary pathway and thus inhibits the PMCA. The release of mitochondrial factors have been well characterized and are strongly implicated as one of the early events during apoptosis (6). Although cytochrome c is perhaps the best characterized factor to be released from the mitochondria during apoptosis, several other released proteins have also been identified, including Smac/DIABLO, HtrA2, Endo G, and AIF (apoptosis-inducing factor) (6). Furthermore, the mitochondrial-specific lipid, cardiolipin (26), which under normal situations couples to cytochrome c, is also released from the mitochondria during apoptosis and is another of the acidic phospholipids reported to modulate the PMCA activity (45). Binding and/or regulation of Ca2+ transport proteins by mitochondrially released proteins is not an unprecedented phenomenon. For example, cytochrome c (7), Bax/Bak (46), and Bcl-2/Bcl-xL (16, 58) have all been shown to bind to, and regulate, inositol 1,4,5-trisphosphate receptors, and Bcl-2 can also regulate SERCA (38). This therefore provides a large scope for potential candidate mitochondrially derived PMCA-inhibitory factors.
Most experimental assays of apoptosis are over several hours following a pro-apoptotic stimulus. This suggests that the release of mitochondrial proteins, although one of the earlier events during apoptosis, may occur over a similar timeframe. However, some studies suggest much faster and/or abrupt changes, for example, in cytochrome c release (29). In pancreatic acinar cells, cytochrome c has also been reported to be released into the cytosol within 2 min of treatment with the oxidant menadione (27), a result that fits well with the time course of our [Ca2+]i clearance assay. In addition, inhibition of the PMCA and the irreversible Ca2+ overload response observed in our previous (9) and current studies are more likely to facilitate necrotic rather than apoptotic cell death. However, more recently, the distinction between these two cell death pathways has become less clear, and there is now evidence that necrosis and apoptosis share common mechanisms (37). In particular, and of relevance to the current study, the mPTP has been suggested to have a role in both apoptotic and necrotic cell death (37). The mPTP is thought to be made up of a complex of proteins including the voltage-dependent anion channel, adenine nucleotide translocase, the molecular target of bongkrekic acid (21), and cyclophilin-D (20), the molecular target of cyclosporin-A (8). Transgenic studies in which cyclophilin-D has either been knocked out or overexpressed have suggested that this protein is critical in controlling necrotic cell death rather than apoptotic cell death (2). In particular, cyclophilin-D knockout mice were found to be protected against ischemia-reperfusion injury, and isolated myocytes were resistant to oxidant-induced mitochondrial swelling, permeability transition, Ca2+-overload, and necrotic cell death (2). Conversely, cyclophilin-D overexpressing cells were unusually more susceptible to mitochondrial swelling and spontaneous cell death (2). These studies therefore provide compelling evidence that opening of the mPTP is important for oxidant-induced Ca2+ overload and necrotic cell death and thus are broadly in line with our conclusion that this may also mediate inhibition of the PMCA.
It is important to note that in current experiments, cyclosporin-A only partially protected the PMCA from inhibition despite maximally protecting the mitochondria from depolarization. In addition, the inhibitory effect of high concentrations of H2O2 was much greater than the effect of CCCP, which also caused “full” depolarization of the mitochondrial Ψm. This suggests that opening of the mPTP by H2O2 is not the only mechanism responsible for the inhibition of the PMCA. These additional mechanisms could include direct oxidation of critical thiol groups within the PMCA or oxidation of CaM (59), which reduces the Ca2+-dependent regulation of the PMCA (25).
To summarize, the present study demonstrates that oxidative stress causes an inhibition of PMCA activity that is independent of mitochondrial Ca2+ handling and is unlikely to be due to ATP depletion. The study also reveals a potentially novel mechanism whereby part of the oxidant-induced inhibition of the PMCA involves mitochondrial depolarization and opening of the mPTP, suggesting that a mitochondrially released factor or factors may be responsible. Such a phenomenon could represent one of the critical events underlying the Ca2+ overload response that leads to necrotic cell death. Apart from being potentially important during the pathogenesis of acute pancreatitis, this may also represent a general feature of cell death in other cell types.
GRANTS
This work was supported by a Biotechnology and Biological Sciences Research Council grant awarded to J. I. E. Bruce.
Acknowledgments
The authors thank Dr. Mauro Degli Esposti, Faculty of Life Sciences, University of Manchester, for help with the use of some of the mitochondrial inhibitors.
The costs of publication of this article were defrayed in part by the payment of page charges. The article must therefore be hereby marked “advertisement” in accordance with 18 U.S.C. Section 1734 solely to indicate this fact.
REFERENCES
- 1.Baggaley E, McLarnon S, Demeter I, Varga G, Bruce JI. Differential regulation of the apical plasma membrane Ca2+-ATPase by protein kinase A in parotid acinar cells. J Biol Chem 282: 37678–37693, 2007. [DOI] [PubMed] [Google Scholar]
- 2.Baines CP, Kaiser RA, Purcell NH, Blair NS, Osinska H, Hambleton MA, Brunskill EW, Sayen MR, Gottlieb RA, Dorn GW, Robbins J, Molkentin JD. Loss of cyclophilin D reveals a critical role for mitochondrial permeability transition in cell death. Nature 434: 658–662, 2005. [DOI] [PubMed] [Google Scholar]
- 3.Barros LF, Kanaseki T, Sabirov R, Morishima S, Castro J, Bittner CX, Maeno E, Ando-Akatsuka Y, Okada Y. Apoptotic and necrotic blebs in epithelial cells display similar neck diameters but different kinase dependency. Cell Death Differ 10: 687–697, 2003. [DOI] [PubMed] [Google Scholar]
- 4.Barrow SL, Voronina SG, da Silva Xavier G, Chvanov MA, Longbottom RE, Gerasimenko OV, Petersen OH, Rutter GA, Tepikin AV. ATP depletion inhibits Ca2+ release, influx and extrusion in pancreatic acinar cells but not pathological Ca2+ responses induced by bile. Pflügers Arch 455: 1025–1039, 2008. [DOI] [PubMed] [Google Scholar]
- 5.Bautista DM, Hoth M, Lewis RS. Enhancement of calcium signalling dynamics and stability by delayed modulation of the plasma-membrane calcium-ATPase in human T cells. J Physiol 541: 877–894, 2002. [DOI] [PMC free article] [PubMed] [Google Scholar]
- 6.Bhatia M Apoptosis versus necrosis in acute pancreatitis. Am J Physiol Gastrointest Liver Physiol 286: G189–G196, 2004. [DOI] [PubMed] [Google Scholar]
- 7.Boehning D, Patterson RL, Sedaghat L, Glebova NO, Kurosaki T, Snyder SH. Cytochrome c binds to inositol (1,4,5) trisphosphate receptors, amplifying calcium-dependent apoptosis. Nat Cell Biol 5: 1051–1061, 2003. [DOI] [PubMed] [Google Scholar]
- 8.Broekemeier KM, Dempsey ME, Pfeiffer DR. Cyclosporin A is a potent inhibitor of the inner membrane permeability transition in liver mitochondria. J Biol Chem 264: 7826–7830, 1989. [PubMed] [Google Scholar]
- 9.Bruce JI, Elliott AC. Oxidant-impaired intracellular Ca2+ signaling in pancreatic acinar cells: role of the plasma membrane Ca2+-ATPase. Am J Physiol Cell Physiol 293: C938–C950, 2007. [DOI] [PubMed] [Google Scholar]
- 10.Bruce JI, Giovannucci DR, Blinder G, Shuttleworth TJ, Yule DI. Modulation of [Ca2+]i signaling dynamics and metabolism by perinuclear mitochondria in mouse parotid acinar cells. J Biol Chem 279: 12909–12917, 2004. [DOI] [PubMed] [Google Scholar]
- 11.Bruce JI, Yang X, Ferguson CJ, Elliott AC, Steward MC, Case RM, Riccardi D. Molecular and functional identification of a Ca2+ (polyvalent cation)-sensing receptor in rat pancreas. J Biol Chem 274: 20561–20568, 1999. [DOI] [PubMed] [Google Scholar]
- 12.Bruce JI, Yule DI, Shuttleworth TJ. Ca2+-dependent protein kinase–a modulation of the plasma membrane Ca2+-ATPase in parotid acinar cells. J Biol Chem 277: 48172–48181, 2002. [DOI] [PubMed] [Google Scholar]
- 13.Brunauer LS, Moxness MS, Huestis WH. Hydrogen peroxide oxidation induces the transfer of phospholipids from the membrane into the cytosol of human erythrocytes. Biochemistry 33: 4527–4532, 1994. [DOI] [PubMed] [Google Scholar]
- 14.Carafoli E Calcium pump of the plasma membrane. Physiol Rev 71: 129–153, 1991. [DOI] [PubMed] [Google Scholar]
- 15.Castro J, Ruminot I, Porras OH, Flores CM, Hermosilla T, Verdugo E, Venegas F, Hartel S, Michea L, Barros LF. ATP steal between cation pumps: a mechanism linking Na+ influx to the onset of necrotic Ca2+ overload. Cell Death Differ 13: 1675–1685, 2006. [DOI] [PubMed] [Google Scholar]
- 16.Chen R, Valencia I, Zhong F, McColl KS, Roderick HL, Bootman MD, Berridge MJ, Conway SJ, Holmes AB, Mignery GA, Velez P, Distelhorst CW. Bcl-2 functionally interacts with inositol 1,4,5-trisphosphate receptors to regulate calcium release from the ER in response to inositol 1,4,5-trisphosphate. J Cell Biol 166: 193–203, 2004. [DOI] [PMC free article] [PubMed] [Google Scholar]
- 17.Collins TJ, Lipp P, Berridge MJ, Bootman MD. Mitochondrial Ca2+ uptake depends on the spatial and temporal profile of cytosolic Ca2+ signals. J Biol Chem 276: 26411–26420, 2001. [DOI] [PubMed] [Google Scholar]
- 18.Criddle DN, McLaughlin E, Murphy JA, Petersen OH, Sutton R. The pancreas misled: signals to pancreatitis. Pancreatology 7: 436–446, 2007. [DOI] [PubMed] [Google Scholar]
- 19.Criddle DN, Murphy J, Fistetto G, Barrow S, Tepikin AV, Neoptolemos JP, Sutton R, Petersen OH. Fatty acid ethyl esters cause pancreatic calcium toxicity via inositol trisphosphate receptors and loss of ATP synthesis. Gastroenterology 130: 781–793, 2006. [DOI] [PubMed] [Google Scholar]
- 20.Crompton M The mitochondrial permeability transition pore and its role in cell death. Biochem J 341: 233–249, 1999. [PMC free article] [PubMed] [Google Scholar]
- 21.Dahout-Gonzalez C, Nury H, Trezeguet V, Lauquin GJ, Pebay-Peyroula E, Brandolin G. Molecular, functional, and pathological aspects of the mitochondrial ADP/ATP carrier. Physiology (Bethesda) 21: 242–249, 2006. [DOI] [PubMed] [Google Scholar]
- 22.Duchen MR Mitochondria and calcium: from cell signalling to cell death. J Physiol 529: 57–68, 2000. [DOI] [PMC free article] [PubMed] [Google Scholar]
- 23.Duchen MR Mitochondria in health and disease: perspectives on a new mitochondrial biology. Mol Aspects Med 25: 365–451, 2004. [DOI] [PubMed] [Google Scholar]
- 24.Echarte MM, Rossi RC, Rossi JP. Phosphorylation of the plasma membrane calcium pump at high ATP concentration. On the mechanism of ATP hydrolysis. Biochemistry 46: 1034–1041, 2007. [DOI] [PubMed] [Google Scholar]
- 25.Elwess NL, Filoteo AG, Enyedi A, Penniston JT. Plasma membrane Ca2+ pump isoforms 2a and 2b are unusually responsive to calmodulin and Ca2+. J Biol Chem 272: 17981–17986, 1997. [DOI] [PubMed] [Google Scholar]
- 26.Esposti MD Lipids, cardiolipin and apoptosis: a greasy licence to kill. Cell Death Differ 9: 234–236, 2002. [DOI] [PubMed] [Google Scholar]
- 27.Gerasimenko JV, Gerasimenko OV, Palejwala A, Tepikin AV, Petersen OH, Watson AJ. Menadione-induced apoptosis: roles of cytosolic Ca2+ elevations and the mitochondrial permeability transition pore. J Cell Sci 115: 485–497, 2002. [DOI] [PubMed] [Google Scholar]
- 28.Glitsch MD, Bakowski D, Parekh AB. Store-operated Ca2+ entry depends on mitochondrial Ca2+ uptake. EMBO J 21: 6744–6754, 2002. [DOI] [PMC free article] [PubMed] [Google Scholar]
- 29.Goldstein JC, Munoz-Pinedo C, Ricci JE, Adams SR, Kelekar A, Schuler M, Tsien RY, Green DR. Cytochrome c is released in a single step during apoptosis. Cell Death Differ 12: 453–462, 2005. [DOI] [PubMed] [Google Scholar]
- 30.Gonzalez A, Granados MP, Salido GM, Pariente JA. H2O2-induced changes in mitochondrial activity in isolated mouse pancreatic acinar cells. Mol Cell Biochem 269: 165–173, 2005. [DOI] [PubMed] [Google Scholar]
- 31.Herrmann A, Devaux PF. Alteration of the aminophospholipid translocase activity during in vivo and artificial aging of human erythrocytes. Biochim Biophys Acta 1027: 41–46, 1990. [DOI] [PubMed] [Google Scholar]
- 32.Hewavitharana T, Deng X, Soboloff J, Gill DL. Role of STIM and Orai proteins in the store-operated calcium signaling pathway. Cell Calcium 42: 173–182, 2007. [DOI] [PubMed] [Google Scholar]
- 33.Hyslop PA, Hinshaw DB, Halsey WA Jr, Schraufstatter IU, Sauerheber RD, Spragg RG, Jackson JH, Cochrane CG. Mechanisms of oxidant-mediated cell injury. The glycolytic and mitochondrial pathways of ADP phosphorylation are major intracellular targets inactivated by hydrogen peroxide. J Biol Chem 263: 1665–1675, 1988. [PubMed] [Google Scholar]
- 34.Inoue M, Fujishiro N, Imanaga I, Sakamoto Y. Role of ATP decrease in secretion induced by mitochondrial dysfunction in guinea-pig adrenal chromaffin cells. J Physiol 539: 145–155, 2002. [DOI] [PMC free article] [PubMed] [Google Scholar]
- 35.Johnson PR, Dolman NJ, Pope M, Vaillant C, Petersen OH, Tepikin AV, Erdemli G. Non-uniform distribution of mitochondria in pancreatic acinar cells. Cell Tissue Res 313: 37–45, 2003. [DOI] [PubMed] [Google Scholar]
- 36.Johnson PR, Tepikin AV, Erdemli G. Role of mitochondria in Ca2+ homeostasis of mouse pancreatic acinar cells. Cell Calcium 32: 59–69, 2002. [DOI] [PubMed] [Google Scholar]
- 37.Kim JS, Qian T, Lemasters JJ. Mitochondrial permeability transition in the switch from necrotic to apoptotic cell death in ischemic rat hepatocytes. Gastroenterology 124: 494–503, 2003. [DOI] [PubMed] [Google Scholar]
- 38.Kuo TH, Kim HR, Zhu L, Yu Y, Lin HM, Tsang W. Modulation of endoplasmic reticulum calcium pump by Bcl-2. Oncogene 17: 1903–1910, 1998. [DOI] [PubMed] [Google Scholar]
- 39.Leyssens A, Nowicky AV, Patterson L, Crompton M, Duchen MR. The relationship between mitochondrial state, ATP hydrolysis, [Mg2+]i and [Ca2+]i studied in isolated rat cardiomyocytes. J Physiol 496: 111–128, 1996. [DOI] [PMC free article] [PubMed] [Google Scholar]
- 40.Martinou JC, Desagher S, Antonsson B. Cytochrome c release from mitochondria: all or nothing. Nat Cell Biol 2: E41–E43, 2000. [DOI] [PubMed] [Google Scholar]
- 41.Matsuda S, Koyasu S. Mechanisms of action of cyclosporine. Immunopharmacology 47: 119–125, 2000. [DOI] [PubMed] [Google Scholar]
- 42.Muallem S, Beeker T, Pandol SJ. Role of Na+/Ca2+ exchange and the plasma membrane Ca2+ pump in hormone-mediated Ca2+ efflux from pancreatic acini. J Membr Biol 102: 153–162, 1988. [DOI] [PubMed] [Google Scholar]
- 43.Muller FL, Liu Y, Van Remmen H. Complex III releases superoxide to both sides of the inner mitochondrial membrane. J Biol Chem 279: 49064–49073, 2004. [DOI] [PubMed] [Google Scholar]
- 44.Murphy E, Steenbergen C, Levy LA, Raju B, London RE. Cytosolic free magnesium levels in ischemic rat heart. J Biol Chem 264: 5622–5627, 1989. [PubMed] [Google Scholar]
- 45.Niggli V, Adunyah ES, Carafoli E. Acidic phospholipids, unsaturated fatty acids, and limited proteolysis mimic the effect of calmodulin on the purified erythrocyte Ca2+ - ATPase. J Biol Chem 256: 8588–8592, 1981. [PubMed] [Google Scholar]
- 46.Oakes SA, Scorrano L, Opferman JT, Bassik MC, Nishino M, Pozzan T, Korsmeyer SJ. Proapoptotic BAX and BAK regulate the type 1 inositol trisphosphate receptor and calcium leak from the endoplasmic reticulum. Proc Natl Acad Sci USA 102: 105–110, 2005. [DOI] [PMC free article] [PubMed] [Google Scholar]
- 47.Orrenius S, Zhivotovsky B, Nicotera P. Regulation of cell death: the calcium-apoptosis link. Nat Rev Mol Cell Biol 4: 552–565, 2003. [DOI] [PubMed] [Google Scholar]
- 48.Parekh AB, Penner R. Store depletion and calcium influx. Physiol Rev 77: 901–930, 1997. [DOI] [PubMed] [Google Scholar]
- 49.Paul RJ, Hardin CD, Raeymaekers L, Wuytack F, Casteels R. Preferential support of Ca2+ uptake in smooth muscle plasma membrane vesicles by an endogenous glycolytic cascade. FASEB J 3: 2298–2301, 1989. [DOI] [PubMed] [Google Scholar]
- 50.Petersen OH, Sutton R. Ca2+ signalling and pancreatitis: effects of alcohol, bile and coffee. Trends Pharmacol Sci 27: 113–120, 2006. [DOI] [PubMed] [Google Scholar]
- 51.Putney JW A model for receptor-regulated calcium entry. Cell Calcium 7: 1–12, 1986. [DOI] [PubMed] [Google Scholar]
- 52.Richards DE, Rega AF, Garrahan PJ. Two classes of site for ATP in the Ca2+-ATPase from human red cell membranes. Biochim Biophys Acta 511: 194–201, 1978. [DOI] [PubMed] [Google Scholar]
- 53.Rossi JP, Rega AF. A study to see whether phosphatidylserine, partial proteolysis and EGTA substitute for calmodulin during activation of the Ca2+-ATPase from red cell membranes by ATP. Biochim Biophys Acta 996: 153–159, 1989. [DOI] [PubMed] [Google Scholar]
- 54.Sastre J, Pallardo FV, Vina J. The role of mitochondrial oxidative stress in aging. Free Radic Biol Med 35: 1–8, 2003. [DOI] [PubMed] [Google Scholar]
- 55.Sherwood MW, Prior IA, Voronina SG, Barrow SL, Woodsmith JD, Gerasimenko OV, Petersen OH, Tepikin AV. Activation of trypsinogen in large endocytic vacuoles of pancreatic acinar cells. Proc Natl Acad Sci USA 104: 5674–5679, 2007. [DOI] [PMC free article] [PubMed] [Google Scholar]
- 56.Straub SV, Giovannucci DR, Yule DI. Calcium wave propagation in pancreatic acinar cells: functional interaction of inositol 1,4,5-trisphosphate receptors, ryanodine receptors, and mitochondria. J Gen Physiol 116: 547–560, 2000. [DOI] [PMC free article] [PubMed] [Google Scholar]
- 57.Tinel H, Cancela JM, Mogami H, Gerasimenko JV, Gerasimenko OV, Tepikin AV, Petersen OH. Active mitochondria surrounding the pancreatic acinar granule region prevent spreading of inositol trisphosphate-evoked local cytosolic Ca2+ signals. EMBO J 18: 4999–5008, 1999. [DOI] [PMC free article] [PubMed] [Google Scholar]
- 58.White C, Li C, Yang J, Petrenko NB, Madesh M, Thompson CB, Foskett JK. The endoplasmic reticulum gateway to apoptosis by Bcl-X(L) modulation of the InsP3R. Nat Cell Biol 7: 1021–1028, 2005. [DOI] [PMC free article] [PubMed] [Google Scholar]
- 59.Zaidi A, Michaelis ML. Effects of reactive oxygen species on brain synaptic plasma membrane Ca2+-ATPase. Free Radic Biol Med 27: 810–821, 1999. [DOI] [PubMed] [Google Scholar]
- 60.Zweifach A, Lewis RS. Rapid inactivation of depletion-activated calcium current (ICRAC) due to local calcium feedback. J Gen Physiol 105: 209–226, 1995. [DOI] [PMC free article] [PubMed] [Google Scholar]