Abstract
BeWo cells are a placental cell line that has been widely used as an in vitro model for the placenta. The b30 subclone of these cells can be grown on permeable membranes in bicameral chambers to form confluent cell layers, enabling rates of both nutrient uptake into the cells from the apical surface and efflux from the basolateral membrane to be determined. The aim of this study was to evaluate structural and functional properties of confluent b30 BeWo cell layers grown in bicameral chambers, focusing on the potential application for studying receptor-mediated uptake and transport of transferrin (Tf)-bound iron (Fe-Tf). While it proved extremely difficult to establish and maintain an intact BeWo cell monolayer, it was possible to grow the cells to a confluent multilayer. Iron, applied as Fe-Tf, was rapidly transported across this cell layer; 9.3 ± 0.5% of the total dose was transported after 8 h, equivalent to 38.8 ± 2.1 pmol·cm−2·h−1. Transfer of Tf across the cell layer was much more limited; 2.4 ± 0.2% of the total dose was transported after 8 h, equivalent to 5.0 ± 0.4 pmol·cm−2·h−1. Compartmental modeling of these data suggested that iron was transported across the cell layer predominantly, if not exclusively, via a transcellular route, whereas Tf taken up into the cells was predominantly recycled back to the apical compartment. The results suggest that these cells are very efficient at transporting iron and, under carefully controlled conditions, can be a valuable tool for the study of iron transport in the placenta.
Keywords: placenta, fetus, mineral metabolism
during pregnancy, iron is transported from mother to fetus by the placenta. The total iron requirement for the term infant is considerable (600–1,000 mg) and is in excess of the total maternal body stores (3), emphasizing the importance of dietary iron during pregnancy. Maternal iron deficiency during early pregnancy doubles the risk of preterm delivery (19). Although the severity of the anemia tends to be greater in the mother, iron deficiency may also result in serious long lasting effects on the fetus, such as fetal growth retardation (1) and increased blood pressure (9).
BeWo cells are a human placental cell line that originates from a choriocarcinoma (16). These cells have been used widely as an in vitro model to study placental uptake of a variety of nutrients including glucose (23), amino acids (7, 8, 14), and iron (6, 22).
Van der Ende and coworkers (22) reported receptor-mediated uptake of iron when the b24 subclone of BeWo cells was grown on a plastic surface. It has been reported that when grown on permeable membrane supports, the b30 subclone of BeWo cells can form confluent monolayers (15). These have been used, albeit less extensively, in dual-chamber culture systems to study not only nutrient uptake but also transport across the cell layer (15). However, unlike Caco-2 cells, which are widely used in a similar culture system as a model of intestinal epithelial cell transport, BeWo cells do not undergo contact inhibition of growth. This makes it more difficult to obtain and sustain an intact cell monolayer that would be optimal for transport studies (15). Furthermore, the permeability of BeWo cells layers is dependent on the molecular size of the substrate applied (15). The study described here is a detailed evaluation of the structural and functional properties of BeWo (b30 subclone) cell layers grown on permeable supports with respect to their potential use for placental iron transport studies.
Compartmental modeling is a well-established technique for estimating nutrient fluxes in biological systems (4, 5, 11, 13). Its use in iron metabolism is mainly based on radioisotope work, published in the 1960s, which resulted in the development of complex multicompartmental models (12, 17, 20). Compartmental modeling has recently started to be used to study transport processes in cultured cells. For example, Gonzalez-Alvarez and colleagues (10) used a compartmental kinetic approach to estimate passive permeability and efflux transport parameters with Caco-2 cells. However, no equivalent analyses have yet been reported with BeWo cells. Therefore, the studies described in the current article make use of simple models to evaluate the transport of transferrin (Tf)-bound iron (Fe-Tf) across a BeWo cell layer.
MATERIALS AND METHODS
Cell culture.
BeWo cells subclone b30 (kindly donated by Dr. Alan Schwartz, Washington University, St. Louis, MO) were routinely cultured in 75-cm2 flasks (Fisher Scientific, Loughborough, UK) at 37°C and 5% CO2 in high-glucose DMEM containing glutamax1 (Invitrogen, Paisley, UK), penicillin (100 U/ml), streptomycin (100 μg/ml), and 10% vol/vol fetal calf serum (Sigma, Poole, UK). Cells were subcultured every 7 days, and the medium was replenished every 2 days. For transport experiments, cells were seeded onto permeable membrane supports (Thincerts, Greiner Bio-One, Stonehouse, UK) at a density of 8 × 10⁴ cells/cm2. Transepithelial electrical resistance (TEER) was monitored using a handheld voltohmmeter. Additionally, in one experiment, the effects of prior coating of the permeable insert membranes with rat tail collagen (Sigma), used according to the manufacturer's instructions, were investigated. Briefly, Thincerts were coated with 0.01% wt/vol collagen (6 μg/cm2) solution diluted in sterile water. The protein was allowed to adhere for several hours at room temperature, excess fluid was removed, and inserts were allowed to dry overnight before being rinsed with a balanced salt solution (BSS; 136 mM NaCl, 5 mM KCl, 1 mM CaCl2, 1 mM MgCl2, 18 mM HEPES, pH adjusted to 7.4 with 1 M NaOH).
Preparation of transverse sections of BeWo cells for light microscopy.
BeWo cells were seeded at two different densities (2 × 10⁵ cells/cm2 and 8 × 10⁴ cells/cm2) onto Thincerts and incubated for 1, 3, 7, and 9 days. The cells were fixed for 1 h at room temperature by replacing the growth medium with 3% glutaraldehyde (Agar Scientific, Stansted, UK) in 0.1 M cacodylate buffer (pH 7.2). The filters were then washed three times with 0.1 M cacodylate buffer (pH 7.2). The wide top part of each transwell was then removed with pliers, but the filter membranes were kept attached to the transwell during processing to avoid folding or damage through abrasion. The samples were then dehydrated in an ethanol series from 10% to 90% with stepwise increases of 10% followed by three washes in 100% ethanol.
A number of filters were carefully removed from the cell culture Thincerts with a scalpel and infiltrated in a 1:1 mixture of ethanol and LR White Medium acrylic resin (Agar Scientific) for 24 h, followed by three changes of 100% resin over 4 days. The samples were then polymerized in fresh resin overnight at 60°C. Sections of 1-μm thickness were cut with glass knives and mounted on slides. The filters were removed before the cell layers were sectioned to prevent “wrinkling” of the sections. After staining with 1% toluidine blue in 1% borax (pH 11), the sections were examined and photographed with an Olympus BX60 (Olympus, Japan) microscope with Acquis software (Syncroscopy, Cambridge, UK).
Transmission electron microscopy.
The cells growing on Thincerts were fixed for 1 h at room temperature by replacing the growth medium with 3% glutaraldehyde (Agar Scientific) in 0.1 M cacodylate buffer (pH 7.2). The Thincerts were then washed three times with 0.1 M cacodylate buffer (pH 7.2) and cut into 3-mm squares with a sharp razor blade. These pieces were postfixed in 2% aqueous osmium tetroxide for 2 h and then dehydrated through an ethanol series. After three washes in 100% ethanol, the pieces were transferred to acetone, then infiltrated and embedded in Spurr resin (Agar Scientific) (21). Sections ∼75 nm thick were cut using a diamond knife, collected on copper grids, and stained sequentially with uranyl acetate (saturated in 50% ethanol) and Reynolds' lead citrate (18). Sections were examined and photographed in a JEOL 1200 EX/B transmission electron microscope at 80 kV.
Markers of passive diffusion.
Rates of passive diffusion across the BeWo cell layer were determined for two markers of substantially different molecular weight. Diffusion of lower-molecular-weight species was determined using [14C]mannitol (relative molecular mass of 182 Da). The [14C]mannitol (25 kBq, 12 μmol per filter, 8 mM) was added to the apical side of the cells in BSS. The cells were incubated as described for the transport studies below, and rates of transfer were determined by sampling aliquots of apical and basolateral medium at time points up to 8 h for scintillation counting.
Fluorescein-labeled dextran T70 (FD-70, Sigma), which has an average molecular mass of 70 kDa, was used to determine rates of passive transfer of high-molecular-weight species across the cell layer. FD-70 (final concentration 0.5 μM) was added to the apical side of the cells in BSS, and cells were incubated as described for the transport studies below with rates of transfer determined by sampling quantification of fluorescence [using a fluorescence plate reader as described below for Tf labeled with fluorescein isothiocyanate (FITC)] in aliquots of apical and basolateral medium sampled at time points up to 8 h. Transport/passive diffusion of apo-Tf-FITC was analyzed in the same manner.
Preparation of fluorescein-labeled holo-transferrin containing 55Fe.
Iron-free transferrin (apo-Tf) labeled with FITC (Tf-FITC) was prepared from holo-Tf-FITC (Invitrogen) using a modification of the method of Young and coworkers (25). Briefly, 400 μl of holo-Tf-FITC (25 μM) was added to an ultrafiltration spin column with a nominal molecular mass cutoff of 30 kDa (Microcon 30, Millipore, Watford, UK). This was centrifuged at 14,000 g for 12 min at room temperature, concentrating the retentate to ∼50 μl. The flow-through was discarded, and 400 μl of 0.1 M sodium citrate was added to the retentate in the spin column. The solution was mixed using a pipette, and the unit was centrifuged as before. This step was repeated a total of three times. Finally, 400 μl BSS was added to the retentate in column and spun through as before. The final retentate was diluted in BSS to the appropriate concentration (5 μM Tf) before being added to the apical side of the cells. The effectiveness of this process was assessed independently by scintillation counting of eluates, and retentates from the ultrafiltration device were obtained at each stage during processing of 55Fe-Tf according to the same protocol. This demonstrated that the process was very effective at removing the iron from the Tf (<99%).
FeCl3 was dissolved in 0.1 M HCl to a final concentration of 50 mM. Disodium nitrilotriacetate (NTA, Sigma) was dissolved in BSS to a concentration of 5 mM. Five microliters of 50 mM FeCl3 (0.25 μmol) was mixed with 285 μl of 5 mM NTA (1.425 μmol) and to this mixture was added 12.5 μl of a substock of 55FeCl3 (Amersham, Little Chalfont, UK) diluted to 37 kBq/μl (3.06 GBq/mg of Fe) in 0.1 M HCl.
Separately, 250 μl of NaHCO3 (7.5% wt/vol) was added to apo-Tf or apo-Tf-FITC (0.125 μmol) in 200 μl BSS. The FeCl3/NTA mix was added dropwise to the apo-Tf or apo-Tf-FITC solution to produce iron-saturated holo-Tf or holo-Tf-FITC trace labeled with 55Fe, at a pH of 7–7.5. The mixture was left to stand for 2 h at room temperature and was then subjected to diafiltration with BSS in a Microcon 30 ultrafiltration unit, as described above, to remove any non-Tf-bound iron.
Stability of holo-Tf preparations.
Holo-Tf containing 55Fe was prepared from apo-Tf without FITC label (Sigma) as described above. To check the stability of the Fe-Tf preparations, the 55Fe-Tf (0.5 μCi/ml and 10 μM Fe) in BSS was added either to wells in cell culture dishes in the absence of cells or to the apical side of BeWo on permeable membranes. The samples were incubated for 1, 2, 4, and 8 h. At each time point, aliquots were taken from the wells or from the apical medium above the cells. These were concentrated using centrifugal ultrafiltration units (Microcon 30) by centrifugation at 14,000 g at room temperature for 12 min. The 55Fe present in both the flow-through and the retentate was determined by scintillation counting using Quicksafe A scintillation fluid (Zinsser Analytic, Maidenhead, UK) and a Packard Tri-card 2700 TR, liquid scintillation analyzer.
Iron/Tf transport studies.
Seven days after the cells were seeded in Thincerts, freshly prepared 55Fe-Tf-FITC in BSS was added to the apical or basolateral side of the cells at a final concentration of 10 μM Fe3+ (containing 18.5 kBq/ml 55Fe) and 5 μM Tf-FITC in BSS. The cells were incubated at 37°C with constant mixing on an orbital shaker (55 rpm). After varying time intervals, ranging from 30 min up to 8 h, the medium was removed from both the apical and basolateral chambers into separate tubes. The apical surfaces of the cells were washed with BSS (3 washes each of 1 ml), and the wash solutions were pooled with the corresponding apical medium samples. The cells were lysed with 1 ml water and the lysates were collected. Each permeable support membrane was washed with a further 1 ml of water, and this was pooled with the corresponding lysate sample. The 55Fe content of each apical medium, basolateral medium, and cell lysate sample was determined by scintillation counting. Iron retained in the cells was corrected for protein content of the lysates determined using the microBCA kit (Perbio Science, Tattenhall, UK). Iron transport was calculated as the total radioactivity present in the chamber opposite that to which the 55Fe-Tf-FITC was originally added, as a percentage of the total radioactivity added. Retained (i.e., within the cell) and transported Tf-FITC was determined using a fluorescent plate reader (F-MAX fluorimeter, Molecular Devices, Uckfield, UK).
Kinetic analysis and statistical modeling.
A compartmental model of iron transport was developed and optimized using SAAM II (SAAM Institute, Seattle, WA) based on the iron transport and iron retained data.
For the modeling process, compartments represent discrete amounts of iron (or Tf) that behave identically. A compartment is a theoretical construct, which may, in fact, combine material from several different physical spaces in a system. It is defined as an amount of material that acts as though it is well mixed and kinetically homogeneous, and a compartmental model consists of a finite number of compartments with specified interconnections between them. The interconnections are a representation of the flux of material that is transported from one location to another. By defining a compartmental model in this way, the researcher can reduce a complex metabolic system into a small number of pathways and compartments.
The circles in the model (Fig. 7) represent compartments, and the arrows are pathways showing the direction of transfer of material. Associated with each pathway is a rate constant, conventionally written as k(i,j), which denotes transfer of material from compartment “j” to compartment “i” per unit time. Mathematically, compartment models are described by constant coefficient, ordinary, first-order differential equations. The basis of this is that the rate constants do not alter over the course of the experiment, and applying the conservation of mass to the system under study can solve the resultant series of equations.
A model can be viewed as a hypothesis to be tested against experimental data, and the structure of the model is then altered until a satisfactory fit to the data occurs. All the compartments in the experimental system used here are accessible and are sampled.
For data fitting, parameters were given initial estimates consistent with published data on human iron metabolism. The Tf and iron data were first fitted separately and then simultaneously. During the fitting process, the parameters are allowed to vary until a minimum of the objective function is reached. The software then returns the mean and standard deviation of the parameters. The final model structure was arrived at by a process of trial and error but with the guiding principle that it must contain the fewest compartments to describe the data adequately (principle of parsimony). The final model parameters are uniquely identifiable, which means that they have one solution. Several compartmental structures were attempted on the basis of known physiology and metabolism, but the final structures were chosen because they seemed to capture most of the known features of cellular iron metabolism with the minimum standard deviation on the parameters.
RESULTS
Growth of BeWo cells on Thincerts and microscopic analysis of cell layers.
TEER measurements increased steadily in an approximately linear fashion over at least 7 days following seeding of BeWo cells at a density of 8 × 10⁴ cells/cm2 onto the Thincerts (Table 1). Transfer of the cells from normal growth medium to the BSS used for transport studies did not lead to any reduction in TEER (data not shown) over at least 8 h, the maximum period used for the transport studies.
Table 1.
TEER measurements for BeWo cell layers grown in bicameral chambers at varying numbers of days postseeding
| Days Postseeding |
|||||
|---|---|---|---|---|---|
| 3 | 4 | 5 | 6 | 7 | |
| TEER, Ω·cm2 | 127.5±22.7 | 222.8±14.2 | 227.3±28.9 | 267.0±18.4 | 333.8±20.8 |
Values are means ± SD; average n = 6. Transepithelial electrical resistance (TEER) measurements correct for background values.
Light microscopy of transverse sections of the membrane Thincerts revealed that by days 3 and 7 postseeding, the BeWo cells had already formed confluent multilayers (Fig. 1). Even when the Thincerts were precoated with rat tail collagen and the cells were seeded at lower densities (2.2 × 10⁴ cells/cm2 and 4.4 × 10⁴ cells/cm2), it was not possible to identify a time at which an intact confluent monolayer could be observed. In fact, in our hands the areas of multilayered cells started to form even before the cells reached full confluence. Since an intact coherent cell layer is essential for transport studies, the cell multilayers obtained 7 days after seeding at a density of 8 × 10⁴ cells/cm2 were used for all subsequent experiments.
Fig. 1.
Light microscopy of cross sections of BeWo cells prepared 3 (A) and 7 (B) days after seeding at a density of 8 × 10⁴ cells/cm2 on Thincerts. The cells were fixed in 3% glutaraldehyde, dehydrated in an ethanol series, and polymerized in LR White Medium acrylic resin. Sections of 1-μm thickness were stained with toluidine blue in 1% borax (pH 11). In both A and B, A is the apical side of the cells, B is the basolateral side, and C shows the position of the membrane insert before its removal.
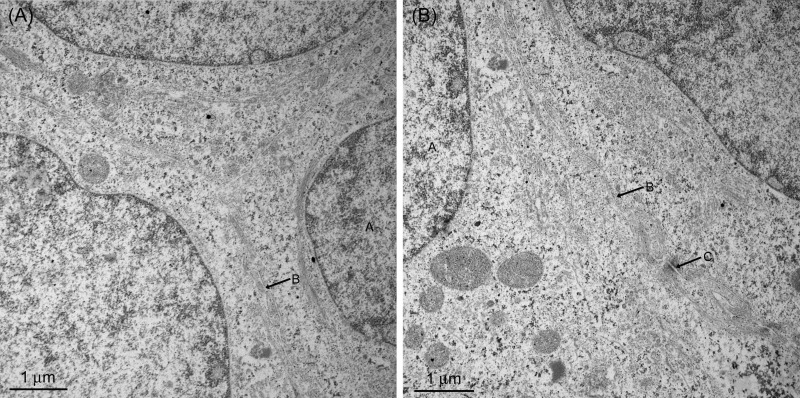
Sections were analyzed by transmission electron microscopy to examine junctions between the cells in detail. This analysis confirmed the presence of tight junctions between the cells (Fig. 2), although there was some variation across the cell layer with cells on the top layer appearing to be less tightly attached with fewer tight junctions. Cell division was visible throughout the cell layers, and, overall, the cell arrangement seemed to be fluid and changing.
Fig. 2.
Transmission electron micrographs of BeWo cell layers (cells seeded at 8 × 10⁴ cells/cm2) illustrating the presence of tight junctions between cells. Cells on filters were fixed with glutaraldehyde, postfixed in 2% aqueous osmium tetroxide, and then dehydrated through an ethanol series and acetone. The pieces were infiltrated and embedded in Spurr resin. Sections ∼75 nm thick were stained sequentially with uranyl acetate and Reynolds' lead citrate and photographed in a JEOL 1200 EX/B transmission electron microscope at 80 kV. In both A and B, A is the cell nucleus, B indicates tight junctions, and C indicates desmosomes.
Passive diffusion across the BeWo cell layer.
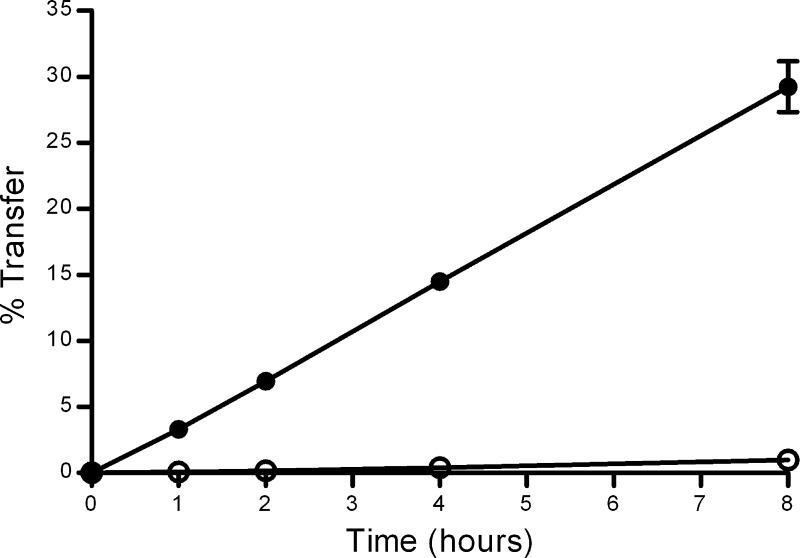
Mannitol was used as a marker of passive diffusion for low-molecular-weight species (such as free iron) and FD-70 for high-molecular-weight species (such as Tf). The rate of passive transfer of mannitol across the BeWo cell layer was high (Fig. 3). After 8 h of incubation, ∼30% of the [14C]mannitol added to the apical chamber had transferred to the basolateral chamber. In contrast, transfer of FD-70 across the BeWo cell layer was far more limited, with only ∼1% being transferred to the basolateral side after 8 h.
Fig. 3.
Relative rates of passive transfer of [14C]mannitol and fluorescein-labeled dextran T70 (FD-70) from the apical to the basolateral side of BeWo cells grown on permeable supports in bicameral chambers. Lines indicate means ± SD (n = 6) for percentage transfer FD-70 (○) and [14C]mannitol (•) in the presence of BeWo cells.
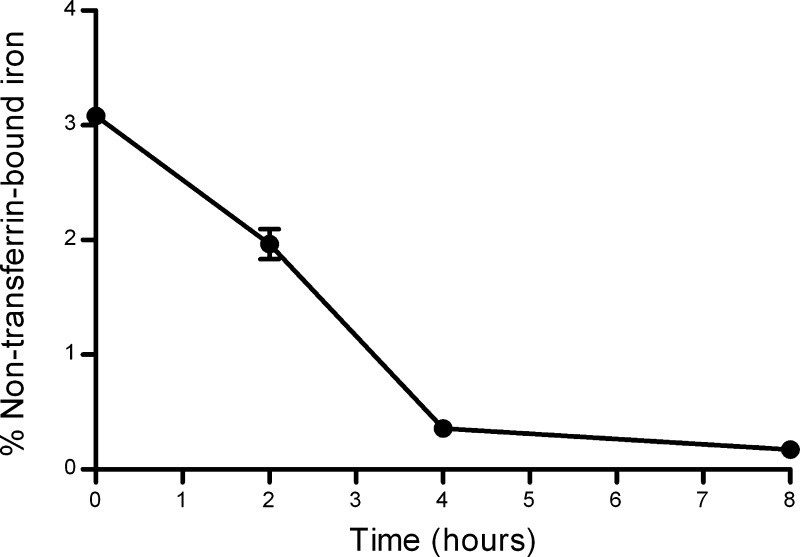
These results are in agreement with those reported previously demonstrating that passive diffusion across BeWo cells is highly dependent on molecular size (15). As a result, any non-Tf-bound soluble iron that may be present in the culture system might be expected to diffuse readily across the cell layer, whereas passive diffusion of Tf-bound iron is likely to be minimal. For this reason, we assessed the stability of the 55Fe-Tf preparations, which were to be used for the transport studies, during incubation in the culture media to test whether degradation of the Tf or dissociation of the iron might lead to the production of free iron over time. We did not observe any production of low-molecular-weight forms of 55Fe (<30 kDa based on ultrafiltration analysis) during 8 h of incubation of 55Fe-Tf in BSS, either in the presence or absence of BeWo cells. However, we did find that, while binding of iron to apo-Tf under the conditions used to produce the 55Fe-Tf preparations was rapid (∼97% bound immediately based on analysis by centrifugal ultrafiltration), a small fraction of added iron remained in the unbound form for 2–4 h after mixing of the components (Fig. 4). After making this observation, all 55Fe-Tf-FITC preparations were left for at least 2 h after production to maximize iron binding and were then subjected to one round of diafiltration, using an ultrafiltration unit, removing ∼90% of any remaining unbound iron before use. Adoption of this protocol led to a moderate reduction in the apparent rates of iron transport across BeWo cell layer (before this, the apparent rate of iron transport across the cell layer was determined to average 44.8 ± 11.2 pmol·cm−2·h−1 compared with an average of 38.8 ± 2.1 pmol·cm−2·h−1 using the diafiltered preparation; see below), suggesting that the presence of any unbound iron in the system could indeed lead to the generation of anomalous data.
Fig. 4.
Quantification of low-molecular-weight forms of iron in 55Fe-transferrin preparations over time. Aliquots of freshly prepared 55Fe-containing holo-transferrin were loaded into ultrafiltration spin-columns with a nominal molecular mass cutoff of 30,000 Da. The samples were centrifuged at 12,000 g for 12 min at room temperature, and the radioactivity in the flow-through was determined by scintillation counting. Error bars indicate means ± SD (n = 4).
Forward transport studies.
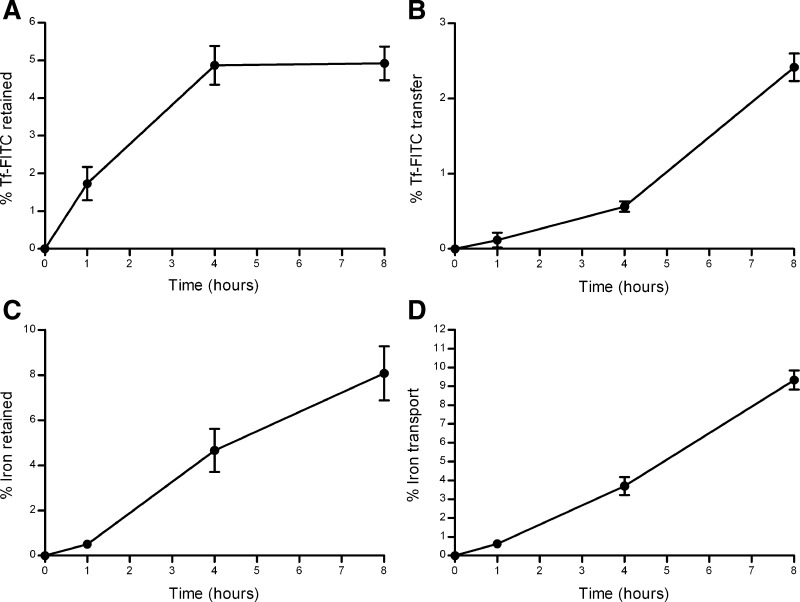
Experiments using 55Fe bound to Tf-FITC were undertaken to determine the relative flux of iron and Tf into and through the cell layer. These experiments demonstrated moderate levels of Tf retention within the cells and comparatively low levels of transfer across the cell layer (Fig. 5, A and B). Cellular-retained Tf increased steadily before reaching an apparent plateau of 4.9 ± 0.5% (means ± SD) of the total added Tf by 4 h (equivalent to an average of 20.4 ± 2.1 pmol·cm−2·h−1). Transfer of Tf increased more slowly in an approximately linear fashion over the entire time course, reaching 2.4 ± 0.2% after 8 h (equivalent to an average of 5.0 ± 0.4 pmol·cm−2·h−1).
Fig. 5.
Forward transport experiment: cellular accumulation (A) and transfer across a BeWo cell layer (B) of transferrin (Tf) derived from 55Fe-containing holo-transferrin labeled with fluorescein and cellular accumulation (C) and transfer across a BeWo cell layer (D) of iron derived from 55Fe-containing holo-transferrin labeled with fluorescein added to the apical chamber and followed over an 8-h time course. Error bars indicate means ± SD (n = 5).
Unlike Tf, the cellular content of iron continued to increase for the full duration of the experiment (Fig. 5, C and D), reaching 8.1 ± 1.2% of the total iron added to the apical chamber (equivalent to an average of 33.8 ± 5.0 pmol·cm−2·h−1) after 8 h. The rate and extent of iron transfer across the cell layer far exceeded that of Tf, increasing in an approximately linear fashion to reach 9.3 ± 0.5% (equivalent to an average of 38.8 ± 2.1 pmol·cm−2·h−1) of total added iron after the 8-h time course.
Reverse transport studies.
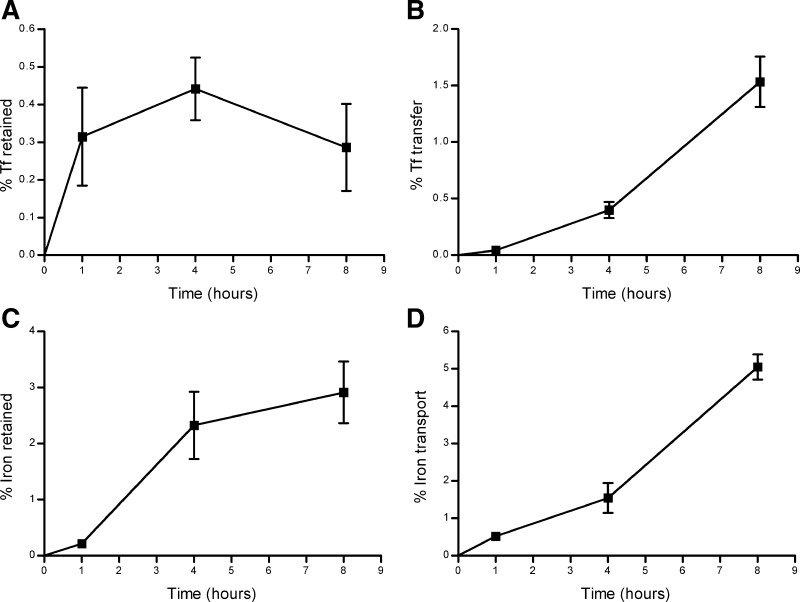
Using the same format of experiment as described above, reverse transport was investigated by adding the 55Fe-Tf to the basolateral side of the BeWo cells to determine the flux of iron and Tf in the reverse direction. After the first 4 h of the experiment, the Tf retained within the cells was 0.4 ± 0.1% (equivalent to an average rate of accumulation of 3.1 ± 0.6 pmol·cm−2·h−1). However, at 8 h the percentage retained had decreased to 0.3 ± 0.1% (equivalent to an overall average rate of accumulation of 1.6 ± 0.8 pmol·cm−2·h−1) (Fig. 6A). The rate of reverse Tf transfer appeared to follow an approximately linear pattern over the full-duration time course studied and reached 1.5 ± 0.2% after 8 h (equivalent to an average of 5.3 ± 0.7 pmol·cm−2·h−1) (Fig. 6B).
Fig. 6.
Reverse transport experiment: cellular retention (A) and transfer across a BeWo cell layer (B) of transferrin derived from 55Fe-containing holo-transferrin labeled with fluorescein and cellular retention (C) and transfer across a BeWo cell layer (D) of iron derived from 55Fe-containing holo-transferrin labeled with fluorescein added to the basolateral chamber and followed over an 8-h time course. Error bars indicate means ± SD (n = 5).
The percentage of iron retained within the cells had reached 2.3 ± 0.6% of the total added iron after 4 h (equivalent to average rate of accumulation of 19.4 ± 5.0 pmol·cm−2·h−1). However, unlike Tf, the cellular content iron continued to increase for the full duration of the experiment (Fig. 6C), reaching 2.9 ± 0.5% of the total iron added to the apical chamber after 8 h (equivalent to an average accumulation rate of 21.1 ± 2.3 pmol·cm−2·h−1). As for the forward transport, the rate and extent of reverse iron transfer across the cell layer far exceeded that of Tf, increasing in an approximately linear fashion to reach 5.0 ± 0.34% (equivalent to an average of 20.3 ± 1.55 pmol·cm−2·h−1) of total added iron after the 8-h time course (Fig. 6D).
Kinetic modeling.
The data obtained for transport of Tf and iron into and across the cell layer were subjected to analysis by kinetic modeling. A three-compartment (apical, intracellular, and basolateral) model was employed that used both the iron and Tf data.
Forward transport models.
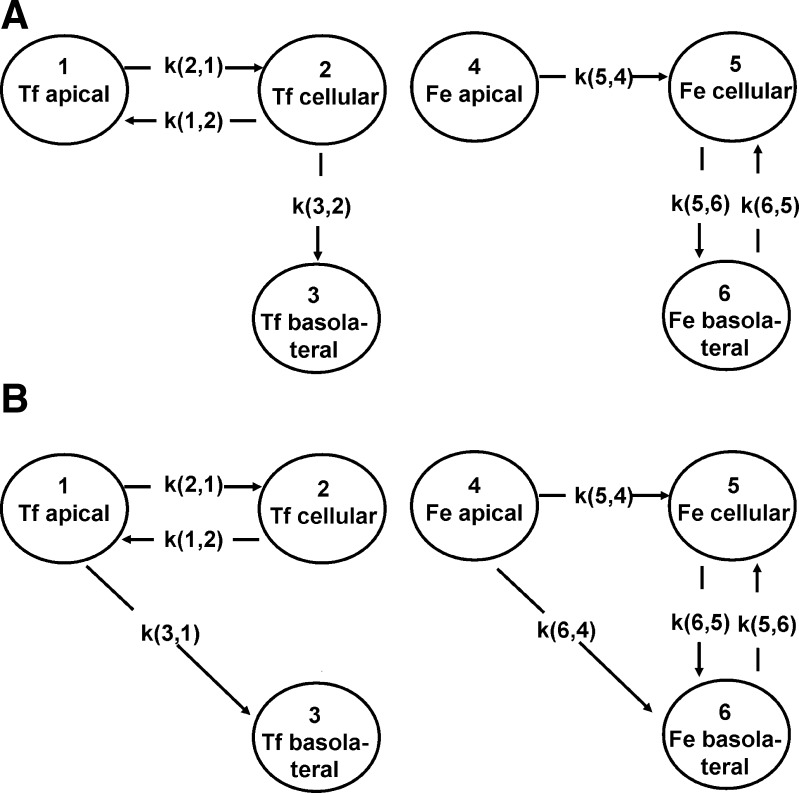
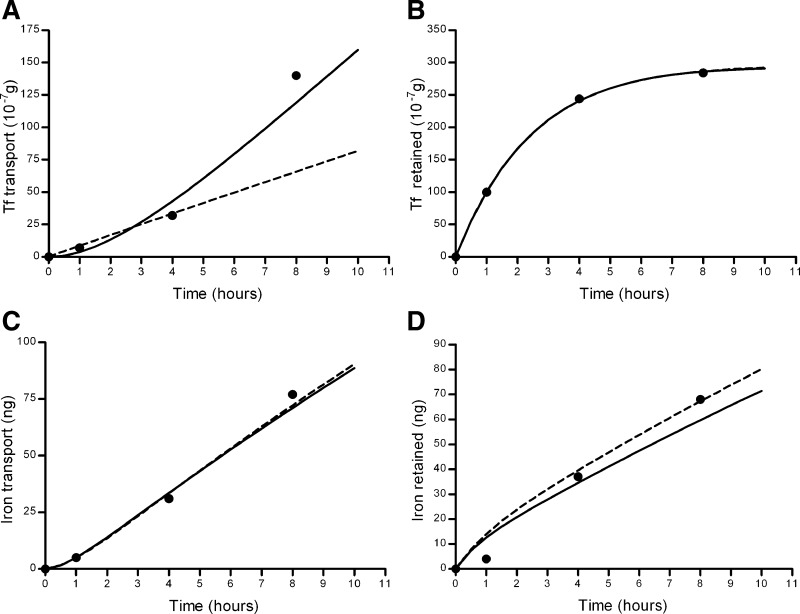
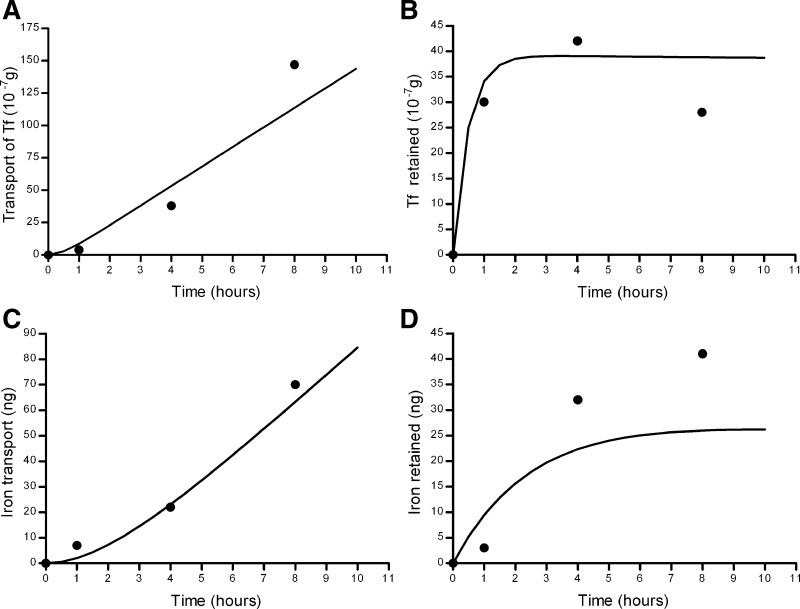
A total of 11 different models, each involving different combinations of paracellular and transcellular transport, were examined. The different models were compared, and the best fit of the data was chosen by visual inspection of the predicted versus the actual data (Figs. 7 and 8), the coefficients of variation of the estimated parameters (rate constants), and the Akaike information criteria (AIC) values (24). Two closely competing models were identified as providing the best fits (Fig. 7, A and B). In both of the models the rate constants for iron and Tf transport from the apical to the cellular compartment were identical (0.021 h−1), supporting a hypothesis for a common mechanism, probably receptor-mediated uptake of holo-Tf.
Fig. 7.
Best-fit kinetic models (defined using SAAM II modeling software) for apical-to-basolateral transport/transfer of iron and transferrin. A: model 1. Rate constants (means ± SD) are as follows: k(1,2), 0.31288 ± 0.0226 h−1[coefficient of variation (CV) 7.2%]; k(2,1), 0.02144 ± 0.000296 h−1 (CV 1.4%); k(3,2), 0.07052 ± 0.0187 h−1 (CV 26.5%); k(5,4), 0.02114 ± 0.000296 h−1 (CV 1.4%); k(5,6), 0.60056 ± 0.197 h−1 (CV 32.8%); k(6,5), 0.86517 ± 0.14 h−1 (CV 16.3%). Akaike information criteria value for model 1 = 3.81. B: model 2. Rate constants are k(1,2), 0.38648 ± 0.0104 h−1 (CV 2.7%); k(2,1), 0.0212 ± 0.000343 h−1 (CV 1.62%); k(3,1), 0.00148 ± 0.000386 h−1 (CV 26%); k(5,4) 0.0212 ± 0.000343 h−1 (CV 1.62%); k(5,6), 0.44688 ± 0.155 h−1 (CV 34.8%); k(6,4), 0.00148 ± 0.000386 h−1 (CV 26%); k(6,5), 0.60281 ± 0.18 h−1 (CV 19.6%). Akaike information criteria value for model 2 = 3.84.
Fig. 8.
Graphs displaying predicted versus actual data for forward transport models 1 and 2. A: transfer of Tf to the basolateral side. B: Tf retained within the cells. C: transport of Fe to the basolateral side. D: Fe retained within the cells. Solid line, predicted values for model 1; dashed line, predicted values for model 2; •, actual values.
According to model 1, all of the iron passes through the cell layer via a transcellular route and none by paracellular diffusion. This model also predicts that there is no paracellular diffusion of Tf. Instead, the Tf that is taken up into the cells is predominantly recycled back to the apical compartment (rate constant 0.31 h−1), with only a small proportion transported to the basolateral compartment (rate constant 0.07 h−1).
Model 2 is essentially very similar to model 1 except that it predicts that there is a degree of passive diffusion of Tf and iron through the cell layer. However, the rate constant is much smaller than that for Tf and iron movement into the cells (rate constant for paracellular route = 0.0015 h−1 compared with 0.021 h−1 for movement of Fe-Tf into the cells). Both models fit the data well, with model 1 having only been marginally better on the basis of the slightly smaller AIC value. However, the overall interpretation of both models is similar and entirely consistent with the known mechanism of Tf receptor-mediated transport.
Additionally, both models indicate that iron released into the basolateral compartment may then be taken up at the basolateral surface and imported back into the cell. The mechanism involved and the significance of this prediction are not clear.
Reverse transport model.
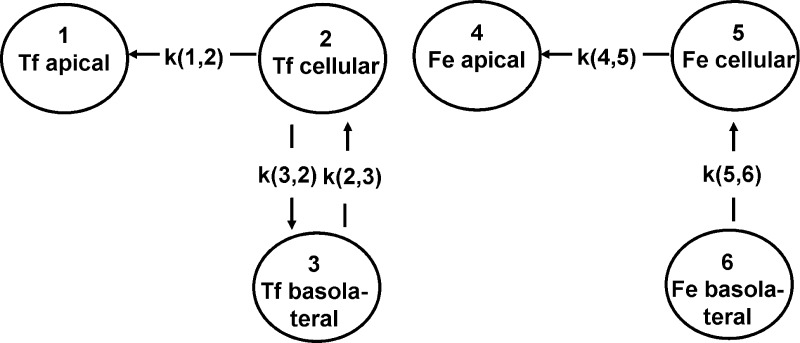
For the reverse transport, as with the forward, the data were modeled separately for the iron and Tf in the first instance. This produced one satisfactory model for the Tf and three alternatives for the iron. When the iron and Tf data were fitted simultaneously, one model emerged clearly as the best fit of the data (Figs. 9 and 10). According to this combined model, Fe-Tf is taken up into the cells from the basolateral compartment. The iron associated with this Fe-Tf is transported through the cells into the apical compartment. The majority of the Tf is recycled back to the basolateral compartment, but a significant proportion is also transported through the cells to the apical compartment. Overall, this process appears similar to model 1 for the forward transport process described above but with three notable differences: the rate of uptake of Fe-Tf at the basolateral membrane in the reverse transport model (apparent rate constant 0.008 h−1) is substantially lower than the rate of uptake at the apical membrane in the forward transport models (0.02 h−1); a higher proportion (∼10 times) of the Tf that is taken up into the cells from the basolateral compartment, compared with Tf taken up from the apical compartment, is transported across the cell layer rather than recycled back to the original compartment; iron derived from Fe-Tf added to the apical compartment that is transported through the cells into the basolateral compartment appears to be readily taken back up into the cells. The first two of these apparent discrepancies suggest that there is a degree of polarization of both iron and Tf transport across the BeWo cell layer, favoring iron transport to the basolateral compartment and Tf transport to the apical. The third difference may be due to the fact that iron transported from the apical to basolateral compartment will no longer be bound to Tf and, therefore, must be taken up into the cells via an entirely different mechanism.
Fig. 9.
Best-fit kinetic model (defined using SAAM II modeling software) for reverse transport/transfer (basolateral to apical) of iron and transferrin. Rate constants (means ± SD) are as follows: k(1,2), 0.38778 ± 0.089 h−1 (CV 23.0%); k(2,3), 0.00827 ± 0.0015 h−1 (CV 18.1%); k(3,2), 1.6326 ± 0.46 h−1 (CV 28.1%); k(4,5), 0.4067 ± 0.15 h−1 (CV 36%); k(5,6), 0.00827 ± 0.0015 h−1 (CV 18.1%). Akaike information criteria value for model = 4.25.
Fig. 10.
Graphs displaying predicted versus actual data for reverse transport model. A: transfer of Tf to the apical side. B: Tf retained within the cells. C: transport of Fe to the apical side. D: Fe retained within the cells. Solid line, predicted values for model; •, actual values.
DISCUSSION
It proved extremely difficult to establish cell seeding and growth conditions that consistently produced intact BeWo cell monolayers. Instead, we were only able routinely to achieve complete confluence after the cells had started to grow into multilayered structures. Liu and coworkers (15) reported the production of confluent BeWo cell monolayers on day 5 after seeding onto membrane supports, but they also reported the formation of cell multilayers by day 7 postseeding. Thus, it seems that obtaining intact confluent monolayers proves to be technically demanding primarily because the BeWo cells do not undergo inhibition of growth on contact, and even if a perfect monolayer can be obtained it will only exist transiently. The integrity of the cell layer is critical if the BeWo cells grown on membrane supports are to be used for nutrient transport studies. Therefore, we decided that the most robust option was to work with the cell multilayers rather than risk the presence of gaps in a cell monolayer. Under these conditions, we were able to demonstrate the presence of tight junctions between the cells, confirming the validity of the TEER measurements.
The presence of multilayered cellular structures might be expected to slow nutrient transport compared with a monolayer and could cause problems with polarization of the cells. However, in the case of iron, the transport rate across the BeWo cell layer was comparable, for example, with reported rates of transport across fully differentiated monolayers of the widely used Caco-2 cell model of intestinal epithelium (2).
We were concerned that the apparently high level of iron transport observed with the BeWo cells might reflect passive diffusion or a combination of active and passive transport rather than active transcellular transport. Therefore, we used a variety of experimental approaches to determine the contribution of paracellular passive diffusion of iron to the total apparent transport across the cell layer measured in our model system. Data generated using different markers of passive diffusion were in close agreement with those reported previously by Liu and coworkers (15) and suggest that BeWo (b30 subclone) cells form a molecular-weight-selective barrier and that the passive permeability of the selected hydrophilic markers is highly dependent on molecular size. This property might be considered to reflect the properties of placenta in vivo.
For the purposes of our studies with iron, these findings suggest that if free iron were added to the culture system, it might diffuse readily across the cell layer. However, free iron is not normally present in the bloodstream. Instead, iron is transported around the body and delivered to the placenta in a Tf-bound form from where it is taken up by a receptor-mediated mechanism. Therefore, we used Fe-Tf as the sole source of iron for all the studies described here. We demonstrated that the rate of passive diffusion of intact Tf across the BeWo cell layer is negligible compared with the rate of iron transport. Furthermore, Fe-Tf added to the culture system appeared to be stable for at least the duration of the longest incubation periods used in these experiments, suggesting that progressive release of iron from Tf in the medium during the course of the experiments was not a significant factor. We observed that the binding of iron by Tf in vitro requires 2 to 4 h to reach completion. Following this discovery, in all subsequent experiments, holo-Tf was prepared in advance. This change in protocol led to a marked reduction in the apparent rate of iron transport across the cell layer, reinforcing the likelihood that free iron can pose a problem in this in vitro model if appropriate precautions are not taken.
Mathematical modeling of the forward transport data from experiments using the revised protocol provided an overview of the apparent transport mechanism of Tf-bound iron in the BeWo cell system. This matched perfectly with the known aspects of Tf receptor-mediated uptake of iron in which holo-Tf binds to the Tf receptor and is internalized. Iron is released from the receptor complex within endosomes as a result of acidification of the endosomal environment. The free iron is removed from the endosomes for transport into and across the cell, while the apo-Tf is recycled together with the Tf-receptor predominantly back to the cell surface, where it is released again. The best-fit models suggested that all the iron passing through the cell layer was doing so via this transcellular process.
The model derived from the reverse Fe-Tf transport data suggested that iron also can be transported from the basolateral side, through the cells, to the apical compartment in much the same way that it is transported in the opposite direction. It is important to appreciate that the rate constants produced by the compartmental modeling process do not represent rigorously determined rate constants such as those that could be obtained via classical kinetic studies. Instead, the compartmental modeling process produces rate constants that best describe the fluxes of analytes (iron or Tf in this instance) between the different compartments of the system under the specific conditions set up for the experiment thereby providing a complete overview of the entire process and indicating possible mechanisms involved.
In the particular cases of the rate constants estimated for transport of Fe-Tf from the apical compartment into the cells in the forward transport analysis and from the basolateral compartment into the cells for the reverse transport analysis, the experimental conditions were identical (5 μM holo-Tf added to the exclusively apical or basolateral compartment for the forward or reverse transport analyses, respectively). Therefore, it should be valid to compare directly the rate constants calculated for these two specific processes. This comparison demonstrates that the rate of Fe-Tf uptake at the basolateral membrane is substantially lower than at the apical surface. This suggests that Tf receptor-mediated transport of iron across the BeWo cell layer, while not being as uniquely directional as expected in vivo, is nonetheless at least partially polarized to favor transport in the apical to basolateral direction.
According to the forward transport model, iron that has been transported from the apical to basolateral compartment is taken back up into the cells at a comparatively rapid rate. At first sight, this might appear to conflict with the conclusions drawn from the modeling of reverse transport in which transport of iron into the cells from the basolateral compartment was much slower. However, the forward transport model suggests it is non-Tf-bound iron that is released into the basolateral compartment, whereas the reverse model is based on the movement of Fe-Tf added to the basolateral compartment of the system. Therefore, the difference in the form of iron may account for the apparent discrepancy. It would not be feasible to test this further by adding non-Tf-bound iron to the basolateral compartment, since we have demonstrated that this could also rapidly diffuse in a paracellular fashion across the cell layer and thereby give anomalous results. However, the observation that free iron transported into the basolateral chamber may subsequently be taken back up into the cells is not likely to be of any physiological significance since iron transported across the placenta in vivo will be rapidly bound to Tf.
In conclusion, the b30 subclone of BeWo cells forms confluent multilayers that may be used for nutrient transport studies under certain controlled conditions. Free iron is likely to undergo paracellular diffusion across the BeWo cell layer readily. However, Fe-Tf, the physiological form in which iron is transported around in the blood, does not undergo significant paracellular diffusion. Instead, according to our analysis, confluent BeWo cell layers grown in bicameral chambers are very proficient at Tf-receptor-mediated transport of iron, preferentially transporting iron from the apical to the basolateral side of the cell layer, as would be required of placental cells to meet the relatively high iron requirements of the growing fetus, while recycling the apo-Tf back to the apical side of the cells. On the basis of these findings we conclude that the b30 subclone of BeWo cells grown on membrane supports is a useful model for Fe-Tf transport studies.
GRANTS
This work was supported by a joint studentship provided by the Biotechnology and Biological Sciences Research Council (BBSRC) and the Scottish Executive Rural Affairs Department (SERAD).
Acknowledgments
We thank Dr. Helen Jones for help and guidance with the setup of BeWo cell culture. The Institute of Food Research and the Rowett Research Institute are members of NuGO, The European Nutrigenomics Organisation: linking genomics, nutrition and health research (NuGO, CT-2004-505944), a Network of Excellence funded by the European Commission's Research Directorate General under Priority Thematic Area 5 Food Quality and Safety Priority of the Sixth Framework Programme for Research and Technological Development.
The costs of publication of this article were defrayed in part by the payment of page charges. The article must therefore be hereby marked “advertisement” in accordance with 18 U.S.C. Section 1734 solely to indicate this fact.
REFERENCES
- 1.Allen LH Anemia and iron deficiency: effects on pregnancy outcome. Am J Clin Nutr 71: 1280S–1284S, 2000. [DOI] [PubMed] [Google Scholar]
- 2.Alvarez-Hernandez X, Nichols GM, Glass J. Caco-2 cell line: a system for studying intestinal iron transport across epithelial cell monolayers. Biochim Biophys Acta 1070: 205–208, 1991. [DOI] [PubMed] [Google Scholar]
- 3.Bothwell TH Iron requirements in pregnancy and strategies to meet them. Am J Clin Nutr 72: 257S–264S, 2000. [DOI] [PubMed] [Google Scholar]
- 4.Carson ER, Cobelli C, Finkelstein L. The Mathematical Modeling of Metabolic and Endocrine Systems: Model Formulation, Identification, and Validation. New York: Wiley, 1983.
- 5.Dainty JR Use of stable isotopes and mathematical modelling to investigate human mineral metabolism. Nutr Res Rev 14: 295–315, 2001. [DOI] [PubMed] [Google Scholar]
- 6.Danzeisen R, McArdle HJ. Copper and iron interactions in a placental cell line (BeWo) (Abstract). Biochem Soc Trans 26: S99, 1998. [DOI] [PubMed] [Google Scholar]
- 7.Eaton BM, Sooranna SR. In vitro modulation of l-arginine transport in trophoblast cells by glucose. Eur J Clin Invest 28: 1006–1010, 1998. [DOI] [PubMed] [Google Scholar]
- 8.Eaton BM, Sooranna SR. Transport of large neutral amino acids into BeWo cells. Placenta 21: 558–564, 2000. [DOI] [PubMed] [Google Scholar]
- 9.Godfrey KM, Barker DJ. Maternal nutrition in relation to fetal and placental growth. Eur J Obstet Gynecol Reprod Biol 61: 15–22, 1995. [DOI] [PubMed] [Google Scholar]
- 10.Gonzalez-Alvarez I, Fernandez-Teruel C, Garrigues TM, Casabo VG, Ruiz-Garcia A, Bermejo M. Kinetic modelling of passive transport and active efflux of a fluoroquinolone across Caco-2 cells using a compartmental approach in NONMEM. Xenobiotica 35: 1067–1088, 2005. [DOI] [PubMed] [Google Scholar]
- 11.Green MH, Green JB. The application of compartmental analysis to research in nutrition. Annu Rev Nutr 10: 41–61, 1990. [DOI] [PubMed] [Google Scholar]
- 12.Hosain F, Marsaglia G, Finch CA. Blood ferrokinetics in normal man. J Clin Invest 46: 1–9, 1967. [DOI] [PMC free article] [PubMed] [Google Scholar]
- 13.Jacquez JA Compartmental Analysis in Biology and Medicine (3rd ed.). Ann Arbor, MI: Biomedware, 1996.
- 14.Jones HN, Ashworth CJ, Page KR, McArdle HJ. Expression and adaptive regulation of amino acid transport system A in a placental cell line under amino acid restriction. Reproduction 131: 951–960, 2006. [DOI] [PubMed] [Google Scholar]
- 15.Liu F, Soares MJ, Audus KL. Permeability properties of monolayers of the human trophoblast cell line BeWo. Am J Physiol Cell Physiol 273: C1596–C1604, 1997. [DOI] [PubMed] [Google Scholar]
- 16.Pattillo RA, Gey GO. The establishment of a cell line of human hormone-synthesizing trophoblastic cells in vitro. Cancer Res 28: 1231–1236, 1968. [PubMed] [Google Scholar]
- 17.Pollycove M, Mortimer R. The quantitative determination of iron kinetics and hemoglobin synthesis in human subjects. J Clin Invest 40: 753–782, 1961. [DOI] [PMC free article] [PubMed] [Google Scholar]
- 18.Reynolds ES The use of lead citrate at high pH as an electron-opaque stain in electron microscopy. J Cell Biol 17: 208–212, 1963. [DOI] [PMC free article] [PubMed] [Google Scholar]
- 19.Scholl TO Iron status during pregnancy: setting the stage for mother and infant. Am J Clin Nutr 81: 1218S–1222S, 2005. [DOI] [PubMed] [Google Scholar]
- 20.Sharney L, Gevirtz NR, Wasserman LR, Schwartz L, Levitan R, Mittlemann A, Tendler D. Studies in iron kinetics. IV. Calculation of physiological parameters on the basis of multiple-pool models. J Mt Sinai Hosp NY 32: 338–368, 1965. [PubMed] [Google Scholar]
- 21.Spurr AR A low-viscosity epoxy resin embedding medium for electron microscopy. J Ultrastruct Res 26: 31–43, 1969. [DOI] [PubMed] [Google Scholar]
- 22.Van der Ende A, du Maine A, Simmons CF, Schwartz AL, Strous GJ. Iron metabolism in BeWo chorion carcinoma cells. Transferrin-mediated uptake and release of iron. J Biol Chem 262: 8910–8916, 1987. [PubMed] [Google Scholar]
- 23.Vardhana PA, Illsley NP. Transepithelial glucose transport and metabolism in BeWo choriocarcinoma cells. Placenta 23: 653–660, 2002. [DOI] [PubMed] [Google Scholar]
- 24.Wagenmakers EJ, Farrell S. AIC model selection using Akaike weights. Psychon Bull Rev 11: 192–196, 2004. [DOI] [PubMed] [Google Scholar]
- 25.Young SP, Bomford A, Williams R. The effect of the iron saturation of transferrin on its binding and uptake by rabbit reticulocytes. Biochem J 219: 505–510, 1984. [DOI] [PMC free article] [PubMed] [Google Scholar]


