Abstract
Previous studies have shown that proinflammatory cytokines, such as tumor necrosis factor (TNF), are expressed after acute hemodynamic overloading and myocardial ischemia/infarction. To define the role of TNF in the setting of ischemia/infarction, we performed a series of acute coronary artery occlusions in mice lacking one or both TNF receptors. Left ventricular infarct size was assessed at 24 h after acute coronary occlusion by triphenyltetrazolium chloride (TTC) staining in wild-type (both TNF receptors present) and mice lacking either the type 1 (TNFR1), type 2 (TNFR2), or both TNF receptors (TNFR1/TNFR2). Left ventricular infarct size as assessed by TTC staining was significantly greater (P < 0.005) in the TNFR1/TNFR2-deficient mice (77.2% ± 15.3%) when compared with either wild-type mice (46.8% ± 19.4%) or TNFR1-deficient (47.9% ± 10.6%) or TNFR2-deficient (41.6% ± 16.5%) mice. Examination of the extent of necrosis in wild-type and TNFR1/TNFR2-deficient mice by anti-myosin Ab staining demonstrated no significant difference between groups; however, the peak frequency and extent of apoptosis were accelerated in the TNFR1/TNFR2-deficient mice when compared with the wild-type mice. The increase in apoptosis in the TNFR1/TNFR2-deficient mice did not appear to be secondary to a selective up-regulation of the Fas ligand/receptor system in these mice. These data suggest that TNF signaling gives rise to one or more cytoprotective signals that prevent and/or delay the development of cardiac myocyte apoptosis after acute ischemic injury.
The thesis that cell types residing within the mammalian myocardium adapt to environmental stress by synthesizing, as well as by responding to, a variety of endogenous stress-induced protein factors was first suggested by a series of thoughtful studies in hemodynamically overloaded canine hearts (1). Although these seminal studies did not succeed in identifying the nature of the stress-induced proteins, subsequent reports have identified the biochemical nature of at least some of these myocardium-derived protein factors, such as acidic and basic fibroblast growth factor, platelet-derived growth factor, transforming growth factor β, vascular endothelium-derived growth factor, angiotensin II, and heat shock proteins. (2–5). Although the role that these endogenous stress-induced proteins play is not known, it has been suggested that they may contribute to the myocardial growth/remodeling and angiogenesis that occur after tissue injury. Moreover, it has also been shown recently that the myocardium is capable of synthesizing a variety of cytoprotective factors in response to ischemic injury, including adenosine, bradykinin, and nitric oxide (6–8). Thus, taken together, the extant literature suggests that the myocardial response to environmental stress comprises at least two interdependent homeostatic mechanisms: one that allows this tissue to delimit cell injury through up-regulation of cytoprotective factors and a second that facilitates tissue repair when and if these cytoprotective responses are insufficient to prevent cell death. However, the mechanisms that are responsible for orchestrating these different stress responses within the myocardium are not known.
Germane to the above discussion is the recent observation that several proinflammatory cytokines, including tumor necrosis factor (TNF), IL-1, and IL-6, are expressed within the myocardium in response to either mechanical overload or ischemic injury (9–11). Although the precise role that these stress-activated cytokines play in the myocardium is not known, two separate lines of evidence suggested the intriguing possibility that TNF signaling might confer a beneficial homeostatic response within the myocardium. First, previous in vitro and ex vivo studies suggested that TNF is sufficient to protect cardiac myocytes against either hypoxic or ischemic injury, respectively (12, 13). Second, TNF provokes the expression of cytoprotective antiapoptotic factors in a variety of mammalian cell types (14). Accordingly, to more precisely define the role of TNF signaling within the myocardium, we performed a series of acute coronary artery occlusions in mice lacking one or both TNF receptors.
Methods
Characterization of the Experimental Model.
TNF receptor (TNFR)-deficient mice.
The p55 (TNFR1)-deficient and p75 (TNFR2)-deficient mice were generated through targeted disruption of the p55 or p75 alleles by using homologous recombination, as reported previously (15). Appropriate crosses of the TNFR1- and TNFR2-deficient mice were performed to generate the double TNFR1/TNFR2-deficient mice, and these deficiencies were maintained on a random C57BL/6 × 129/SvEv hybrid (F1) background (15). Parental C57BL/6 and 129/SvEv mice were obtained from Harlan–Sprague–Dawley and from Taconic Farms, respectively.
Left ventricular structure and coronary artery anatomy.
Left ventricular (LV) structure was characterized in naive (i.e., nonischemic) mice by using two-dimensional directed M-mode echocardiography and light microscopy, as reported previously (16, 17). Mice from each group were imaged by using a 7.5-MHz transducer. Images were captured and stored by using computer eyes software (Video Digitizer, Dedham, MA) and analyzed by using optimas image analysis software (Silver Spring, MD). Measurements of the LV end-diastolic and end-systolic dimension and LV septal and posterior wall thickness were made from the parasternal long axis view by using the leading-edge-to-leading-edge technique adopted by the American Society of Echocardiography. Heart tissue was perfusion fixed in buffered formalin and embedded in paraffin; the sections were stained with hematoxylin and eosin for routine histological examination (17). To assess the coronary artery anatomy of the mice, we performed coronary artery casting (18).
Effect of Acute Coronary Artery Occlusion on Infarct Size.
Experimental model.
Ligation of the left anterior descending (LAD) coronary artery was performed according to the method of Michael et al. (18). Briefly, 12- to 16-week-old mice were anesthetized by an i.p. injection of pentobarbital (0.04 mg/g). The animals were intubated, a median sternotomy was performed, the LAD was identified, and an 8-0 proline suture was passed around the artery and then subsequently tied off. The chest wall was then closed, and the animal was allowed to recover under a heat lamp, receiving oxygen via nasal cone. The body temperature was continuously monitored and maintained between 35°C and 36°C throughout the procedure.
Assessment of infarct size.
Twenty-four hours after ligation of the LAD artery, the mice were killed, and their hearts were removed. The ascending aorta was cannulated with a 22-gauge tubing adapter, and 1% Evans blue was perfused into the aorta and coronary arteries to delineate the “area at risk.” The Evans blue dye was uniformly distributed to those areas of the myocardium proximal to the ligature; hence, the area of the myocardium that was not stained with Evans blue was defined as the area at risk. The LV was then separated from the rest of the heart, weighed, and sliced in a bread loaf fashion into four separate sections (slices), with the first slice at the level of the ligature. Each section was weighed separately, then incubated in 1.5% triphenyltetrazolium chloride (TTC) for 30 min. After TTC staining, the area of infarction appears pallid, whereas the viable myocardium appears red. To calculate infarct size/weight, both sides of each of the three myocardial slices were photographed, and the area of infarction for both sides of each section was determined by computerized planimetry. The area of infarction for each of the three slices was determined by taking the average of the area of infarction of the basal and apical side of each myocardial slice. Infarct weight was determined as follows: [(A1 × WT1) + (A2 × WT2) + (A3 × WT3) + (A4 × WT4)], where A is the area of infarction for the slice represented by the subscript and WT is the weight of that respective section. The weight of the area at risk was calculated in a similar fashion, by subtracting the weight of the LV that stained blue, which was determined by planimetry and the above equation, from the total LV weight. Infarct size was then expressed as a percentage of the area at risk by using the following equation: (WT of infarction/WT of area at risk) × 100; and the area at risk as a percentage of LV was calculated by using the following equation: (WT of area at risk/WT of LV) × 100.
Mechanisms Responsible for Infarct Size.
Anti-myosin Ab immunostaining.
To determine the area of necrosis, we modified the method of Kajstura et al. (19), which utilizes anti-myosin Ab uptake by the cytoplasm of necrotic myocytes. Anti-myosin labeling was performed by first injecting 0.1 mg of mouse mAb to cardiac myosin heavy chains (Accurate Chemicals) i.v. via a jugular line, 1 h before LAD artery occlusion. The animals were killed at 3, 6, or 24 h after LAD artery occlusion, and the hearts were perfusion fixed in 10% formalin. The LV was separated from the rest of the heart, weighed, and sliced in a bread loaf fashion as described above. The extent of necrotic tissue was determined within the area at risk (i.e., distal to the LAD ligature) by using a secondary biotinylated anti-mouse Ab (1:100 for 30 min) that was detected by an avidin-biotin-complex method (Vectastain ABC kit; Vector Laboratories) that employs peroxidase as the enzyme label and AEC red as the chromogenic substrate.
Assessment of the extent of myocardial necrosis.
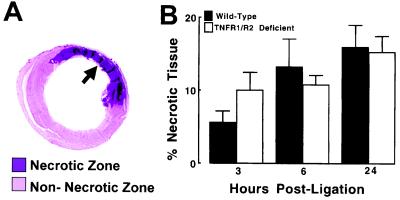
Myocardial tissue sections were photographed at ×4, and the area of necrosis was determined by planimetry of the area of the myocardium that stained positively for the anti-myosin Ab. The weight of the necrotic area was determined by using the following equation: weight of necrotic tissue = (A1 × WT1) + (A2 × WT2) + (A3 × WT3) + (A4 × WT4), where A is the area of necrosis for the section represented by the subscript and WT is the weight of that respective section. The percentage of necrotic LV was determined by dividing the weight of the necrotic tissue by the total LV weight and multiplying by 100. For the purpose of this investigation, we defined the “necrotic zone” as the region of the myocardium within the area at risk that stained positively with the anti-myosin Ab, and the nonnecrotic zone as the area of myocardium within the area at risk that was not stained with the anti-myosin Ab.
In situ PCR ligation.
To determine the frequency of cardiac myocyte apoptosis, we used an in situ ligation method that identifies only double-strand DNA breaks either with blunt ends or with single base pair overhangs, which are thought to be more characteristic of the DNA breaks that occur during apoptosis (20, 21). This technique offers a potential advantage over the terminal deoxynucleotidyltransferase technique, insofar as the terminal deoxynucleotidyltransferase technique will label single-strand DNA breaks that are not indicative of apoptosis (e.g., DNA repair), as well as double DNA strand breaks in necrotic tissue (20, 21). This method permitted a more reliable assessment of the extent of apoptosis in areas where extensive necrosis was ongoing. The in situ ligation method was performed according to the method described by Didenko and Hornsby, by using digoxigenin-labeled DNA probes and an alkaline phosphatase reporter system (20).
Assessment of the frequency of cardiac myocyte apoptosis.
The frequency of apoptosis in the myocardial sections was determined by enumerating the number of ligase-positive cardiac myocyte nuclei labeled per unit area of myocardium within the necrotic zone and within the nonnecrotic zone. A total of 30 randomly selected fields within the infarct and 30 randomly selected fields within the noninfarct zones were examined. To determine the fraction of myocyte nuclei that were labeled, we determined the total number of myocyte nuclei per unit area of the myocardium (10,000 μm2) by enumerating the number of 4′,6-diamidino-2-phenylindole (DAPI)-stained myocyte nuclei; final results were expressed as follows: (number of positively labeled nuclei/total number of DAPI-stained nuclei per 10,000 μm2) × 100.
Fas ligand/receptor system.
To determine whether there was a selective up-regulation of countervailing “death domain” ligand/receptor systems in the TNFR1/TNFR2-deficient mice, we examined the gene expression of the Fas ligand/receptor system (22). Three hours after acute LAD occlusion or a sham operation, the hearts from the wild-type and TNFR1/TNFR2-deficient mice were removed, and total RNA was isolated. The Fas ligand/receptor system was examined by using a MultiProbe Riboquant ribonuclease protection assay (PharMingen). Autoradiography was performed, and the gel images were quantified by using laser densitometry and imagequant software (Molecular Dynamics).
Statistical analysis.
Data are expressed as the mean ± SE. One-way ANOVA was used to evaluate mean differences in echocardiographic indices, infarct size, and area at risk between wild-type, TNFR1, TNFR2, and TNFR1/TNFR2 mice. Two-way ANOVA was used to assess differences in the frequency of apoptosis and area of necrosis in the wild-type and TNFR1/TNFR2-deficient mice. Where appropriate, post hoc comparison testing was performed to test for differences between con- trol and experimental group (Dunnett's test) or to compare differences between experimental groups (Duncan's test). A Bonferroni t test was used to evaluate mean differences in the average frequency of apoptosis. Significant differences were said to exist at P < 0.05.
Results
Characterization of the Experimental Model.
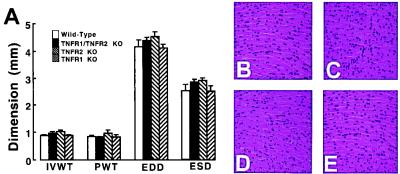
With respect to LV structure and coronary artery anatomy, Fig. 1A shows that there was no significant difference in the interventricular septal thickness, posterior wall thickness, end-diastolic dimension, and end-systolic dimension between the different groups of wild-type and TNFR-deficient mice (P > 0.05 by ANOVA). Representative examples of the histology of the hearts from the wild-type and TNF receptor-deficient mice are depicted in Fig. 1 B–E. There was no obvious difference in the morphological appearance of the myocardium between the groups of mice. Similar findings were observed in four additional sets of wild-type and TNFR-deficient mice. A qualitative assessment of the coronary artery casts disclosed no obvious differences in the either the number or distribution of the coronary vessels between the different groups of mice (data not shown).
Figure 1.
Myocardial structure and histology. (A) Values (mm) for LV interventricular wall thickness (IVWT), posterior wall thickness (PWT), end-diastolic dimension (EDD), and end-systolic dimension (ESD) in the wild-type, TNFR1-deficient [TNFR1 knockout (KO)], TNFR2-deficient (TNFR2 KO), and TNFR1/TNFR2-deficient (TFR1/TNFR2 KO) mice, as measured by M-mode echocardiography. (B–E) Representative hematoxylin and eosin-stained myocardial sections of wild-type mice (B), TNFR1-deficient mice (C), TNFR2-deficient mice (D), and TNFR1/TNFR2-deficient mice (E) photographed at ×400.
Effect of Acute Coronary Artery Occlusion on Infarct Size.
Assessment of infarct size.
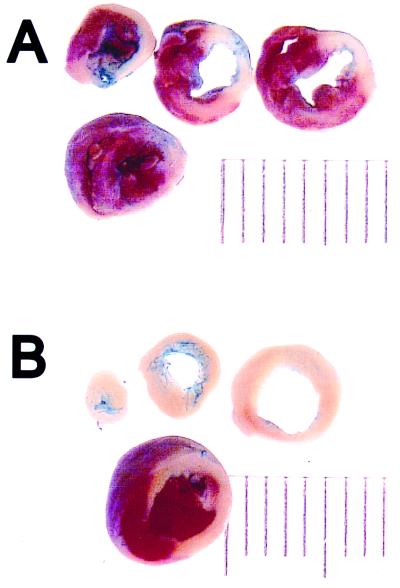
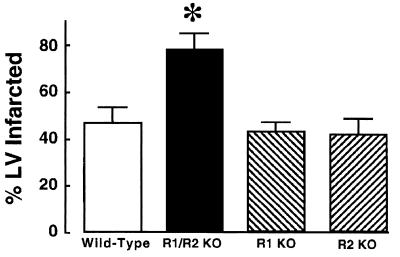
Fig. 2 depicts a representative Evans blue/TTC staining pattern in sequential myocardial sections obtained from a wild-type mouse (Fig. 2A) and a TNFR1/TNFR2-deficient mouse (Fig. 2B). The salient finding shown by this figure is that the extent of TTC staining was strikingly less in the TNFR1/TNFR2-deficient mouse when compared with wild-type mice. Fig. 3 summarizes the results of the group data with respect to the infarct size at 24 h in the wild-type (n = 8), TNFR1-deficient (n = 6), TNFR2-deficient (n = 5), and TNFR1/TNFR2-deficient mice (n = 5). The infarct size in the wild-type mice was similar to that observed in the TNFR1- or the TNFR2-deficient mice. However, the important and unexpected finding shown in Fig. 3 is that the infarct size in the TNFR1/TNFR2-deficient mice was ≈40% larger than the average infarct size in the wild-type, TNFR1-deficient, and TNFR2-deficient mice. ANOVA indicated that there was a significant overall difference (P < 0.005) in average infarct size between the different groups of mice; post hoc analysis of variance testing (Dunnett's) indicated there was a significant increase (P < 0.05) in infarct size in the TNFR1/TNFR2-deficient mice when compared with the infarct size in wild-type mice, whereas there was no significant difference (P > 0.05) in the infarct size between wild-type and TNFR1- or TNFR2-deficient mice. Because the TNFR-deficient mice colonies were maintained on a random C57BL/6 × 129/SvEv background, we also examined infarct size in wild-type C57BL/6 × 129/SvEv mice (n = 5), as well as the 129/SvEv wild-type mice (n = 8), to be certain that the differences in infarct size observed in the TNFR1/TNFR2-deficient mice were not secondary to differences in genetic strain alone. This analysis showed that the infarct size in the pure C57BL/6 wild-type mice (46.8% ± 6.9%) and the pure 129/SvEv wild-type mice (48.2% ± 7.8%) was not significantly different (P > 0.05) from that observed in wild-type control mice maintained on C57BL/6 × 129/SvEv background (35.5% ± 4.2%).
Figure 2.
Evans blue/TTC staining in wild-type and TNFR-deficient mice. Myocardial sections from wild-type TNFR mice (A) and TNFR1/TNFR2-deficient mice (B) were stained with Evans blue and TTC 24 h after acute occlusion of the LAD (see Methods for details), and the hearts were serially sectioned.
Figure 3.
Infarct size in wild-type and TNFR-deficient mice. Infarct size was determined in wild-type TNFR mice (n = 8), TNFR1/TNFR2-deficient mice (n = 5), TNFR1-deficient mice (n = 6), and TNFR2-deficient mice (n = 6). (see Methods for details) and then expressed as a percentage of the total area of the LV myocardium that was at risk (see Methods for details). ∗ = P < 0.01 compared with control values. R1/R2 KO, TNFR1/TNFR2-deficient mice; R1 KO, TNFR1-deficient mice; and R2 KO, TNFR2-deficient mice.
Assessment of area at risk.
To determine whether the above observed differences in infarct size between the TNFR1/TNFR2-deficient mice and the wild-type, TNFR1-deficient, and TNFR2-deficient mice were secondary to differences in the potential area at risk, we determined the area at risk (expressed as a total percentage of the LV) for each of these groups. There was no significant difference (P > 0.05) in the area at risk for the TNFR1/TNFR2 double-deficient mice (57.5% ± 2.2%), when compared with the wild-type mice (58.1% ± 2.6%), the TNFR1-deficient mice (44.6% ± 6.5%), or the TNFR2-deficient mice (57.5% ± 5%).
Mechanism of Cell Death After Acute Coronary Artery Ligation.
Anti-myosin Ab labeling and in situ PCR ligase staining.
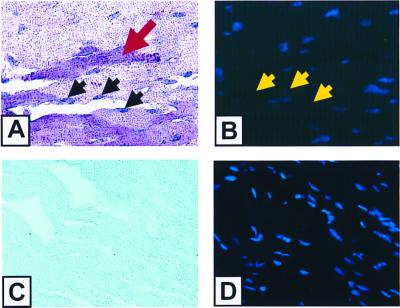
Fig. 4A depicts a representative section obtained from infarcted myocardium from a wild-type mouse. Necrotic cells that take up the anti-myosin Ab in the cytoplasm stain purplish red (red arrow). The in situ ligation technique stains apoptotic nuclei purplish blue (black arrows). To determine the percentage of apoptotic myocytes, the cells were also stained with DAPI, which emits a blue fluorescence (Fig. 4B) and thus permits the total number of nuclei to be enumerated. The nuclei that stain positively with the ligase technique have partial quenching of their DAPI fluorescence, as shown by the yellow arrows in Fig. 4B. In contrast, anti-myosin labeling and ligase staining were not detectable (Fig. 4C) in the myocardial sections from sham-operated animals, nor was there any quenching of the DAPI staining (Fig. 4D) observed in the sections from the sham-operated animals.
Figure 4.
Anti-myosin Ab immunostaining and PCR ligase staining. (A–D) Representative sections from infarcted (A and B) and sham-operated (C and D) wild-type mice. (A and C), Representative myocardial sections (×400) that were dual stained with anti-myosin Ab labeling to detect myocyte necrosis and with the PCR ligase technique to detect apoptosis. Necrotic cells take up anti-myosin Ab and stain purplish red (red arrow), whereas the in situ PCR ligase technique stains apoptotic nuclei purplish blue (black arrows). (B and D) Respective sections after counter staining with DAPI. As shown in B, nuclei that stain positively with the ligase technique have partial quenching of their DAPI fluorescence (yellow arrows). The difference in staining intensity in A and C is artifactual and is related to the greater uptake of nitroblue by the infarcted myocardium.
Assessment of the extent of myocyte necrosis.
Fig. 5 shows the extent of myocardial necrosis expressed as a percentage of the LV in the wild-type mice and TNFR1/TNFR2-deficient mice (n = 6 for each time point). A representative example of the anti-myosin Ab labeling from a myocardial section obtained immediately distal to the ligation of the LAD is illustrated in Fig. 5A. For the purpose of this investigation, we defined the “necrotic zone” as the region of the myocardium within the area at risk that stained positively with the anti-myosin Ab, and the nonnecrotic zone as the area of myocardium within the area at risk that did not stain with the anti-myosin Ab. As shown in Fig. 5B, myocardial necrosis was detectable with anti-myosin Ab labeling as early as 3 h after LAD artery occlusion and continued to increase from 6 through 24 h. Importantly, there was no significant difference in the extent of necrosis (anti-myosin Ab uptake) in the wild-type and TNFR1/TNFR2-deficient mice at 24 h. Two-way ANOVA indicated that there was no significant overall difference (P = 0.82) in the extent of infarction between groups.
Figure 5.
Percentage of necrotic myocardium in wild-type and TNFR1/TNFR2-deficient mice. The area of necrosis within the area at risk was determined by planimetry of the myocardial sections that were labeled purple by the anti-myosin Ab, as shown by the arrow depicted in A. (B) Results of group data in wild-type and TNFR1/TNFR2-deficient mice. The extent of necrosis is expressed as the percentage of necrotic tissue in the LV myocardium (see Methods).
Assessment of the extent of cardiac myocyte apoptosis.
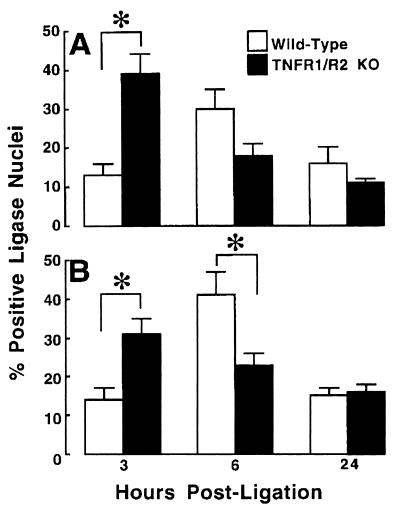
Fig. 6 A and B depicts, respectively, the frequency of apoptosis within the infarct zone and in the noninfarct zone within the area at risk, in the wild-type and TNFR1/TNFR2-deficient mice (n = 6 for each time point). The salient finding shown by Fig. 6A is that the peak frequency of apoptosis occurred earlier and to a greater extent within the infarct zone in the TNFR1/TNFR2-deficient mice than in the wild-type mice. As shown, the maximal frequency of apoptosis occurred at 3 h in the TNFR1/TNFR2-deficient mice, whereas the maximal frequency of apoptosis occurred at 6 h in the wild-type mice. Similarly, Fig. 6B shows that the greatest frequency of apoptosis occurred earlier in the noninfarct zone of the TNFR1/TNFR2-deficient mice (3 h) when compared with the wild-type mice (6 h). There was, however, no accelerated apoptosis in the regions of the noninfarct zone that were immediately adjacent to the infarct zone. Nonetheless, given that the rate of removal of apoptotic myocytes is not precisely known, the precise frequency of apoptosis cannot be determined from these studies. Two-way ANOVA indicated that there was a significant interaction over time with respect to the frequency of apoptosis (P < 0.002) between groups within the infarct zone, as well as within the noninfarct zone. Bonferroni t test indicated that the frequency of apoptosis in the infarct zone was significantly greater (P < 0.001) in the TNFR1/TNFR2-deficient mice at 3 h within the infarct and border zone, whereas there was no significant difference in the frequency of apoptosis between groups at 6 and 24 h. Within the noninfarct zone, the frequency of apoptosis was significantly greater (P < 0.001) in the TNFR1/TNFR2-deficient mice at 3 h, whereas apoptosis was significantly greater (P < 0.009) in the wild-type mice at 6 h; there was no significant difference between groups at 24 h.
Figure 6.
Frequency of apoptosis in wild-type TNFR mice and TNFR1/TNFR2-deficient mice. The frequency of apoptosis was characterized with the necrotic zone (A) and the nonnecrotic zone (B) within the area at risk. The frequency of cardiac myocyte apoptosis was expressed as a total of the number of cardiac myocytes per 10,000 μm2 of myocardium. Apoptosis was determined by using a ligase-based method (see Methods). Animals were killed at 3, 6, and 24 h after acute ligation of the LAD. ∗ = P < 0.05; KO, knockout.
Fas ligand/receptor complex.
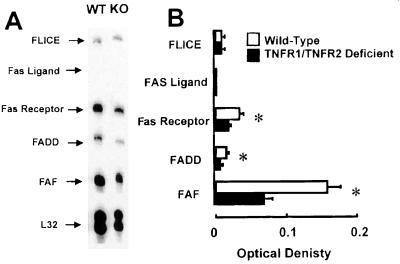
Fig. 7 shows a representative RNase protection assay of mRNA obtained from the hearts of wild-type mice (n = 4) and TNFR1/TNFR2-deficient mice (n = 4) that had undergone permanent LAD occlusion 3 h before the time of terminal sacrifice. As shown in Figure 7B the level of gene expression for Fas-associated death domain (FADD)-like ICE (FLICE) and Fas ligand were not different in the wild-type and TNFR1/TNFR2-deficient mice, whereas the level of expression of Fas-receptor, FADD, and Fas-associated factor (FAF) were significantly less in TNFR1/TNFR2-deficient mice when compared with the wild-type mice, suggesting that the increase in apoptosis in the infarcted TNFR1/TNFR2-deficient mice was not secondary to increased activation of the Fas ligand/receptor system. Further, there was no difference in gene expression for the Fas ligand/receptor expression in sham-operated controls in wild-type and TNF double knockout mice (data not shown).
Figure 7.
Fas/Fas ligand gene expression in wild-type and TNFR1/TNFR2-deficient mice. Wild-type and TNFR1/TNFR2-deficient animals underwent acute coronary artery ligation or a sham operation. The animals were killed 3 h after coronary artery ligation, mRNA was isolated from the frozen hearts, and ribonuclease protection assays were performed by using custom designed probes for murine FADD-like ICE (FLICE), Fas ligand, FADD, and Fas-associated factor (FAF). A representative ribonuclease protection assay for wild-type (WT) and TNFR1/TNFR2-deficient mice (KO) is shown in A. (B) Summary of the results of group data, expressed as the ratio of the OD of the Fas/Fas ligand-related genes normalized by the OD for L32, a housekeeping gene.
Discussion
The results of this study suggest that endogenous autocrine/paracrine myocardial TNF signaling gives rise to one or more cytoprotective signals that prevent and/or delay the development of cardiac myocyte apoptosis after acute ischemic injury. Two major sets of experimental observations support this conclusion. First, there was a striking 40% increase in infarct size in the TNFR1/TNFR2-deficient mice when compared with either wild-type, TNFR1-deficient, or TNFR2-deficient mice (Figs. 2 and 3) that had been subjected to identical coronary artery occlusions. The observed increase in infarct size in the TNFR1/TNFR2 double knockout mice did not appear to be secondary to obvious differences in cardiac structure (Fig. 1A), myocardial histology (Fig. 1B), genetic strain, or selective up-regulation of the Fas ligand/receptor system (Fig. 7), nor was it because of obvious differences in coronary artery anatomy or area at risk between the different groups of animals. Second, there was an accelerated time to onset, as well as an overall increase in the frequency of apoptosis in the TNFR1/TNFR2 double-deficient mice (Fig. 6 A and B) when compared with wild-type control mice. In contrast, there was no significant difference in the extent of necrosis between the TNFR1/TNFR2 double-deficient and wild-type mice at 24 h (Fig. 5), as defined by anti-myosin Ab labeling. Taken together, these observations suggest that the overall increase in infarct size (TTC staining) in the TNFR1/TNFR2-deficient mice was secondary to increased cardiac myocyte apoptosis, as opposed to increased myocyte necrosis.
Although this study did not identify the biological mechanisms that were responsible for the cytoprotective effects of TNF, the findings reported herein suggest that signaling through either TNFR1 or TNFR2 alone is sufficient to protect adult murine cardiac myocytes from apoptotic cell death after acute ischemic injury. These findings are consistent with a previous in vitro study, wherein we showed that selective activation of either TNFR1 or TNFR2 with receptor-specific mutated TNF ligands was sufficient to attenuate cell injury in isolated feline cardiac myocytes that had been subjected to acute hypoxic/reoxygenation injury (12). Importantly the cytoprotective effects of simultaneous activation of both TNFR1 and TNFR2 with mutated TNF ligands were indistinguishable from those provoked by stimulation of either TNFR1 or TNFR2 alone (12). Whereas it is possible that TNFR1 and TNFR2 confer cytoprotective responses through disparate signaling pathways, the simplest explanation is that TNFR1 and TNFR2 provide redundant cytoprotective signals in adult cardiac myocytes. Although the complete portfolio of cytoprotective signaling pathways that are common to both TNFR1 and TNFR2 is not known, it is interesting to note that a recently described ring finger protein, termed TNFR-associated factor 2 (TRAF 2), has been shown to be involved with both TNFR1- and TNFR2-mediated signaling. Importantly, TRAF2-mediated signaling has been shown to activate NF-κB (23), with a resultant increase in the expression of the anti-oxidant protein manganese superoxide dismutase (24, 25), as well as the cytoprotective mitochondrial protein A20 (26). Accordingly, it is tempting to speculate that the short-term cytoprotective functions of TNF are mediated, at least in part, by TRAF2-mediated signaling events. Indeed, a previous experimental study suggested that the cytoprotective effects of TNF in the setting of myocardial ischemia were mediated through TNF-induced up-regulation of manganese superoxide dismutase (13).
Conclusions
Given that primitive cytokines such as TNF have been phylogenetically conserved by both protostome invertebrate and deuterostome vertebrate species for nearly 600 million years (27), it should probably come as no great surprise that TNF might confer a survival benefit to the host organism in certain settings. This statement notwithstanding, the results of this study are important for two reasons. One is that this study suggests that proinflammatory cytokines such as TNF may play an important role in the orchestration and the timing of the myocardial stress response, both by providing early antiapoptotic cytoprotective signals that are responsible for delimiting tissue injury, as shown in the present study, and also by providing delayed signals that facilitate tissue repair and/or tissue remodeling once myocardial tissue damage has supervened. In keeping with this latter point of view, previous studies have shown that TNF is sufficient to provoke modest hypertrophic growth in cardiac myocytes (28), as well as to lead to degradation and remodeling of the extracellular matrix in the heart (17). However, it is likely that the short-term benefits of TNF may be lost if myocardial TNF expression becomes sustained and/or excessive, in which case the salutary effects of TNF may be contravened by the negative inotropic and/or cytotoxic effects of TNF. A second potentially important aspect of these studies is that they serve the heuristic purpose of focusing future studies on the cytoprotective mechanisms that are downstream from TNFR1- and TNFR2-mediated signaling. Given the intense interest in preserving cell mass in tissues that are composed of terminally differentiated cells, such as neuronal tissue and cardiac tissue, such studies may be of considerable theoretical and perhaps therapeutic interest as well.
Acknowledgments
We acknowledge the secretarial assistance of Jana Grana and the technical assistance of Jennifer Pocius. We also thank Dr. Andrew I. Schafer for his past and present support and guidance. This research was supported by research funds from the Department of Veterans Affairs and the National Institues of Health (P50 HL-O6H and RO1 HL58081-01, RO1 HL61543-01, and HL-42250-10/10).
Abbreviations
- TNF
tumor necrosis factor
- TNFR
TNF receptor
- LV
left ventricular
- LAD
left anterior descending
- WT
weight
- DAPI
4,6-diamidino-2-phenylindole
- FADD
Fas-associated death domain
Footnotes
Article published online before print: Proc. Natl. Acad. Sci. USA, 10.1073/pnas.070036297.
Article and publication date are at www.pnas.org/cgi/doi/10.1073/pnas.070036297
References
- 1.Hammond G L, Wieben E, Markert C L. Proc Natl Acad Sci USA. 1979;76:2455–2459. doi: 10.1073/pnas.76.5.2455. [DOI] [PMC free article] [PubMed] [Google Scholar]
- 2.Weiner H L, Swain J L. Proc Natl Acad Sci USA. 1989;86:2683–2687. doi: 10.1073/pnas.86.8.2683. [DOI] [PMC free article] [PubMed] [Google Scholar]
- 3.Sadoshima J I, Xu Y, Slayter H S, Izumo S. Cell. 1993;75:977–984. doi: 10.1016/0092-8674(93)90541-w. [DOI] [PubMed] [Google Scholar]
- 4.Li J, Hampton T, Morgan J P, Simons M. J Clin Invest. 1997;100:18–24. doi: 10.1172/JCI119510. [DOI] [PMC free article] [PubMed] [Google Scholar]
- 5.Yue P, Long C S, Austin R, Chang K C, Simpson P C, Massie B M. J Mol Cell Cardiol. 1998;30:1615–1630. doi: 10.1006/jmcc.1998.0727. [DOI] [PubMed] [Google Scholar]
- 6.Goto M, Liu Y, Yang X M, Ardell J L, Cohen M V, Downey J M. Circ Res. 1995;77:611–621. doi: 10.1161/01.res.77.3.611. [DOI] [PubMed] [Google Scholar]
- 7.Downey J M, Liu G S, Thornton J D. Cardiovasc Res. 1993;27:3–8. doi: 10.1093/cvr/27.1.3. [DOI] [PubMed] [Google Scholar]
- 8.Bolli R, Bhatti Z A, Tang X L, Qiu Y, Zhang Q, Guo Y, Jadoon A K. Circ Res. 1997;81:42–52. doi: 10.1161/01.res.81.1.42. [DOI] [PubMed] [Google Scholar]
- 9.Mann D L. Cytokine Growth Factor Rev. 1996;7:341–354. doi: 10.1016/s1359-6101(96)00043-3. [DOI] [PubMed] [Google Scholar]
- 10.Herskowitz A, Choi S, Ansari A A, Wesselingh S. Am J Pathol. 1995;146:419–428. [PMC free article] [PubMed] [Google Scholar]
- 11.Gwechenberger M, Mendoza L H, Youker K A, Frangogiannis N G, Smith C W, Michael L H, Entman M L. Circulation. 1999;99:546–551. doi: 10.1161/01.cir.99.4.546. [DOI] [PubMed] [Google Scholar]
- 12.Nakano M, Knowlton A A, Dibbs Z, Mann D L. Circulation. 1998;97:1392–1400. doi: 10.1161/01.cir.97.14.1392. [DOI] [PubMed] [Google Scholar]
- 13.Eddy L J, Goeddel D V, Wong G H W. Biochem Biophys Res Commun. 1992;184:1056–1059. doi: 10.1016/0006-291x(92)90698-k. [DOI] [PubMed] [Google Scholar]
- 14.Beg A A, Baltimore D. Science. 1996;274:782–784. doi: 10.1126/science.274.5288.782. [DOI] [PubMed] [Google Scholar]
- 15.Peschon J J, Torrance D S, Stocking K L, Glaccum M B, Otten C, Willis C R, Charrier K, Morrissey P J, Ware C B, Mohler K M. J Immunol. 1998;160:943–952. [PubMed] [Google Scholar]
- 16.Taffet G E, Hartley C J, Wen X, Pham T, Michael L H, Entman M L. Am J Physiol. 1997;270:H2204–H2209. doi: 10.1152/ajpheart.1996.270.6.H2204. [DOI] [PubMed] [Google Scholar]
- 17.Bozkurt B, Kribbs S, Clubb F J, Jr, Michael L H, Didenko V V, Hornsby P J, Seta Y, Oral H, Spinale F G, Mann D L. Circulation. 1998;97:1382–1391. doi: 10.1161/01.cir.97.14.1382. [DOI] [PubMed] [Google Scholar]
- 18.Michael L H, Entman M L, Hartley C J, Youker K A, Zhu J, Hall S R, Hawkins H K, Berens K, Ballantyne C M. Am J Physiol. 1995;269:H2147–H2154. doi: 10.1152/ajpheart.1995.269.6.H2147. [DOI] [PubMed] [Google Scholar]
- 19.Kajstura J, Cheng W, Reiss K, Clark W A, Sonnenblick E H, Krajewski S, Reed J C, Olivetti G, Anversa P. Lab Invest. 1996;74:86–107. [PubMed] [Google Scholar]
- 20.Didenko V V, Hornsby P J. J Cell Biol. 1996;135:1369–1375. doi: 10.1083/jcb.135.5.1369. [DOI] [PMC free article] [PubMed] [Google Scholar]
- 21.Kanoh M, Takemura G, Misao J, Hayakawa Y, Aoyama T, Nishigaki K, Noda T, Fujiwara T, Fukuda K, Minatoguchi S, et al. Circulation. 1999;99:2757–2764. doi: 10.1161/01.cir.99.21.2757. [DOI] [PubMed] [Google Scholar]
- 22.Kajstura J, Cheng W, Sarangarajan R, Li P, Li B, Nitahara J A, Chapnick S, Reiss K, Olivetti G, Anversa P. Am J Physiol. 1996;271:H1215–H1228. doi: 10.1152/ajpheart.1996.271.3.H1215. [DOI] [PubMed] [Google Scholar]
- 23.Rothe M, Sarma V, Dixit V M, Goeddel D V. Science. 1995;269:1424–1427. doi: 10.1126/science.7544915. [DOI] [PubMed] [Google Scholar]
- 24.Das K C, Lewis-Molock Y, White C W. Am J Physiol. 1995;269:L588–L602. doi: 10.1152/ajplung.1995.269.5.L588. [DOI] [PubMed] [Google Scholar]
- 25.Weiss T, Grell M, Hessabi B, Bourteele S, Muller G, Scheurich P, Wajant H. J Immunol. 1997;158:2398–2404. [PubMed] [Google Scholar]
- 26.Song H Y, Rothe M, Goeddel D V. Proc Natl Acad Sci USA. 1996;93:6721–6725. doi: 10.1073/pnas.93.13.6721. [DOI] [PMC free article] [PubMed] [Google Scholar]
- 27.Hughes T K, Jr, Smith E M, Chin R, Cadet P, Sinisterra J, Leung M K, Shipp M A, Scharrer B, Stefano G B. Proc Natl Acad Sci USA. 1990;87:4426–4429. doi: 10.1073/pnas.87.12.4426. [DOI] [PMC free article] [PubMed] [Google Scholar]
- 28.Yokoyama T, Nakano M, Bednarczyk J L, McIntyre B W, Entman M L, Mann D L. Circulation. 1997;95:1247–1252. doi: 10.1161/01.cir.95.5.1247. [DOI] [PubMed] [Google Scholar]


