

Abstract
Accumulating evidences support that CD4+CD25high T regulatory (Treg) cells play an essential role in controlling and preventing autoimmunity. Paradoxically, RA patients have elevated numbers of circulating CD4+CD25high T cells, however, the inflammation is still ongoing. Further identification of these CD4+CD25high T cells may contribute to a better understanding of underlying mechanisms. We show here that these CD4+CD25high T cells were composed of CD4+CD25highFoxP3+ Treg cells and activated CD4+CD25highFoxP3− effector cells. Moreover, there were significantly more Treg cells and effector T cells expressing GITR, and more monocytes expressing GITR-L. Thus, although RA patients have elevated numbers of CD4+CD25high T cells, the suppressive function is not increased, because of the increased number of activated effector T cells. In addition, the GITR-GITR-L system was activated in RA patients, which might lead to diminish suppressive activity of Treg cells and/or lead to resist to suppression of Treg cells by activated effector T cells, thus, contributing to the ongoing inflammation in RA patients.
Keywords: Regulatory T cell, suppressive mechanism, Rheumatoid arthritis, Autoimmunity
Introduction
Rheumatoid arthritis (RA) is an autoimmune disease characterized by chronic joint inflammation leading to swelling, pain, cartilage and bone damage, and eventually to functional joint impairment. The etiology and pathogenesis of RA are not understood fully, although breakdown of self-tolerance is a hallmark of this disease. Accumulating evidences support that CD4+CD25high Treg cells play an essential role in controlling and preventing autoimmunity [1–3]. During the last 5 years, somewhat paradoxically, several reports have described increased numbers of CD4+CD25high T cells in the peripheral blood [4–6] and synovial fluid [7–9] of RA patients. Although high expression of CD25 is the typical cell surface marker used to identify Treg cells, its specificity is not limited to Treg cells. High CD25 levels also can be expressed by activated effector T cells. Therefore, it is important to investigate whether the increase in CD4+CD25high T cells in RA patients is attributable to an increase in Treg cells or activated effector T cells. The forkhead transcription factor (FoxP3) is specifically expressed in CD4+CD25high Treg cells, is crucial for development of Treg cells in the thymus, and is needed to maintain the suppressive function of mature peripheral Treg cells [10]. Decreased FoxP3 expression causes immune disease by subverting the suppressive function of Treg cells and converting Treg cells into effector cells [11]. Although some studies report that FoxP3 can be transiently expressed in activated human effector T cells in vitro, such peripheral generation of persisting stable expression Foxp3 Treg cells, rather than thymic derivation, is the major source of circulating Treg cells in adult human beings [12]. Therefore, FoxP3 is a specific molecular marker for Treg cells in human peripheral blood. However, several reports describing the increase of CD4+CD25high Treg cells in peripheral blood of RA patients did not take FoxP3 into account [4–9]. Therefore, it is necessary to detect FoxP3 expression by the CD4+CD25high T cells in RA patients.
Stimulation of T cells through GITR (glucocorticoid-induced tumour-necrosis-factor-receptor-related protein) with GITR-Ligand (GITR-L) has been shown to enhance immunity to tumors and viral pathogens, and to exacerbate autoimmune disease by attenuation of the effector activity of immunosuppressive CD4+CD25high Treg cells [13]. An abnormally activated co-stimulation GITR-GITR-L system will lead to diminished suppressive activity of these Treg cells [14]. These observations suggest that GITR-GITR-L co-stimulation also plays an important role in regulating the function of CD4+CD25high Treg cells, but little is known about the expression profiles of GITR and GITR-L in the peripheral blood of patients with RA.
Here, we explored the intracellular expression of FoxP3 in CD4+CD25high T cells to determine whether the increase in CD4+CD25high T cells in RA patients is attributable to an increase in Treg cells or activated effector T cells. In addition, the co-stimulation GITR-GITR-L system was explored by evaluating the expression of GITR on CD4+CD25high, CD4+CD25low and CD4+CD25− T cells and the expression of GITR-L on monocytes in peripheral blood from RA patients and healthy controls (HCs).
Materials and Methods
Patients
Ninty-nine RA patients who fulfilled at least four criteria of the American College of Rheumatology for diagnosis of RA, were enrolled in the study. All standard therapy for RA including non steroidal anti-inflammatory drugs (NSAIDs), disease-modifying anti-rheumatic drugs (DMARDs), combinations of DMARDs or adding oral prednisone (< 10 mg/day) were allowed as long as doses were stable for 2 months prior to participation in the study. Forty-four age- and gender-matched HCs served as the comparison group; none had evidence of acute infections or chronic diseases (e.g., other autoimmune disorders). Peripheral blood was obtained from the patients with RA and the HC individuals based on signed consent forms approved by the IRBs of University of Massachusetts and the New York State Department of Health, and the New England IRB.
Reagents
CD45-fluorescein isothiocyanate (FITC), CD152-phycoerythrin (PE), CD4-peridinin chlorophyll protein (PerCP), CD25- allophycocyanin (APC), CD3-FITC/CD8-PE/CD45-PerCP/CD4-APC (Mix), CD3-FITC/CD56+CD16-PE/CD45-PerCP/CD19-APC (Mix), and appropriate isotype controls were purchased from Pharmingen/Becton Dickinson (San Diego, Calif.). The anti-human FoxP3 Mab (PE) and its isotype control were from eBioscience. FITC labeled anti-human GITR antibody and FITC labeled anti-human GITR-Ligand antibody were from R&D system (St Paul,MN,USA). Purified NA/LE mouse anti-Human CD3 (UCHT1) and CD28 (CD28.2) were obtained from BD Pharmingen (San Diego, Calif.). Complete Kit for separation Human CD4+CD25+ T Cells was obtained from StemCell Technologies.
Immunophenotype analysis
For the TruCOUNT assay, whole EDTA-treated peripheral blood (PB) samples (50 µl) were directly stained. Intracellular staining analysis followed the protocol for anti-human FoxP3 staining set. GITR expression on CD4+ T cells and GITR-L expression on Monocytes analysis followed the protocol from R&D system (St Paul,MN,USA). The specimens were analyzed on a BD FACSCalibur using CellQuest software.
Cell isolation
Peripheral blood mononuclear cells (PBMC) were separated using density gradient sedimentation over Histopaque 1077 (Sigma-Aldrich Company, St. Louis, MO) from heparinized venous blood from healthy controls and RA patients. For further suppressive functional assay, after washing with recommended medium (PBS containing 2%FBS and 1mM EDTA), CD25+ PBMC and CD25− PBMC (deplete CD25+ cells from PBMC) were isolated according to manufacturer’s instructions (StemCell Technologies Inc)
Cell suppression and proliferation assay
Using bead-isolated CD25+ and CD25− PBMC, we performed suppression assays. CD25+ PBMC and CD25− PBMC were plated in triplicate wells with 2 × 10⁴ cells per well. CD25+ PBMC and CD25− PBMC were also co-cultured at ratio 1:1 (2 × 10⁴ cells: 2 × 10⁴ cells) per well. Cells were cultured in 96-well flat-bottom tissue culture plates with 10 µg/ml of plate-bound anti-CD3 and 5 µg/ml of soluble anti-CD28 in culture medium at 37 °C in a humidified atmosphere of 5% CO2 in air. Culture medium was Roswell Park Memorial Institute (RPMI) 1640 supplemented with 1 mM sodium pyruvate, 1.2% sodium bicarbonate (BioWhittaker), 2 mM glutamine (Sigma), 25 µg/ml gentamicin (Sigma), and 5% heat-inactivated human AB serum (HyClone, Logan, UT). After 5 days of culture, 0.5 µCi/well [3H]-thymidine (Dupont-NEN, Wilmington, DE) was added for an additional 18 h before harvesting with Basic 96 Harvester (Skatron Instruments, Lier, Norway). The phosphostimulated luminesence (PSL) image was read by a BAS 2000 Fujix reader and analyzed by the TINA 2.0 software program.
Intracellular cytokine Staining
Isolated PBMCs were stimulated with 50 ng/mL phorbol 12- myristate 13-actate (PMA) and 1 µg/mL Ionomycin for 4 hours in the presence of 10 µM Brefeldin A (Sigma-Aldrich Co., St. Louis, MO) in culture medium at 37 °C in a humidified atmosphere of 5% CO2 in air. The cells were harvested, washed in PBS, and then incubated with PerCP-conjugated anti-CD4 or APC-conjugated anti-CD8. After fixed and permeabilized with BD Cytofix/Cytoperm buffer, cells were stained with anti-IFN-γ-FITC, anti-IL-6-FITC, anti-IL-10-FITC and PE-labeled antibody against IL-4, TNF-α and IL-2. As a negative control, cells were stained with IgG isotype-matched controls. The cells were washed and then analyzed by flow cytometry.
Statistical analysis
Statistical analysis was performed with Sigma plot 9.0 software. Results were expressed as mean value ± standard error of the mean (SEM). The level of significance was set at P<0.05.
RESULTS
RA patients have elevated numbers of peripheral blood CD4+CD25high and CD4+CD25low T cells
We analyzed peripheral blood from 99 RA patients and 44 HCs for the prevalence of CD4+CD25high, CD4+CD25low and CD4+CD25− T cells. The population of CD4+CD25high, CD4+CD25low and CD4+CD25− T cells as a percentage of total CD4+ T cells was identified by flow cytometry after cell surface labeling for expression of CD45, CD3, CD4, and CD25. Based on the isotype control (Fig. 1A), the cutoff for CD25− cells was established. Representative dot plots of a HC (Fig. 1B) and RA patient (Fig. 1C) are shown. As shown (Fig. 1D), the mean percentages of CD4+CD25high T cells ± SEM (23.0 ± 1.3 %, RA, and 14.4 ± 0.8 %, HC); of CD4+CD25low T cells (33.5 ± 0.8 %, RA, and 28.3 ± 1.2 %, HC); and of CD4+CD25− T cells (43.6 ± 1.6 %, RA, and 55.7 ± 2.1 %, HC) demonstrated significant differences between the RA and HC populations. In addition, the absolute numbers of CD4+CD25high T cells (220.1 ± 16.9 cells/µl RA blood; 127.1 ± 9.0 cells/µl HC blood) and of CD4+CD25low T cells (325.2 ± 16.9 cells/µl RA blood; 253.5 ± 16.0 cells/µl HC blood) were significantly different. However, the absolute numbers of CD4+CD25− T cells (433.3 ± 25.2 cells/µl RA blood; 507.5 ± 35.5 cells/µl HC blood) were not significantly different.
Figure 1. RA patients have elevated numbers of peripheral blood CD4+CD25high and CD4+CD25low T Cells.
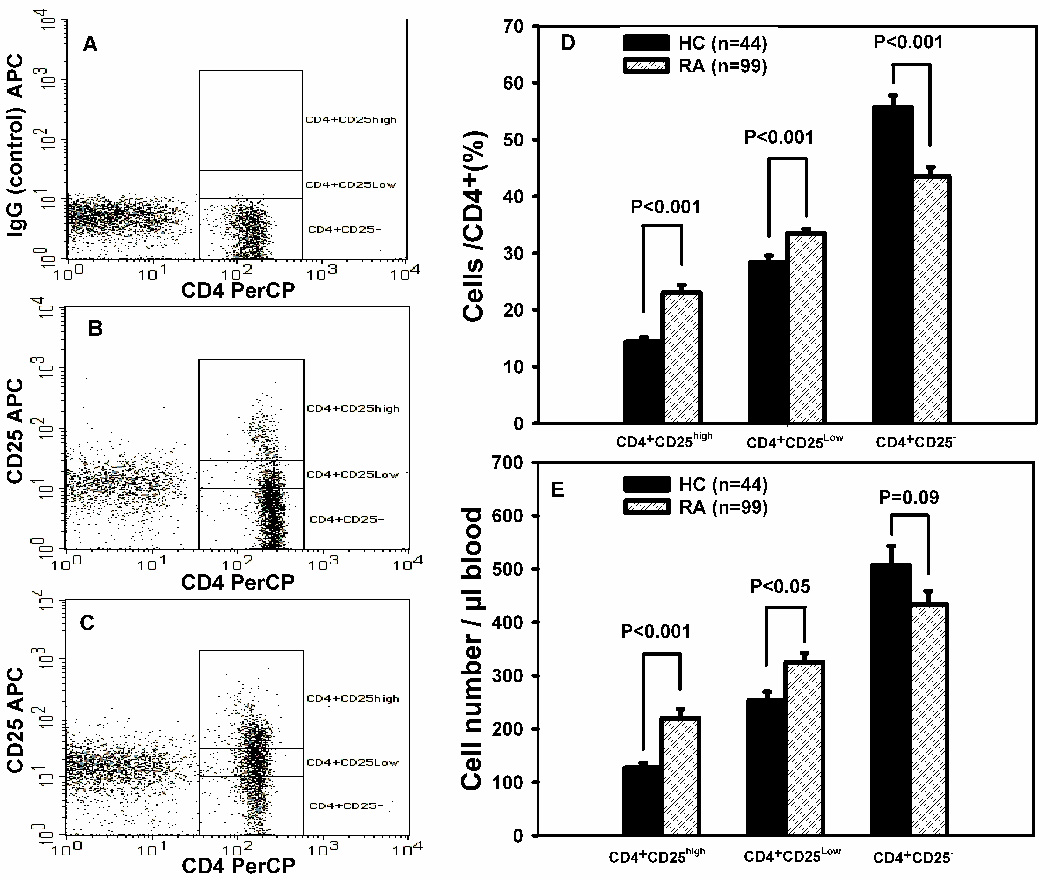
The percentage and numbers of peripheral blood CD4+CD25high, CD4+CD25low and CD4+CD25− T cells subsets from RA patients (n = 99) and healthy controls (HC, n = 44) were quantified by flow cytometry as described in Materials and Methods. Representative dot plots of healthy control (B) and RA patient (C) are shown (A IgG control). The mean percentages ± SEM of CD4+CD25high, CD4+CD25low, and CD4+CD25− T cells for RA patients and HCs are shown in (D). The absolute numbers (cells/µL ± SEM) of CD4+CD25high, CD4+CD25low, and CD4+CD25− T cells for RA patients and HCs are shown in (E).
No relationship existed between the increased numbers of CD4+CD25high T cells and disease activity
Since a main purpose of CD4+CD25high Treg cells is to control autoimmunity disease, we addressed the question of whether the increased number of CD4+CD25high T cells in the peripheral blood of patients with RA can ameliorate disease activity. We used the number of swollen and tender joints, ESR and CRP as clinical parameters for disease activity. The RA patients were separated into three groups according to the ratio of CD4+CD25high: CD4+ T cells. The RA1 group had a ratio of ≤ 0.15, which was equivalent to the average ratio for HCs. The RA2 group had an intermediate ratio (0.16–0.21), and the RA3 group had a ratio of ≥ 0.22 (0.22 was the mean value for all of the RA patients). As shown (Table 1 and Supplementary Fig. 1), we did not find any relationship between the increased number of CD4+CD25high T cells and the number of swollen and tender joints. In addition, we did not find any relationship between the increased number of CD4+CD25high T cells and ESR or CRP (data not show).
Table 1.
Analysis the relationship between increased CD4+CD25high T cells in patients with RA and disease activity, therapy, sex, age and lymphocyte subsetsa.
| HCb | RA1c | RA2 | RA3 | Statistical difference | ||||||
|---|---|---|---|---|---|---|---|---|---|---|
| (n=44) | (n=31) | (n=37) | (n=31) | HC&RA1 | HC&RA2 | HC&RA3 | RA1&RA2 | RA1&RA3 | RA2&RA3 | |
| Age | 60 ± 11 | 61 ± 11 | 56 ± 12 | 59 ± 10 | NSd | NS | NS | NS | NS | NS |
| Sex (F/M) | 39/5 | 27/4 | 29/8 | 27/4 | NS | NS | NS | NS | NS | NS |
| Disease activity (Number of swollen and tender joints) | 27 | 27.9 | 26.9 | NS | NS | NS | ||||
| Treatment | No | NASIDs, DMARDs, Prednisone | NASIDs, DMARDs, Prednisone | NASIDs, DMARDs, Prednisone | NS | NS | NS | |||
| CD45+ | 1892 ± 90 | 1902 ± 101 | 1964 ± 132 | 1657 ± 126 | NS | NS | NS | NS | NS | NS |
| CD3+ | 1295 ± 60 | 1456 ± 80 | 1587 ± 124 | 1153 ± 91 | NS | P<0.05 | NS | NS | P=0.01 | P<0.01 |
| CD3+CD4+ | 807 ± 37 | 1001 ± 64 | 1125 ± 86 | 877 ± 75 | P<0.01 | P<0.001 | NS | NS | NS | P<0.05 |
| CD3+CD8+ | 431 ± 27 | 452 ± 53 | 447 ± 53 | 273 ± 29 | NS | NS | P<0.001 | NS | P<0.01 | P<0.01 |
| CD4+CD25high | 127 ± 9 | 125 ± 10 | 204 ± 16 | 335 ± 42 | NS | P<0.001 | P<0.001 | P<0.001 | P<0.001 | P<0.01 |
| CD4+CD25Low | 254 ± 16 | 282 ± 23 | 351 ± 27 | 338 ± 37 | NS | P<0.01 | P<0.05 | NS | NS | NS |
| CD4+CD25− | 508 ± 36 | 599 ± 39 | 467 ± 36 | 227 ± 29 | NS | NS | P<0.001 | P<0.05 | P<0.001 | P<0.001 |
| CD19+ | 218 ± 17 | 215 ± 20 | 285 ± 28 | 210 ± 25 | NS | P<0.05 | NS | P<0.05 | NS | P<0.05 |
| CD16–56+ | 222 ± 17 | 177 ± 18 | 227 ± 27 | 239 ± 27 | NS | NS | NS | NS | NS | NS |
| Monocytes | 380 ± 24 | 456 ± 35 | 546 ± 37 | 542 ± 48 | NS | P<0.001 | P=0.001 | NS | NS | NS |
Lymphocyte subsets were first gated on CD45brightSSClow cells, and then assayed for three other markers by flow cytometry. Results are presented as mean ± SEM of the cell number/µL blood with use of TrueCount tubes.
HC denotes the healthy control population.
The RA population was subdivided into those with a CD4CD25:CD4 ratio of ≤ 0.15 (RA1) and ≥ 0.22 (RA3). The RA2 group had an intermediate ratio (0.16–0.21)
NS, not significant.
Increased CD4+CD25high T cells in patients with RA were not associated with therapy and age
It has been suggested that immunosuppressive drugs and glucocorticoids can increase CD4+CD25high T cells in peripheral blood [15,16]. Thus, the different CD4+CD25high T cell ratios could be a result of current treatments. However, we did not find any relationship between the numbers of CD4+CD25high T cells with a different treatment of the RA patients (Table 1). In addition, to rule out the possibility that the number of CD4+CD25high T cells was greater in a more elderly group, we examined the influence of age [17]. We did not find any relationship between the numbers of CD4+CD25high T cells and age (Table 1).
Both CD4+CD25highFoxP3+ Treg cells and activated CD4+CD25highFoxP3− effector T cells attributed to the increased number of CD4+CD25high T cells in RA patients
Although RA patients have elevated numbers of circulating CD4+CD25high T cells, the inflammation is still ongoing. It was, therefore, important to investigate whether the increased number of CD4+CD25high T cells in RA patients is due to more Treg cells or activated effector T cells. We compared the intracellular expression of FoxP3 by CD4+CD25high, CD4+CD25low and CD4+CD25− T cells from RA patients and HCs (Fig.2). FoxP3 was expressed mainly by CD4+CD25high T cells (74.09 ± 2.3 % for HCs; 59.28 ± 2.4 % for RA patients); very few CD4+CD25− T cells expressed FoxP3 (3.29 ± 0.3 % for HCs, and 4.79 ± 0.6 % for RA patients) (Fig.2A). Although CD4+CD25high T cells from RA patients expressed a significantly (P<0.001) lower percentage of FoxP3 (Fig. 2B), the amount of FoxP3 per cell (MFI) was significantly greater in the RA patients than in the HC population (Fig. 2C). The FoxP3 difference suggests that more of CD4+CD25high T cells from RA patients are not Treg cells. However, there were more CD4+CD25highFoxP3+ Treg cells in RA patients (170 ± 25.6 cells/µl blood) than HCs (108 ± 11.6 cells/µl blood), but the number of CD4+CD25highFoxP3− T cells was also significantly increased (113 ± 13.0 cells/µl RA blood and 37 ± 5.3 cells/µl HC blood) (Fig. 2D). Thus, the ratio of Treg cells to activated effector T cells is significantly greater in HCs.
Figure 2. Percentage and the absolute number of FoxP3+ and FoxP3− T cells in the CD4+ T cell subsets.


Typical flow cytometric analysis of forkhead Box P3 (FoxP3) expression in CD4+CD25high, CD4+CD25low and CD4+CD25− T cell dot plots from RA patients and HCs are shown in (A). The values at the top right of each plot were the average percentages of FoxP3+ cells for RA patients (n=20) and HCs (n=20). The percentage and MFI differences of FoxP3 expression in the CD4+CD25high populations for the RA patients and HCs are shown in (B) and (C), respectively. Results represent the mean number per µL blood ± SEM for the subsets from RA patients and HCs (D). The numbers were calculated as described in Material & Methods. The results are expressed as mean values ± SEM.
In vitro anti-CD3/anti-CD28 co-stimulation of CD4+CD25− cells generates CD4+CD25+FoxP3− and CD4+CD25+FoxP3+ cells
It has been reported that decreased FoxP3 expression causes immune disease by subverting the suppressive function of Treg cells and converting Treg cells into effector cells [11]. Decreased FoxP3 expression levels have been reported in patients with other autoimmune diseases [18,19]. Thus, we investigated CD25 and FoxP3 expression by CD4+CD25− cells after activation. Interestingly, both CD25+FoxP3− and CD25+FoxP3+ cells are generated, but the majority of the cells are FoxP3− (see Supplementary Fig. 2). Although this result does not address the potential to lose FoxP3 expression, it confirms that CD4+CD25− cells can be generated into FoxP3− and Foxp3+ cells, as previously reported [20].
CD25high cells isolated from the peripheral blood of patients with RA have suppressive activity
To assess whether CD25high cells can mediate suppression, CD25high PBMC and CD25− PBMC (representative dot plots, Fig. 3A) were isolated from the peripheral blood of HCs and patients with RA using a magnetic bead method (as described in Materials and Methods). CD25high PBMC, CD25− PBMC and co-cultured PBMC were stimulated with plate-bound anti-CD3 and soluble anti-CD28. With cells from patients with RA and HCs, CD25high PBMCs displayed significantly reduced proliferative responses compared to CD25− PBMCs (Fig. 3B). Although the degree of proliferation of CD25− PBMC from RA patients (36206 ± 8505 PSL) was greater than that from HCs (26312 ± 4559 PSL), it was not significantly different. There also was no significant difference for the proliferative capacity of CD25high PBMC from RA patients (16701 ± 4849 PSL) and HCs (5407 ± 1069 PSL). In co-cultures, CD25high PBMCs from HCs and RA patients were able to suppress the proliferation of CD25− PBMCs at a 1:1 ratio (Fig. 3B). There was no significant difference in the degree of suppression by the CD4+CD25high T cells from HCs and patients with RA (RA, 34.1 ± 10.1% suppression; HC, 45.6 ± 13.9% suppression) (Fig. 3C). Even though the CD4+CD25high T cells from RA patients appear to be slightly less active than CD4+CD25high T cells from HCs (Fig. 3C), it is important to note that the CD4+CD25high population from the RA patients had a lower percentage of FoxP3+ cells (Fig. 2B). The FoxP3+ percentage of the CD4+CD25high T cell subset was approximately 15 % lower than that from the HCs.
Figure 3. CD4+CD25high T cells isolated from the peripheral blood of patients with RA have suppressive activity.

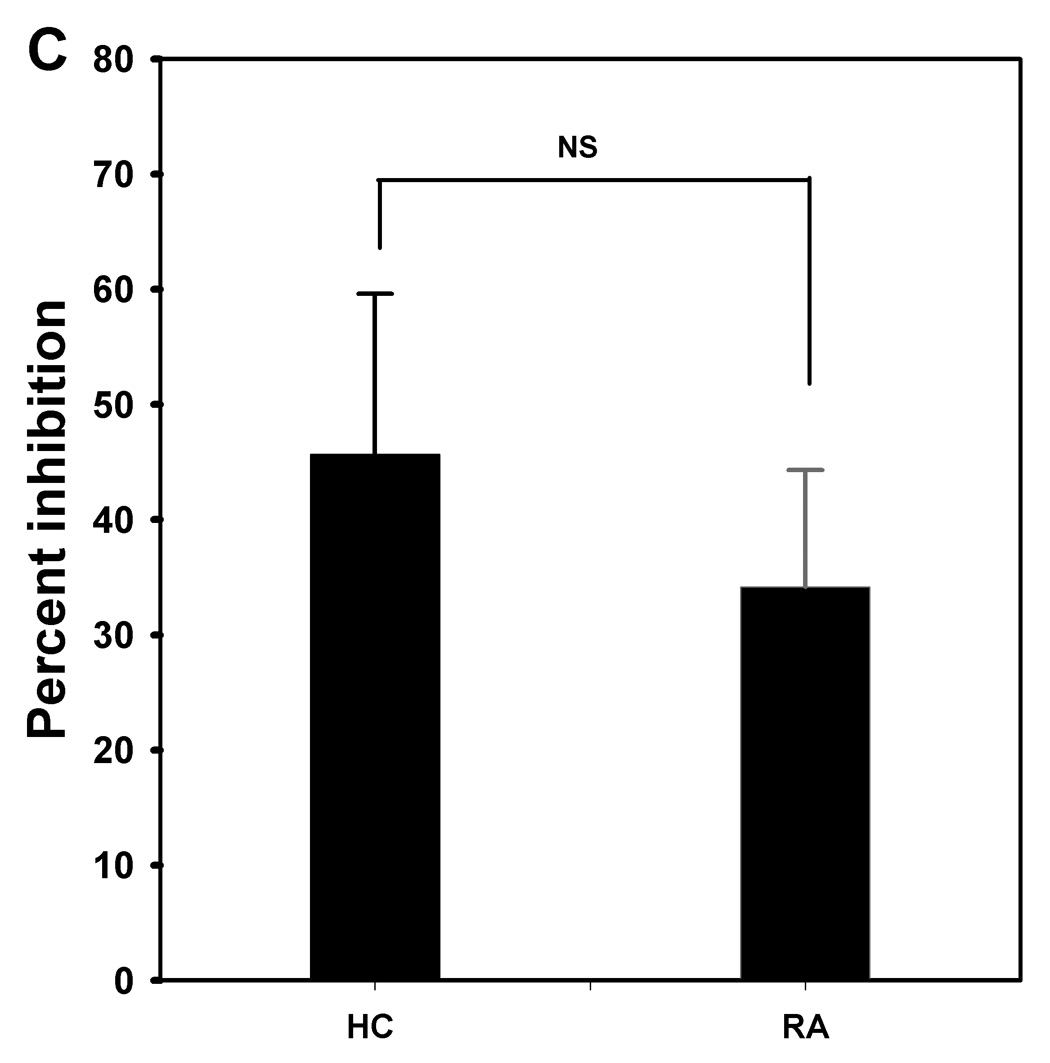
CD25high PBMC and CD25− PBMC were isolated using a magnetic bead method (as described in Materials and Methods) from peripheral blood of HCs (n=4) and patients with RA (n=6) Representative dot plots of the CD25high PBMC and CD25− PBMC populations are shown (A). Isolated or combined (1:1) CD25− PBMC and CD25high PBMC were polyclonally stimulated with plate-bound anti-CD3 and soluble anti-CD28 antibodies for 5 days, and proliferation was measured for the last 18 hr of incubation using [3H]-thymidine incorporation (B). Results are expressed as mean PSL value ± SEM. In co-cultures, CD25high PBMCs were able to suppress CD25− PBMC proliferation. To assess the suppressive activity of CD25high PBMC, coculture experiments were performed in which CD25−PBMC were cultured in the absence or presence of CD25high PBMC at 1:1 ratio (C), after which the relative difference in proliferative response between the two conditions was calculated. Results are expressed as mean values ± SEM; NS means not significant.
RA patients have elevated numbers of peripheral blood CD4+CD25highFoxP3+ Treg cells and CD4+CD25highFoxP3− effector cells expressing GITR
GITR is particularly abundant on CD4+CD25high Treg cells [21]. Although it has been proposed that GITR is a more faithful marker of Treg cells, GITR expression does not exclusively distinguish this subset, as up-regulation of GITR also occurs following activation of CD25− T cells [22], as shown (Supplementary Fig.3). There was more GITR expression on CD4+CD25high T cells and CD4+CD25low T cells than on CD4+CD25− T cells from both RA patients and HCs (data not shown). Furthermore, the number of CD4+CD25highFoxP3+GITR+ Treg cells was significantly greater in RA patients (24.3 ± 3.7 cells/µl blood) than in HCs (15.4 ± 2.0 cells/µl blood). The number of CD4+CD25highFoxP3−GITR+ effector T cells was also significantly greater in RA patients (42.3 ± 8.5 cells/µl blood) than in HCs (13.3 ± 1.9 cells/µl blood) (Fig.4A).
Figure 4. The GITR-GITR-L system is activated in peripheral blood of patients with RA.


(A) The number of CD4+ T subsets in the peripheral blood of RA patients and HCs were assayed for expression of CD25, FoxP3 and GITR cells. (B) The number of monocyte was increased in RA patients as compared with HCs. The higher percentage of monocytes from the RA patients also expressed GITR-L. Results are expressed as mean number of cells/µL blood ± SEM.
RA patients have elevated numbers of peripheral blood monocytes and monocytes expressing GITR-L
In addition to T cells, monocyte/macrophages and their mediators also contribute to the inflammatory process of RA. Therefore, we assessed the numbers of monocytes in the peripheral blood from HCs and RA patients. As shown (Fig. 4B), there were significantly more monocytes in RA patients (493.1 ± 31.3 cells/µl blood) than in HCs (370.6 ± 22.5 cells/µl blood). In addition, although the frequency of monocytes that express GITRL was not greatly altered, the numbers of monocytes expressing GITR-L were increased significantly in RA patients (306.0 ± 32.5 cells/µl blood) as compared with HCs (218.2 ± 14.7 cells/µl blood) (Fig. 4B).
Cytokine expressing T cells
It has been suggested that proinflammatory cytokines induce reversal of CD4+CD25high Treg-mediated suppression [23]. Therefore, we determined whether more of the T cells in RA patients with higher numbers of CD4+CD25high T cells (RA3 group) produce these proinflammatory cytokines than the T cells from patients with lower numbers of CD4+CD25high T cells (RA1 group) and from HCs. Intracellular IFN-γ, IL-4, IL-6, IL-10, TNF-α and IL-2 expression by CD4+ and CD8+ T cells was assessed (Fig.5). There was a significant increase in IL-2 producing CD8+ T cells from the RA patients with higher numbers of CD4+CD25high T cells (RA3 group). Interestingly, there also was a significant increase in IL-6 producing CD8+ T cells, but only in the RA patients expressing a low number of CD4+CD25high T cells (RA1 group); this increased percentage of IL-6+ CD8+ T cells was significantly lower in the RA3 patients. There were no differences for any cytokine with CD4+ cells from the HCs and the RA1 and RA3 patients.
Figure 5. Intracellular cytokine expression by T cells from RA patients and HCs.

CD8+ A, B) and CD4+ (C, D) T cells from the peripheral blood of patients with RA and HCs were assayed for cytokine expression after in vitro stimulation with PMA and ION in the presence of brefeldin A. The percentages of T cells expressing cytokine were assayed (A, C) as well as relative amount (MFI) of cytokine per cell (B, D).
Increased numbers of CD4+CD25high T cells were associated with a decreased number of CD4+CD25− and CD3+CD8+ T cells in RA patients
Recent data indicate that Treg cells develop in the thymus during ontogeny as well as in the periphery from naive T cells [24]. Our results indicated that CD4+CD25highFoxP3+ Treg cells and activated CD4+CD25highFoxP3− effector cells can come from activated CD4+CD25− T cells (see Supplementary Fig. 2). To further address the relative numbers of additional lymphoid subsets, we evaluated the relationship between the numbers of CD4+CD25high T cells and the number of other lymphoid subsets in the peripheral blood of RA1, RA2, and RA3 patients with those from HCs. As previously stated, the RA1 group had numbers of CD4+CD25high T cells equivalent to the HCs. A significant decrease in the number of CD4+CD25− T cells in the RA patients was associated with an increase in the number of CD4+CD25high T cells. There were significantly increased numbers of CD4+CD25low T cells in the RA2 and RA3 groups compared with HCs. The increased number of CD4+CD25+ T cells in peripheral blood of RA patients indicates that a shift from CD4+CD25− T cells in RA patients toward CD4+CD25low and CD4+CD25high T cells. The RA1 and RA2 groups did not have significantly lower numbers of the CD3+CD8+ cells, whereas this subset was significantly lower for the RA3 group (Table 1 and Supplementary Fig. 4). Interestingly, The RA2 group had significantly more B cells than the RA1, RA3, and HC populations.
Discussion
We have demonstrated that there are more CD4+CD25high T cells in the peripheral blood of RA patients than in that of HCs. Since a main purpose of CD4+CD25high Treg cells is to control autoimmunity disease, we addressed the question of whether the increased number of CD4+CD25high T cells in the peripheral blood of patients with RA can ameliorate disease activity. However, our and other groups have shown that no relationship exists between the number of CD4+CD25high T cells and disease activity [4,5]. Therefore, we questioned whether the increase in CD4+CD25high T cells in RA patients is attributable to an increase in Treg cells or an increase in activated T cells. FoxP3 is specifically expressed in CD4+CD25+ Treg cells, is crucial for development of Treg cells in the thymus, and is needed to maintain the suppressive function of mature peripheral Treg cells [10]. Although some studies report that FoxP3 can be transiently expressed in activated human effector T cells in vitro, such peripheral generation of persisting stable expression Foxp3 Treg cells, rather than thymic derivation, is the major source of circulating Treg cells in adult human beings [12]. Over-expression of FoxP3 by in vitro transfection induces T cells to become anergic and to exert a complete or partial suppressive activity [25]. On the contrary, decreased FoxP3 expression enhances autoimmune responses by subverting the suppressive function of Treg cells and converting Treg cells into effector cells [10,11]. Therefore, expression of FoxP3 plays a necessary role in confirming and governing Treg cell action. However, several reports describing the increase of CD4+CD25high Treg cells in the peripheral blood of RA patients did not take FoxP3 into account [4–9]. Our result show that the majority of CD4+CD25high T cells expressed FoxP3; very few CD4+CD25− T cells expressed FoxP3. However, a significantly lower percentage of the CD4+CD25high T cells from RA patients than from HCs expressed FoxP3 even though the FoxP3+ cells from RA patients expressed more FoxP3 per cell. Of the CD4+CD25high populations, the ratio of the FoxP3+ to FoxP3− cells was almost 2-folder higher for the HCs. The elevated numbers of CD4+CD25highFoxP3− T cells in the RA patients mainly account for this differential ratio and also likely account for the appearance of less suppressive activity in the RA patients.
In addition to FoxP3, the GITR-GITR-L co-stimulatory system plays an important role for net CD4+CD25high Treg cell activity. GITR is expressed at low levels on resting responder T lymphocytes and is up-regulated on T regulatory cells and on activated T cells. GITR is activated by its ligand, GITRL, mainly expressed on antigen presenting and endothelial cells [13]. The co-stimulatory system involves interplay between regulatory and effector T cells and antigen-presening cells (APC). For instance, stimulation of T cells through GITR has been shown to exacerbate autoimmune disease. The effects of stimulation through GITR are generally thought to be caused by attenuation of the immunosuppressive activity of CD4+ CD25high Treg cells [14], as well as by increased resistance of effector T cells to CD4+CD25high Treg cell-induced suppression [26]. In addition, SEB inhibits Treg cells by inducing GITR-L expression on monocytes [27]. Our results show that both CD4+CD25highFoxP3+ Treg cells and CD4+CD25highFoxP3− effector T cells from RA patients were significantly increased in the number of GITR expressing cells. In addition, although the frequency of monocytes that express GITRL was not greatly altered, RA patients also had elevated numbers of peripheral blood monocytes expressing GITR-L. These results indicate that the GITR-GITR-L system is activated in peripheral blood of patients with RA. The increased CD4+CD25highFoxP3+GITR+ Treg cells and CD4+CD25highFoxP3−GITR+ T cells interacting with activated monocytes in peripheral blood would hypothetically lead to a net increase in immunity or autoimmunity in vivo. Thus, the ongoing inflammation in RA patients seems to be due more to elevated levels of activated effector T cells than lack of Treg activity.
Since a recent study suggested that proinflammatory cytokines induce a reversal of CD4+CD25high Treg-mediated suppression [23], we wanted to address whether elevated numbers of CD4+CD25high cells in RA patients influence proinflammatory cytokine production. We analyzed the intracellular cytokine expressions of CD4+ and CD8+ T cells in RA patients with higher numbers of CD4+CD25high T cells. The results did not provide evidence that more proinflammatory cytokines produced by CD4+ and CD8+ T cells could be responsible for inhibition of CD4+CD25high Treg cell activity in RA patients with higher numbers of CD4+CD25high T cells in peripheral blood. In fact the only cytokine elevated was IL-2 and IL-2 is known to promote Treg development [28]. Interestingly, the RA1 population which has a level of Treg cells equivalent to the HCs had an elevated percentage of CD8+ T cells that expressed IL-6, a cytokine known to inhibit level of Treg cells [29]. These results appear to explain that the CD8+ T cells of the RA1 population expressing higher amounts of IL-6 does seem to correlate with lower numbers of CD4+CD25high T cells than RA3 population since IL-6 can inhibits the generation of Foxp3+ Treg cells induced by TGF-beta [30]. In addition, the percentage or number difference of CD4+CD25high cells among RA patients maybe due to the different production of cytokines, such as IL-2 and/or IL-6.
The elevated numbers of peripheral blood CD4+CD25high T cells in patients with RA could not be correlated with disease severity, age or therapies. There are reports of significant increases in CD4+CD25high Treg cells in patients with cancer [25,31] and infectious disease [32]. Our and other results [20] showed that CD4+CD25− T cells can convert to activated CD4+CD25highFoxP3+ T cells and CD4+CD25highFoxP3− T cells after TCR stimulation. These CD4+CD25highFoxP3+ T cells have suppressive function [20]. Recent reports have documented that IL-2 is essential for TGF-β to convert naive CD4+CD25− cells to CD4+CD25high FoxP3+ Treg cells [33], and administration of IL-2 increased the Treg cell pool in patients with cancer [34–36]. A decline in the number of CD4+CD25− T cells was associated with an increased number of CD4+CD25high T cells in RA patients. Therefore, these results suggest that increased CD4+CD25high T cells in RA patients might come from chronic antigen activation of CD4+CD25− T cells in vivo.
RA patients who had numbers of CD4+CD25high T cells significantly above those of the HCs had lower numbers of CD3+CD8+ T cells. Although the decline in the number of CD3+CD8+ T cells appeared associated with the increased the number of CD4+CD25high T cells, we did not establish the relationship between them. That is to say, whether the increased number of CD4+CD25high T cells lead to the decreased number of CD3+CD8+ cells or the decreased number of CD3+CD8+ cells lead to increased number of CD4+CD25high T cells. In addition, we can not rule out the possibility that decreases of CD8+ T cells in peripheral blood may indicate that there is a selective migration of these cells out of the peripheral blood and into tissues or that they have decreased survival. The possibility maybe that higher production of IL-2 in peripheral blood due to feedback of significantly decreased number of CD8+ T cells lead to a shift from CD4+CD25− T cells in RA patients toward CD4+CD25high T cells in the peripheral blood of RA patients with existing chronic antigen stimulation. However, whether the increased number of CD4+CD25high T cells in peripheral blood of patients with RA is the result of the increased IL-2 by CD8+ T cells need further investigation.
In summary, RA patients have elevated numbers of circulating CD4+CD25high T cells, the increased numbers of CD4+CD25high T cells are suggested to come from chronic antigen activation of CD4+CD25− T cells since there is chronic inflammation ongoing. Our results show that the increased numbers of CD4+CD25high T cells are composed of CD4+CD25highFoxP3+ Treg cells and activated CD4+CD25highFoxP3− effector cells with an imbalance in the RA patients. In addition, the increased number of CD4+CD25highFoxP3+GITR+Treg cells and CD4+CD25highFoxP3−GITR+ T cells interacting with greater numbers of activated monocytes might lead to diminish suppressive activity of the Treg cells and/or lead to resist to Treg cells by these activated effector T cells in vivo, thus contributing to the ongoing inflammation in RA patients.
Supplementary Material
Figure 1. No relationship exists between the increased number of CD4+CD25high T cells in RA patients and their disease activity. For number of swollen and tender joints, each symbol represents a different individual, and the horizontal lines indicate the mean values. The RA1 group had a CD4+CD25high to total CD4 ratio of ≤ 0.15, which was equivalent to the average ratio for the HC population. The RA2 group had an intermediate ratio (0.16–0.21), and the RA3 group had a ratio of ≥ 0.22. The ratio of 0.22 was the mean value for the entire RA population (n = 99).
Figure 2. CD25 and FoxP3 expression by CD4+ T cells after activation by anti-CD3/CD28. Representative dot plot of isolated CD25− PBMC cultured for 48 hr with medium (A) or anti-CD3 (10µg/ml) and anti-CD28 (5µg/ml) (B). Cultured cells were gated for CD4+ T cells and assessed for their expression of CD25 and FoxP3 as described in Material & Methods.
Figure 3. GITR expression in unstimulated CD4+CD25− T cells and stimulated CD4+CD25− T cells. To detect GITR expression in the CD4+CD25− T cells at the protein level, CD4+CD25− T cells were isolated from HCs and activated by anti-CD3 (10µg/ml) and anti-CD28 (5µg/ml) for 48 hr. A representative dot plot is shown for the nonstimulated (A) and stimulated (B) cells.
Fig 4. The number of CD4+CD25high T cells in the peripheral blood influenced the number of T cell subsets in the blood. Representative dot plots of the percentage of CD4+CD25high, CD4+CD25low, and CD4+ CD25− T cells in the peripheral blood from HC and RA1 group and RA3 group were assessed in (A, B, and C). The ratio of CD4+CD25high T cells to total CD4+ T cells allowed the RA patients to be sorted as previously described. The bloods were then assayed for the percentage of CD4+ and CD8+ T cells (D, E, and F).
Acknowledgements
The authors thank the staff of the Immunology Core of Wadsworth Center for their assistance with the flow cytometry and phosphorimaging analysis. This work was supported in part by a grant (RO1 AT00309) from the National Center for Complementary and Alternative Medicine (NCCAM).
Footnotes
Publisher's Disclaimer: This is a PDF file of an unedited manuscript that has been accepted for publication. As a service to our customers we are providing this early version of the manuscript. The manuscript will undergo copyediting, typesetting, and review of the resulting proof before it is published in its final citable form. Please note that during the production process errors may be discovered which could affect the content, and all legal disclaimers that apply to the journal pertain.
References
- 1.Sakaguchi S, Sakaguchi N, Asano M, Itoh M, Toda M. Immunologic tolerance maintained by activated T cells expressing IL-2 receptor α-chains (CD25): breakdown of a single mechanism of self-tolerance causes various autoimmune diseases. J. Immunol. 1995;155:1151–1164. [PubMed] [Google Scholar]
- 2.Takahashi T, Kuniyasu Y, Toda M, Sakaguchi N, Itoh M, Iwata M, Shimizu J, Sakaguchi S. Immunologic self-tolerance maintained by CD25+ CD4+ naturally anergic and suppressive T cells: induction of autoimmune disease by breaking their anergic/suppressive state. Int. Immunol. 1998;10:1969–1980. doi: 10.1093/intimm/10.12.1969. [DOI] [PubMed] [Google Scholar]
- 3.Baecher-Allan C, Viglietta V, Hafler DA. Human CD4+CD25+ regulatory T cells. Semin. Immunol. 2004;16:89–97. doi: 10.1016/j.smim.2003.12.005. [DOI] [PubMed] [Google Scholar]
- 4.Van Amelsfort JM, Jacobs KM, Bijlsma JW, Lafeber FP, Taams LS. CD4(+)CD25(+) regulatory T cells in rheumatoid arthritis: differences in the presence, phenotype, and function between peripheral blood and synovial fluid. Arthritis. Rheum. 2004;50:2775–2785. doi: 10.1002/art.20499. [DOI] [PubMed] [Google Scholar]
- 5.Ehrenstein MR, Evans JG, Singh A, Moore S, Warnes G, Isenberg DA, Mauri C. Compromised function of regulatory T cells in rheumatoid arthritis and reversal by anti-TNFalpha therapy. J. Exp. Med. 2004;200:277–285. doi: 10.1084/jem.20040165. [DOI] [PMC free article] [PubMed] [Google Scholar]
- 6.Dombrecht EJ, Aerts NE, Schuerwegh AJ, Hagendorens MM, Ebo DG, Van Offel JF, Bridts CH, Stevens WJ, De Clerck LS. Influence of anti-tumor necrosis factor therapy (Adalimumab) on regulatory T cells and dendritic cells in rheumatoid arthritis. Clin. Exp. Rheumatol. 2006;24:31–37. [PubMed] [Google Scholar]
- 7.Cao D, Malmstrom V, Baecher-Allan C, Hafler D, Klareskog L, Trollmo C. Isolation and functional characterization of regulatory CD25brightCD4+ T cells from the target organ of patients with rheumatoid arthritis. Eur. J. Immunol. 2003;33:215–223. doi: 10.1002/immu.200390024. [DOI] [PubMed] [Google Scholar]
- 8.Mottonen M, Heikkinen J, Mustonen L, Isomaki P, Luukkainen R, Lassila O. CD4+ CD25+ T cells with the phenotypic and functional characteristics of regulatory T cells are enriched in the synovial fluid of patients with rheumatoid arthritis. Clin. Exp. Immunol. 2005;140:360–367. doi: 10.1111/j.1365-2249.2005.02754.x. [DOI] [PMC free article] [PubMed] [Google Scholar]
- 9.Cao D, van Vollenhoven R, Klareskog L, Trollmo C, Malmstrom V. CD25brightCD4+ regulatory T cells are enriched in inflamed joints of patients with chronic rheumatic disease. Arthritis. Res. Ther. 2004;6:R335–R346. doi: 10.1186/ar1192. [DOI] [PMC free article] [PubMed] [Google Scholar]
- 10.Williams LM, Rudensky AY. Maintenance of the Foxp3-dependent developmental program in mature regulatory T cells requires continued expression of Foxp3. Nat. Immunol. 2007;8:277–284. doi: 10.1038/ni1437. [DOI] [PubMed] [Google Scholar]
- 11.Wan YY, Flavell RA. Regulatory T-cell functions are subverted and converted owing to attenuated Foxp3 expression. Nature. 2007;445:766–770. doi: 10.1038/nature05479. [DOI] [PubMed] [Google Scholar]
- 12.Pillai V, Karandikar NJ. Human regulatory T cells: A unique, stable thymic subset or a reversible peripheral state of differentiation? Immunol. Lett. 2007;114:9–15. doi: 10.1016/j.imlet.2007.08.012. [DOI] [PMC free article] [PubMed] [Google Scholar]
- 13.Shevach EM, Stephens GL. The GITR-GITRL interaction: co-stimulation or contrasuppression of regulatory activity? Nat. Rev. Immunol. 2006;6:613–618. doi: 10.1038/nri1867. [DOI] [PubMed] [Google Scholar]
- 14.Ji HB, Liao G, Faubion WA, Abadia-Molina AC, Cozzo C, Laroux FS, Caton A, Terhorst C. Cutting edge: the natural ligand for glucocorticoid-induced TNF receptor-related protein abrogates regulatory T cell suppression. J. Immunol. 2004;172:5823–5827. doi: 10.4049/jimmunol.172.10.5823. [DOI] [PubMed] [Google Scholar]
- 15.Fattorossi A, Battaglia A, Buzzonetti A, Ciaraffa F, Scambia G, Evoli A. Circulating and thymic CD4+CD25+ T regulatory cells in myasthenia gravis: effect of immunosuppressive treatment. Immunology. 2005;116:134–141. doi: 10.1111/j.1365-2567.2005.02220.x. [DOI] [PMC free article] [PubMed] [Google Scholar]
- 16.Suarez A, Lopez P, Gomez J, Gutierrez C. Enrichment of CD4+CD25high T cell population in SLE patients treated with glucocorticoids. Ann. Rheum. Dis. 2006;65:1512–1517. doi: 10.1136/ard.2005.049924. [DOI] [PMC free article] [PubMed] [Google Scholar]
- 17.Trzonkowski P, Szmit E, Mysliwska J, Mysliwski A. CD4+CD25+ T regulatory cells inhibit cytotoxic activity of CTL and NK cells in humans-impact of immunosenescence. Clin. Immunol. 2006;119:307–316. doi: 10.1016/j.clim.2006.02.002. [DOI] [PubMed] [Google Scholar]
- 18.Huan J, Culbertson N, Spencer L, Bartholomew R, Burrows GG, Chou YK, Bourdette D, Ziegler SF, Offner H, Vandenbark AA. Decreased FOXP3 levels in multiple sclerosis patients. J. Neurosci. Res. 2005;81:45–52. doi: 10.1002/jnr.20522. [DOI] [PubMed] [Google Scholar]
- 19.Balandina A, Lecart S, Dartevelle P, Saoudi A, Berrih-Aknin S. Functional defect of regulatory CD4(+)CD25+ T cells in the thymus of patients with autoimmune myasthenia gravis. Blood. 2005;105:735–741. doi: 10.1182/blood-2003-11-3900. [DOI] [PMC free article] [PubMed] [Google Scholar]
- 20.Pillai V, Ortega SB, Wang CK, Karandikar NJ. Transient regulatory T-cells: a state attained by all activated human T-cells. Clin. Immunol. 2007;123:18–29. doi: 10.1016/j.clim.2006.10.014. [DOI] [PMC free article] [PubMed] [Google Scholar]
- 21.McHugh RS, Whitters MJ, Piccirillo CA, Young DA, Shevach EM, Collins M, Byrne MC. CD4(+)CD25(+) immunoregulatory T cells: gene expression analysis reveals a functional role for the glucocorticoid-induced TNF receptor. Immunity. 2002;16:311–323. doi: 10.1016/s1074-7613(02)00280-7. [DOI] [PubMed] [Google Scholar]
- 22.Ronchetti S, Nocentini G, Riccardi C, Pandolfi PP. Role of GITR in activation response of T lymphocytes. Blood. 2002;100:350–352. doi: 10.1182/blood-2001-12-0276. [DOI] [PubMed] [Google Scholar]
- 23.van Amelsfort JM, van Roon JA, Noordegraaf M, Jacobs KM, Bijlsma JW, Lafeber FP, Taams LS. Proinflammatory mediator-induced reversal of CD4+,CD25+ regulatory T cell-mediated suppression in rheumatoid arthritis. Arthritis. Rheum. 2007;56:732–742. doi: 10.1002/art.22414. [DOI] [PubMed] [Google Scholar]
- 24.Akbar AN, Vukmanovic-Stejic M, Taams LS, Macallan DC. The dynamic co-evolution of memory and regulatory CD4+ T cells in the periphery. Nat. Rev. Immunol. 2007;7:231–237. doi: 10.1038/nri2037. [DOI] [PubMed] [Google Scholar]
- 25.Beyer M, Schultze JL. Regulatory T cells in cancer. Blood. 2006;108:804–811. doi: 10.1182/blood-2006-02-002774. [DOI] [PubMed] [Google Scholar]
- 26.Stephens GL, McHugh RS, Whitters MJ, Young DA, Luxenberg D, Carreno BM, Collins M, Shevach EM. Engagement of glucocorticoid-induced TNFR family-related receptor on effector T cells by its ligand mediates resistance to suppression by CD4+CD25+ T cells. J. Immunol. 2004;173:5008–5020. doi: 10.4049/jimmunol.173.8.5008. [DOI] [PubMed] [Google Scholar]
- 27.Cardona ID, Goleva E, Ou LS, Leung DY. Staphylococcal enterotoxin B inhibits regulatory T cells by inducing glucocorticoid-induced TNF receptor-related protein ligand on monocytes. J. Allergy. Clin. Immunol. 2006;117:688–695. doi: 10.1016/j.jaci.2005.11.037. [DOI] [PubMed] [Google Scholar]
- 28.Sakaguchi S, Ono M, Setoguchi R, Yagi H, Hori S, Fehervari Z, Shimizu J, Takahashi T, Nomura T. Foxp3+ CD25+ CD4+ natural regulatory T cells in dominant self-tolerance and autoimmune disease. Immunol. Rev. 2006;212:8–27. doi: 10.1111/j.0105-2896.2006.00427.x. [DOI] [PubMed] [Google Scholar]
- 29.Dominitzki S, Fantini MC, Neufert C, Nikolaev A, Galle PR, Scheller J, Monteleone G G, Rose-John S, Neurath MF, Becker C. Cutting edge: trans-signaling via the soluble IL-6R abrogates the induction of FoxP3 in naive CD4+CD25 T cells. J. Immunol. 2007;179:2041–2045. doi: 10.4049/jimmunol.179.4.2041. [DOI] [PubMed] [Google Scholar]
- 30.Bettelli E, Carrier Y, Gao W, Korn T, Strom TB, Oukka M, Weiner HL, Kuchroo VK. Reciprocal developmental pathways for the generation of pathogenic effector TH17 and regulatory T cells. Nature. 2006;441:235–238. doi: 10.1038/nature04753. [DOI] [PubMed] [Google Scholar]
- 31.Curiel TJ. Tregs and rethinking cancer immunotherapy. J. Clin. Invest. 2007;117:1167–1174. doi: 10.1172/JCI31202. [DOI] [PMC free article] [PubMed] [Google Scholar]
- 32.Belkaid Y, Rouse BT. Natural regulatory T cells in infectious disease. Nat. Immunol. 2005;6:353–360. doi: 10.1038/ni1181. [DOI] [PubMed] [Google Scholar]
- 33.Zheng SG, Wang J, Wang P, Gray JD, Horwitz DA. IL-2 is essential for TGF-beta to convert naive CD4+CD25- cells to CD25+Foxp3+ regulatory T cells and for expansion of these cells. J. Immunol. 2007;178:2018–2027. doi: 10.4049/jimmunol.178.4.2018. [DOI] [PubMed] [Google Scholar]
- 34.Ahmadzadeh M, Rosenberg SA. IL-2 administration increases CD4+CD25hiFoxp3+ regulatory T cells in cancer patients. Blood. 2006;107:2409–2414. doi: 10.1182/blood-2005-06-2399. [DOI] [PMC free article] [PubMed] [Google Scholar]
- 35.Cesana GC, DeRaffele G, Cohen S, Moroziewicz D, Mitcham J, Stoutenburg J, Cheung K, Hesdorffer C, Kim-Schulze S, Kaufman HL. Characterization of CD4+CD25+ regulatory T cells in patients treated with high-dose interleukin-2 for metastatic melanoma or renal cell carcinoma. J. Clin. Oncol. 2006;24:1169–1177. doi: 10.1200/JCO.2005.03.6830. [DOI] [PubMed] [Google Scholar]
- 36.Zhang H, Chua KS, Guimond M, Kapoor V, Brown MV, Fleisher TA, Long LM, Bernstein D, Hill BJ, Douek DC, Berzofsky JA, Carter CS, Read EJ, Helman LJ, Mackall CL. Lymphopenia and interleukin-2 therapy alter homeostasis of CD4(+)CD25(+) regulatory T cells. Nat. Med. 2005;11:1238–1243. doi: 10.1038/nm1312. [DOI] [PubMed] [Google Scholar]
Associated Data
This section collects any data citations, data availability statements, or supplementary materials included in this article.
Supplementary Materials
Figure 1. No relationship exists between the increased number of CD4+CD25high T cells in RA patients and their disease activity. For number of swollen and tender joints, each symbol represents a different individual, and the horizontal lines indicate the mean values. The RA1 group had a CD4+CD25high to total CD4 ratio of ≤ 0.15, which was equivalent to the average ratio for the HC population. The RA2 group had an intermediate ratio (0.16–0.21), and the RA3 group had a ratio of ≥ 0.22. The ratio of 0.22 was the mean value for the entire RA population (n = 99).
Figure 2. CD25 and FoxP3 expression by CD4+ T cells after activation by anti-CD3/CD28. Representative dot plot of isolated CD25− PBMC cultured for 48 hr with medium (A) or anti-CD3 (10µg/ml) and anti-CD28 (5µg/ml) (B). Cultured cells were gated for CD4+ T cells and assessed for their expression of CD25 and FoxP3 as described in Material & Methods.
Figure 3. GITR expression in unstimulated CD4+CD25− T cells and stimulated CD4+CD25− T cells. To detect GITR expression in the CD4+CD25− T cells at the protein level, CD4+CD25− T cells were isolated from HCs and activated by anti-CD3 (10µg/ml) and anti-CD28 (5µg/ml) for 48 hr. A representative dot plot is shown for the nonstimulated (A) and stimulated (B) cells.
Fig 4. The number of CD4+CD25high T cells in the peripheral blood influenced the number of T cell subsets in the blood. Representative dot plots of the percentage of CD4+CD25high, CD4+CD25low, and CD4+ CD25− T cells in the peripheral blood from HC and RA1 group and RA3 group were assessed in (A, B, and C). The ratio of CD4+CD25high T cells to total CD4+ T cells allowed the RA patients to be sorted as previously described. The bloods were then assayed for the percentage of CD4+ and CD8+ T cells (D, E, and F).