Abstract
Frequency-threshold tuning curves were recorded in thousands of auditory-nerve fibers (ANFs) in chinchilla. Synthetic tuning curves with 21 characteristic frequencies (187 Hz to 19.04 kHz, spaced every 1/3 octave) were constructed by averaging individual tuning curves within 2/3-octave frequency bands. Tuning curves undergo a gradual transition in symmetry at characteristic frequencies (CFs) of 1 kHz and an abrupt change in shape at CFs of 3–4 kHz. For CFs ≤3 kHz, the lower limbs of tuning curves have similar slopes, about −18 dB/octave, but the upper limbs have slopes that become increasingly steep with increasing frequency and CF. For CFs >4 kHz, tuning curves normalized to the CF are nearly identical and consist of three segments. A tip segment, within 30–40 dB of CF threshold, has lower- and upper-limb slopes of −60 and +120 dB/octave, respectively, and is flanked by a low-frequency (“tail”) segment, with shallow slope, and a terminal high-frequency segment with very steep slope (several hundreds of dB/octave). The tuning curves of fibers innervating basal cochlear sites closely resemble basilar-membrane tuning curves computed with low isovelocity criteria. At the apex of the chinchilla cochlea, frequency tuning is substantially sharper for ANFs than for available recordings of organ of Corti vibrations.
INTRODUCTION
The frequency tuning of afferent auditory-nerve fibers (ANFs) derives from the frequency tuning of cochlear vibrations, although the exact relationship between neural and mechanical tuning is still not fully settled (Robles and Ruggero 2001). In particular, it is unclear whether thresholds correspond to constant magnitudes of basilar-membrane (BM) displacement, velocity, or other quantities or whether such magnitudes are the same throughout the cochlea. Here we seek answers to these questions by studying frequency tuning in ANFs of chinchilla, the species in which BM and/or organ of Corti vibrations in nearly normal ears have been described in the greatest detail and at the largest number of cochlear sites, both basal and apical (e.g., Rhode 2007a; Rhode and Cooper 1996; Rhode and Recio 2000; Ruggero et al. 1997). Chinchilla is also the only species for which comparisons of the frequency selectivity of BM vibrations and neural responses are available for the same normal cochleae (Narayan et al. 1998; Ruggero et al. 2000). Although frequency-threshold curves (FTCs) for chinchilla ANFs have been illustrated in several publications (Dallos and Harris 1978; Ruggero 1992; Salvi et al. 1982; Wang et al. 1997), no account of ANF FTCs in this species is comparable in breadth or detail to accounts available for some other mammalian species (Borg et al. 1988; el Barbary 1991; Ohlemiller and Echteler 1990).
We used two large databases of ANF responses to tones to synthesize representative FTCs throughout the range of characteristic frequencies (CFs) in the chinchilla cochlea. In the present report, the first of a set of two, we show that FTCs undergo a smooth transition in symmetry at CFs around 1 kHz and an abrupt change at CFs of 3–4 kHz. We then compare the synthetic FTCs with existing mechanical-vibration data for chinchilla, including a wealth of newly available BM recordings from several basal cochlear sites (Rhode 2007a,b). At the base of the chinchilla cochlea, ANF FTCs closely match BM isovelocity tuning curves with the same CF. At the cochlear apex, ANF FTCs are more sharply tuned than organ of Corti vibrations in chinchilla. The companion paper in the set (Temchin et al. 2008) addresses the spontaneous rates (SRs) of ANFs, shows that FTCs are more sharply tuned in low-SR ANFs than in high-SR ANFs, and presents evidence that the difference in sharpness of tuning arises from the frequency distribution of cochlear compressive nonlinearity. A preliminary account of this work was published as an abstract (Temchin et al. 1997a).
METHODS
All animal procedures were approved by the Animal Care and Use Committee of Northwestern University. Adult chinchillas were initially anesthetized with ketamine hydrochloride (100 mg/kg, injected subcutaneously) and sodium pentobarbital (65 mg/kg) or Dial (diallyl barbituric acid) in urethane (1 g/kg), injected intraperitoneally. Deep anesthesia was maintained with supplemental anesthetic doses to eliminate limb-withdrawal reflexes. (At the end of the experiments, the animal was killed by decapitation while still deeply anesthetized.) Core body temperature was kept near 38°C by means of a servo-controlled electrical heating pad. Tracheotomy and tracheal intubation were performed routinely but forced respiration was used only rarely, as necessitated by apnea or labored breathing. The pinna was resected and part of the bony external ear canal was chipped away to permit visualization of the umbo of the tympanic membrane and insertion of the earphone-coupling speculum, which was then sealed to the bony rim of the ear canal. The tendon of the tensor tympani muscle was severed and the stapedius muscle was detached from its anchoring. A silver ball electrode, placed on the round window, was used to record compound action potentials (CAPs). In most experiments, CAP thresholds were measured for stimulus frequencies from 0.5 to 16 kHz with 0.5-octave steps. In the earliest (84) experiments, CAP thresholds were determined by visual inspection of average waveforms. In the more recent (144) experiments, CAP thresholds were determined automatically under software control as the lowest sound pressure level (SPL) at which the magnitude of N1 (averaged over 64 presentations of 10-ms stimuli with 2-ms rise-fall time, random initial phase) exceeded 10 μV. CAP thresholds were generally measured twice, immediately after placement of the round-window electrode and again after intracranial surgery and exposure of the auditory nerve. ANF FTCs were included in the database only if the second set of CAP thresholds did not exceed the first by >6 dB at any frequency. In any single experiment, data collection was terminated as soon as CF thresholds of high-SR ANFs in any given CF region exceeded earlier thresholds by >10 dB. In a sample of 144 chinchillas, 10-μV CAP thresholds were very uniform between 0.7 and 8 kHz, with means of 25.9–30.3 dB SPL and SDs of 7.9–13.8 dB. At 0.5, 11.3, and 16 kHz, mean thresholds were 32.2 dB SPL ± 9.1 dB, 38.5 dB SPL ± 14.7 dB, and 59.2 dB SPL ± 16.2 dB, respectively.
The dorsal aspect of the auditory nerve was visualized after craniotomy, partial aspiration of the lateral cerebellum and placement of small cotton-ball wedges to slightly separate the brain stem from the temporal bone. Capillary-glass microelectrodes (filled with 3 M NaCl or KCl solutions, impedance 30–100 MΩ) were initially positioned under observation with an operation microscope and were advanced into the nerve by means of a remotely controlled hydraulic drive. The electrical signals were amplified, spikes were discriminated from the background noise, and their counts were stored in digital media.
Stimuli were synthesized digitally under computer control by a custom-built generator (Ruggero and Rich 1983) or Tucker-Davis equipment (in the most recent experiments), converted to analog waveforms and delivered acoustically via a Beyer DT-48 earphone. Stimulus pressure magnitudes were calibrated in situ, near the tympanic membrane, at the beginning of each experimental session (see Temchin et al. 1997b for details). The onset and offset of tone bursts were obtained by multiplying a sinusoid by 0.5 period, between 0 and π radians, of raised-cosine functions [onset: 1 + cos (ωt + π); offset: 1 + cos (ωt)], with 10–90% rise and decay times of 5 ms. The spectral composition of low-frequency stimuli produced by the sound system has been described in some detail elsewhere (see Table 1 in Ruggero et al. 1996). For tones <1 kHz, second-harmonic distortion measured in an artificial cavity was typically less than −50 dB (re the fundamental) at 106–108 dB SPL, but in live chinchillas it could reach −30 dB. For frequencies >1 kHz, second-harmonic distortion did not exceed −55 dB.
White-noise bursts (50-ms duration, presented 3/s) were used as search stimuli while attempting to isolate ANFs. On isolation of an ANF, a 10-s sample of spontaneous activity (spontaneous rate [SR]) was recorded and an FTC was measured with an automated adaptive procedure similar to that used by Kiang and Liberman (Kiang et al. 1970; Liberman 1978). FTC stimuli were 50-ms tone bursts presented every 100 ms. Tone frequencies always started at 24 kHz and were decreased to 359 Hz in 1/32-octave steps. For lower frequencies, down to 80 Hz, resolution was typically changed in 1/16-octave steps but larger steps were used in some recordings. Tone levels were typically started at 90 dB SPL. Frequency-threshold pairs were considered valid only when flanked by pairs with frequencies differing by 1/32 octave (or 1/16 octave or other standard resolution for frequencies <359 Hz) and levels no higher than the limits of the acoustic system minus 6 dB. Tone levels were changed downward in 1-dB steps after the criterion was met and upward in 2-dB steps when not. “Threshold” at a given frequency was defined as a level not meeting the criterion and preceded by two levels meeting the criterion. The criterion consisted of one more spike during the tone burst than in the interstimulus interval.
FTCs measured with the adaptive procedure were included in the database for analysis if they included both the complete upper limb (from CF threshold to 6 dB lower than the SPL limit of the system) and ≥20 dB of the tip region of the lower limb. FTCs of many high-CF ANFs did not include low frequencies. CFs were determined by fitting a third-order polynomial equation to the FTC tips (within 15 dB of the minimum) after smoothing the FTCs using three-point averaging. CF and CF threshold were defined as the frequency and level of the fit minimum. [On average, the fitted CFs differed from the original CFs (the frequencies corresponding to the lowest thresholds of the unsmoothed FTCs) by 0.018 ± 0.094 octave (n = 4,155) and the fitted CF thresholds differed from the original thresholds by 2.97 ± 1.82 dB (n = 4,155).]
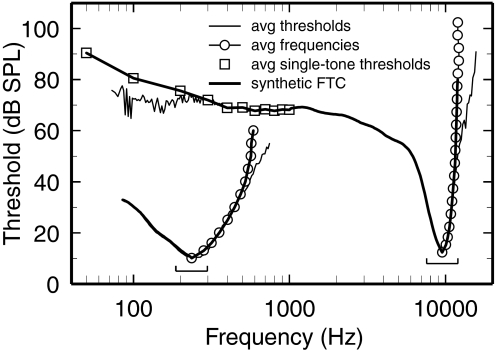
Synthetic tuning curves were constructed (with software written in Matlab) by averaging the individual FTCs and thresholds determined from input–output functions for responses to tones. The upper limbs of the synthetic FTCs were computed by averaging the frequencies of the individual FTCs (expressed in octaves relative to the CFs; circles in Fig. 3) at fixed thresholds relative to CF threshold (i.e., 3, 6, 10, 15 dB, and so forth higher than CF threshold). The lower limbs of the synthetic FTCs were computed by averaging the thresholds of the individual FTCs at fixed frequencies (expressed in octaves re CF; thin solid lines in Fig. 3), complemented at low frequencies (50 and 100–1,000 Hz, in 100-Hz steps) with thresholds determined (20 spikes/s above SR) from rate-level functions for responses to 100-ms tone bursts (five repetitions; repetition period: 300 ms) presented with randomized levels (≤100–118 dB SPL) in 2-dB steps (Ruggero et al. 1996; Temchin et al. 1997).
FIG. 3.
Illustration of the method for constructing synthetic FTCs. The brackets indicate the 2/3-octave ranges of CFs included in constructing 2 synthetic FTCs with CFs of 236 and 9,524 Hz. The thin traces indicate frequency-threshold pairs obtained by averaging the thresholds of individual FTCs (measured using the automated adaptive procedure) at fixed frequencies (method A). The open circles indicate frequency-threshold pairs obtained by averaging the frequencies of FTCs at fixed thresholds (method B). The squares indicate average frequency-threshold pairs extracted from a database of rate-intensity functions for single tones (frequencies: 50 Hz and 100–1,000 Hz in steps of 100 Hz) (method C). The thick traces indicate synthetic tuning curves obtained by combining the 3 sets of frequency-threshold pairs. Note that the thin trace for the lower limb of the low-CF FTC is hidden by the thick trace. Methods A and B, respectively, were used to construct the upper limb and the lower limb (except for its lowest frequencies) of the synthetic FTCs. Method C was combined (by weighted averaging) with method A to produce the tail segments of high-CF synthetic FTCs for frequencies ≤1 kHz. At CF, the synthetic FTCs include data from 91 to 394 ANFs. Each square represents 11–54 ANFs. Each point of the synthetic FTCs represents data from ≥10 ANFs.
RESULTS
Here we analyze threshold/frequency pairs for responses to tones of thousands of ANFs recorded over many years in chinchilla (Ruggero and Rich 1983, 1987; Ruggero et al. 1996; Temchin et al. 1997b). FTCs were measured using an automated adaptive procedure (see methods) similar to that used by Kiang and Liberman (Kiang et al. 1970; Liberman 1978).
Features of individual FTCs as functions of CF and SR
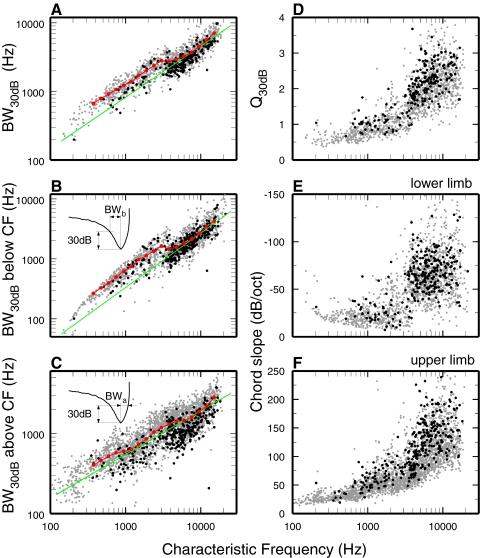
Figure 1 provides an overview of the variation of several FTC features (bandwidths [BWs], Q values, and chord slopes) in individual ANFs as functions of CF and SR, focusing on measurements at thresholds 30 dB higher than CF thresholds. In logarithmic coordinates, BWs increase with CF at constant but somewhat different rates at CFs higher and lower than 3–4 kHz, where a clear downward “jog” is evident (Fig. 1A). The origin of the “jog” in Fig. 1A is clarified on computation of partial BWs measured relative to CF (i.e., between CF and the lower or upper 30-dB cutoffs; see insets). These are plotted as functions of CF in Fig. 1, B and C. The lower (<CF) partial BWs (but not the upper partial BWs) exhibit a clear discontinuity at CFs between 3 and 4 kHz (compare red and green trend lines for CFs <3 kHz in Fig. 1B). The discontinuity is also clearly seen in a plot of the lower-limb chord slopes versus CF (Fig. 1E). (The curved “ceiling” for CFs <3 kHz in Fig. 1B and the “floor” for the same CFs in Fig. 1E are artifacts of the 80-Hz limit of FTC frequencies.)
FIG. 1.
Representative analyses of frequency-threshold curve (FTC) bandwidths (BWs), Q values, and chord slopes for low- and high-spontaneous rate (SR) auditory-nerve fibers (ANFs). All analyses are carried out for thresholds 30 dB higher than characteristic frequency (CF) threshold. Black symbols: low-SR (<1/s) ANFs. Gray symbols: high-SR (≥18/s). A: overall BWs measured at levels 30 dB higher than CF threshold. B: partial BWs below CF. The inset illustrates the definition of “partial BW below CF,” BWb. C: partial BWs above CF. The inset illustrates the definition of “partial BW above CF,” BWa. D: Q30 values corresponding to overall BWs (A). E: FTC chord slopes measured between CF thresholds and lower-limb thresholds 30 dB higher than CF thresholds. F: FTC chord slopes measured between CF thresholds and upper-limb thresholds 30 dB higher than CF thresholds. Green lines indicate regressions for high-SR ANFs with CFs >4 kHz. Red symbols indicate averages from synthetic FTCs (Fig. 4). Numbers of low- and high-SR ANFs represented in each panel: A, B, D, and E, 214 and 1,246; C and F, 318 and 2,426.
Figure 1 also allows for comparison of the FTC features in high-SR (gray symbols) and low-SR (black symbols) ANFs. As previously shown for cat (Kiang et al. 1976; Liberman 1978), low-SR ANFs in chinchilla have narrower BWs and higher Q values than those of high-SR ANFs. Differences in frequency tuning between low- and high-SR ANFs are further explored in a companion paper (Temchin et al. 2008).
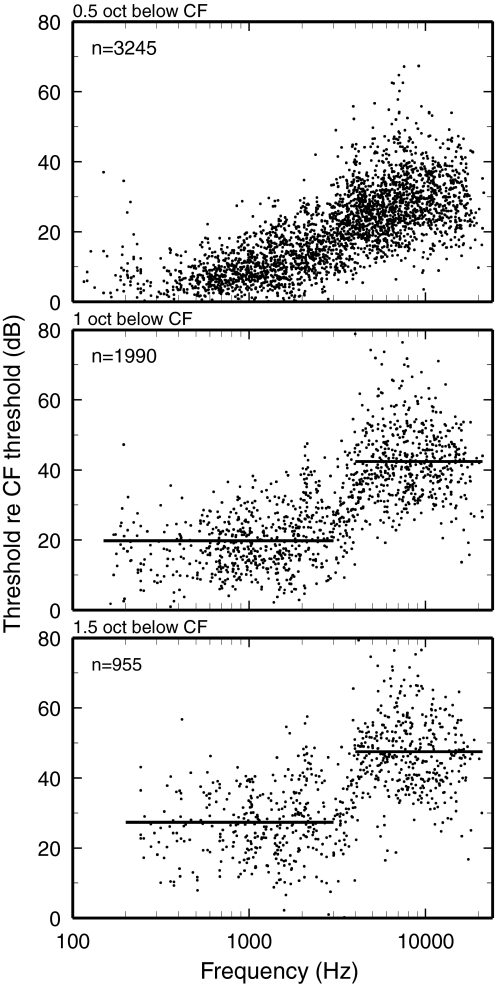
The near-discontinuity of FTC shapes in the 3- to 4-kHz CF region is dramatically illustrated by plotting measures of “tip-to-tail ratio,” thresholds re CF threshold at frequencies 0.5, 1, and 1.5 octaves lower than CF, against CF (Fig. 2). Except for the transition region (CFs 3–4 kHz), the tip-to-tail ratios vary minimally as a function of CF. For tip-to-tail ratios measured at −1 and −1.5 octaves re CF, slopes jump at the transition region between 20 and 30 dB for CFs <3 kHz to 40–50 dB for CFs >4 kHz.
FIG. 2.
Thresholds at tail frequencies re CF threshold. A: thresholds relative to CF thresholds at frequencies 0.5 octave lower than CF. B: relative thresholds at frequencies 1 octave lower than CF. C: relative thresholds at frequencies 1.5 octave lower than CF. Flat lines indicate averages for CFs ≤3 and ≥4 kHz. Numbers of ANFs are indicated in each panel.
Synthetic FTCs
Figure 3 illustrates how individual ANF FTCs were averaged within 2/3 octave CF bands (indicated by brackets) and combined with thresholds of input–output functions for responses to low-frequency tones (squares) to produce “synthetic” FTCs (thick traces). The two synthetic FTCs of Fig. 3, centered at CFs of 236 and 9,524 Hz, are representative of those for low- and high-CF ANFs. The thin traces and squares indicate thresholds averaged at fixed frequencies and the circles indicate frequencies averaged at fixed thresholds. At most frequencies the averages produced by the two methods coincide perfectly; however, the averages diverge at the highest frequencies of the FTC upper limbs, at which FTC slopes are steepest: the thin trace curves, resulting from averaging thresholds, have shallower slopes than the loci of the circles–this is an artifact. In general, functions such as FTCs have high-slope segments with well-defined abscissa positions (frequencies) but poorly defined ordinate positions (thresholds). As a result, even small errors in estimating frequencies for individual FTCs will yield FTC averages with slopes smaller than the slopes of the individual FTCs. For this reason, the upper limbs of the synthetic FTCs were obtained by averaging frequencies, as indicated by the coincidence of the thick traces and the circles.
The lower limbs of the synthetic FTCs were principally computed by averaging thresholds at fixed frequencies, as indicated by the full overlap of the thin and thick traces at most frequencies <CF. However, for frequencies ≤1 kHz, thresholds specified from FTCs were complemented by thresholds (squares in Fig. 3) determined from input–output functions measured for responses to tones (50 and 100 Hz and its multiples, ≤1,000 Hz). This was convenient because individual FTCs were often incomplete, lacking data for the lowest tail frequencies (note divergence between thin and thick traces at the lowest frequencies). Averages were computed over 2/3-octave CF bands (e.g., brackets in Fig. 3) centered in 21 1/3-octave steps.
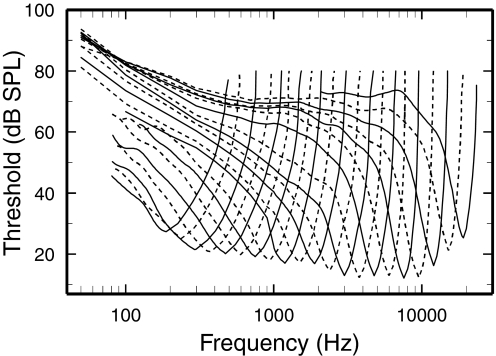
Figure 4 shows smoothed FTCs of high-SR ANFs computed for 21 2/3-octave CF bands with CFs centered every 1/3-octave, from 187.5 Hz to 19.05 kHz. In general FTC shapes vary in an orderly manner, with approximately parallel lower and upper FTC limbs around the CFs. However, closer inspection reveals a specially wide separation of the FTC lower limbs in the frequency region 1–2 kHz, corresponding to the 3- to 5-kHz CF region separating ANFs with FTC with tails from those without tails.
FIG. 4.
Synthetic FTCs for high-SR ANFs. Synthetic FTCs constructed according to the method illustrated in Fig. 3. Curves for CFs ≥3 kHz were smoothed at frequencies <1 kHz. Values are plotted only for averages including ≥10 samples. The tip of each synthetic FTC represents responses of 81–486 ANFs.
Bandwidth, sharpness of tuning, and asymmetry of FTCs as functions of CF
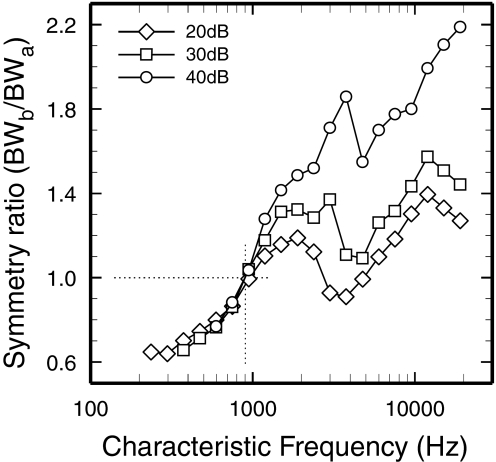
The ratios of the partial bandwidths below and above CF (BWb/BWa; see insets of Fig. 1, B and C) provide measures of FTC asymmetry, which are plotted in Fig. 5 against CF. Exact symmetry is indicated by a ratio of 1, at CF ≈900 Hz. For CFs <900 Hz, the ratios were <1, i.e., the upper-limb partial FTC BWs were wider than the lower-limb BWs; for CFs >900 Hz, the ratios were >1, i.e., the upper-limb partial FTC BWs were narrower than the lower-limb BWs. The asymmetry ratios grew monotonically with CF up to about 2 kHz. Monotonic growth was interrupted at CFs of 3–5 kHz, where prominent notches are evident. The notches coincide and are consistent with the discontinuities in the growth with CF of the 30-dB BW (Fig. 1A) and, especially, of the partial below-CF BW (Fig. 1B).
FIG. 5.
Symmetry and asymmetry of FTCs as a function of CF. The asymmetry of the FTC tips was estimated as the ratio BWb /BWa (see insets in Fig. 1, B and C) measured at 20, 30, and 40 dB re CF threshold. FTCs of ANFs with CFs near 900 Hz (vertical dotted line) have “perfect” symmetry (horizontal dotted line). Data computed from synthetic FTCs of Fig. 4.
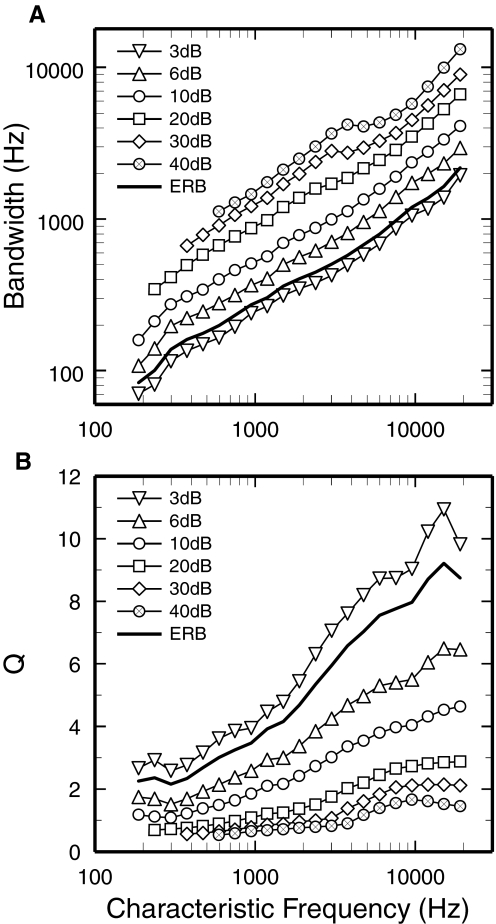
Figure 6 summarizes the variation of BWs and Q values, measured from the synthetic FTCs, as functions of CF. Averaged equivalent rectangular bandwidths (ERBs) as well as BWs at 3, 6, 10, 20, 30, and 40 dB are plotted in Fig. 6A. On first observation, BWs appear to increase with CF following power functions with similar slopes. However, closer inspection reveals transitions, consistent with those seen in Fig. 1, in the 3- to 4-kHz CF region. For measurements at 10–40 dB re CF threshold, BWs grew at faster rates for CFs >3–4 kHz (0.81–0.87 oct/oct) than for lower CFs (0.57–0.74 oct/oct). To estimate sharpness of tuning, Q values were computed by dividing CFs by BWs, yielding QERB, Q3dB, Q6dB, Q10dB, Q20dB, Q30dB, and Q40dB. These are plotted against CF in Fig. 6B. For CFs >4 kHz, QERB, Q3dB, Q6dB, and Q10dB grew at roughly constant rates as functions of increasing CF. In contrast, curves for Q20dB, Q30dB, and Q40dB tended to saturate at CFs >6 kHz.
FIG. 6.
Bandwidth and sharpness of tuning of FTC tips. A: FTC equivalent rectangular bandwidth (ERB) and BWs at levels 3, 6, and 10–40 dB higher than CF thresholds are plotted as functions of CF. B: Q values (CF divided by BW) are shown for the ERB and for the BWs at levels 3, 6, and 10–40 dB higher than CF thresholds. Data computed from synthetic FTCs of Fig. 4.
Normalized synthetic FTCs
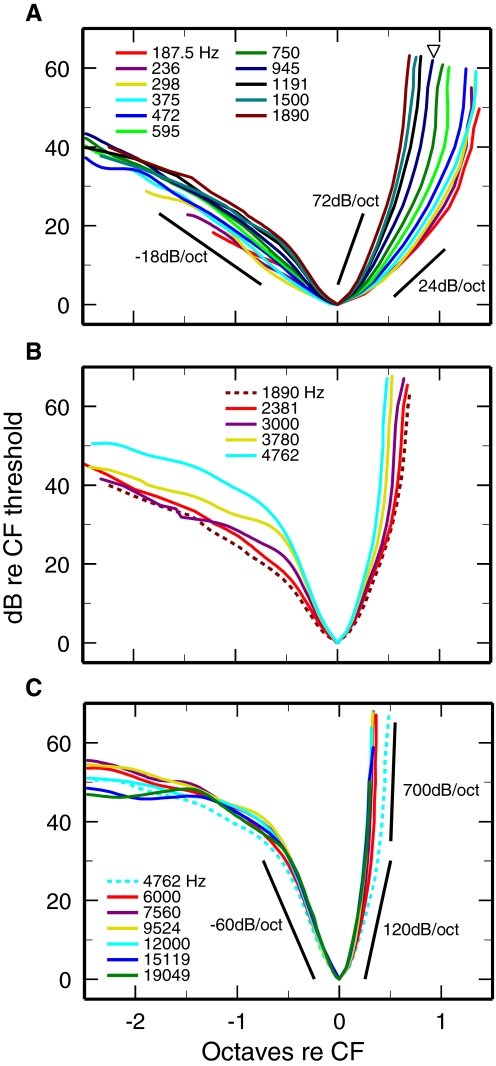
To facilitate appreciation of the changes of FTC shapes as a function of CF, Fig. 7 shows synthetic FTCs of high-SR ANFs plotted in logarithmic coordinates after normalization to CF threshold and CF. When plotted in this manner, FTCs with CFs ≥6 kHz are nearly identical (Fig. 7C), regardless of CF, and consist of three segments. A tip segment, within 30–40 dB of CF threshold, has lower- and upper-limb slopes of −60 and +120 dB/octave. The tip segment is flanked by a low-frequency (“tail”) segment, with shallower slope, and a terminal high-frequency segment with very steep slope (hundreds of dB/octave).
FIG. 7.
Synthetic FTCs of high-SR ANFs normalized to CF and CF threshold. The thresholds of the synthetic FTCs of Fig. 4 are expressed in dB re CF threshold and the frequencies are expressed as octaves re CF. A: CFs ≤1.9 kHz. B: CFs: 1.9–4.8 kHz. C: CFs ≥4.8 kHz.
Low-CF FTCs (Fig. 7A) are roughly “V”-shaped, so that tip and tail segments cannot be recognized. Although the slopes of the lower limbs of low-CF FTCs grow somewhat steeper as a function of CF, they do not differ greatly from −18 dB/octave in the entire 0.19- to 1.9-kHz CF range. In contrast, the slopes of the upper limbs of low-CF FTCs grow with increasing CF at a relatively rapid rate (Fig. 7A). The triangle in Fig. 6A indicates the CF, 945 Hz, at which the flip in tuning asymmetry occurs (Fig. 5). It is clear that the flip in asymmetry arises to a large extent from the rapid increase of the upper-limb slopes as a function of CF, which more than compensates for the (slower) increase of the lower-limb slopes.
The transition between low- and high-CF FTC shapes in the 3- to 4-kHz CF range (Figs. 1 and 2) is also illustrated in Fig. 7B: the shapes of the lower limbs of the FTCs change drastically and the distinction between tip and tail becomes increasingly evident. The salient features of the variation of FTCs with CF (Figs. 1, 2, 5, and 7) suggest that the chinchilla cochlea consists of distinct segments extending apically and basally from the region with CF 3–4 kHz. The dependence on CF of other aspects of ANF properties also suggests physiological differences between the apical and basal segments of the cochlea (see discussion).
Absence of high-frequency plateaus in ANF FTCs
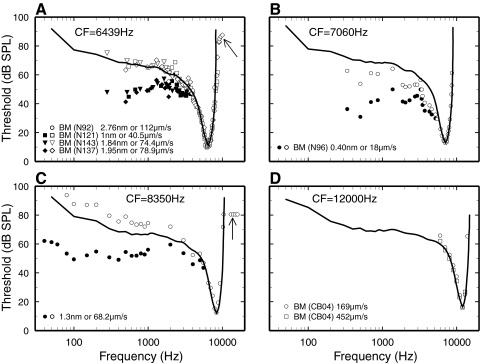
High-frequency amplitude plateaus (arrows in Fig. 8, A and B), at which vibrations are linear, are routinely observed in BM vibrations at the base of the cochlea at levels as low as 70–80 dB SPL (e.g., Figs. 8, 9, and 11 of Ruggero et al. 1997 and middle panel of Fig. 2 of Cooper and Rhode 1997; see also Cooper and Rhode 1992; Narayan et al. 1998; Ruggero et al. 1990; Wilson 1992). Narayan et al. (1998) recorded from BM sites and ANFs in the same two chinchilla cochleae with open scalae tympani (see Ruggero et al. 2000) and showed that BM responses, but not ANF FTCs, exhibited high-frequency amplitude plateaus. In the present series of experiments, FTCs were measured for 56 ANFs (CFs: 1–11 kHz) from two cochleae in which the otic capsule was also perforated (as for recording BM vibrations) without causing any elevation of CAP thresholds. High-frequency plateaus were never found, even when (occasionally) stimuli exceeded CF threshold by 90 dB, confirming that the high-frequency plateaus in BM recordings are not artifacts associated with opening the otic capsule (Narayan et al. 1998; Ruggero et al. 2000).
FIG. 8.
Comparison of ANF and basilar-membrane (BM) frequency tuning at basal sites of the chinchilla cochlea. Solid lines: synthetic ANF FTCs, constructed in the same manner as those of Fig. 4, for CFs matching those of the BM responses. Open symbols: sound pressure levels (SPLs) required for eliciting the indicated velocity magnitudes (i.e., isovelocity pseudothresholds). Filled symbols: SPLs required for eliciting the indicated displacement magnitudes (i.e., isodisplacement pseudothresholds). For clarity, isodisplacement pseudothresholds are not shown for frequencies near CF. A: CF, 6.4 kHz. BM data from Figs. 15, A, C, and D of Rhode (2007b) and 8A of Rhode (2007a). In 3 cases the isodisplacement data points were shifted upward (to 1.84, 1.95, and 2.78 nm) to match the CF thresholds of the synthetic ANF FTCs. B: CF, 7.1 kHz. BM data from Fig. 15B of Rhode (2007b), shifted downward by 7 dB. C: CF, 8.35 kHz. BM data from Fig. 22 of Ruggero et al. (1990). The isodisplacement and isovelocity data points were shifted downward by 3.4 dB. D: CF, 12 kHz. Squares: velocity corresponding to neural CF threshold, 16 dB SPL. Circles: from the same data, velocity shifted upward by 7 dB. BM data from Fig. 1A of Rhode and Recio (2000).
Relationship between frequency tuning in ANFs and BM vibrations at the base of the cochlea
The tips of tuning curves of ANFs and BM responses at the base of the cochlea are nearly identical in chinchilla (Rhode 2007a; Robles et al. 1986; Ruggero et al. 1990, 1997) and probably also guinea pig (Sellick et al. 1982). It is not yet certain whether ANF FTCs more closely match isodisplacement or isovelocity BM tuning curves or some combination thereof (e.g., Rhode 2007a). Comparisons of ANF and BM data obtained both in individual chinchillas (Narayan et al. 1998) and in different groups of animals suggest that ANF FTCs match BM isoresponse values intermediate between constant velocity and constant displacement but closer to constant velocity (Ruggero et al. 1990, 2000). Figure 8C updates the group comparisons using a synthetic ANF FTC with CF = 8.35 kHz (solid line in Fig. 8C), constructed in the same manner as the ANF FTCs of Fig. 4. Again, the average ANF FTC falls close to the BM isovelocity curve.
Previous comparisons of mechanical and neural tuning in the chinchilla cochlea were carried out for CFs in the 8- to 10-kHz range. Rhode and Recio have published a treasure trove of high-quality BM data from several additional basal sites of chinchilla cochleae (Rhode 2007a,b; Rhode and Recio 2000) that now permit comparing BM and ANF tuning for CFs as low as 6.4 kHz and as high as 12 kHz. Figure 8, A, B, and D shows comparisons of isoresponse curves from those cochleae with synthetic ANF FTCs constructed in the same manner as the ANF FTCs of Fig. 4, with CFs chosen to match the BM CFs. In every case, the tips of the ANF FTCs and of the BM isoresponse curves are identical. When the comparisons are carried out over sufficiently wide frequency ranges, the ANF FTCs match the BM isovelocity curves either nearly perfectly (Fig. 4A) or much more closely than the isodisplacement curves (Fig. 4B). In other words, high-pass filtering with slopes approaching 6 dB/octave occurs between BM displacement and spike generation in ANFs.
Relationship between frequency tuning in ANFs and BM vibrations at the apex of the cochlea
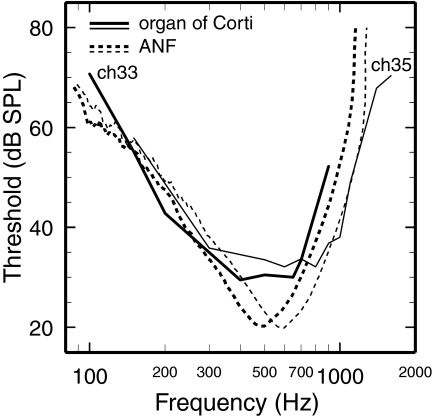
Figure 9 compares the frequency tuning of neural responses and mechanical vibrations for apical sites of the chinchilla cochlea with nominal CFs of 500 and 600 Hz (see Table 1 of Rhode and Cooper 1996). The solid lines indicate isovelocity curves (30 and 5 μm/s) for two chinchilla cochleae (computed from isodisplacement curves in Fig. 12 of Rhode and Cooper 1996). The dashed lines indicate synthetic ANF FTCs, constructed in the same manner as those of Fig. 4, for CFs comparable to those of the BM responses. The lower and upper limbs of the neural and mechanical tuning curves have similar slopes. However, the similarity of the lower limbs is probably partly an artifact: since the mechanical data were obtained in unsealed cochleae, the mechanical lower-limb slope is spuriously enhanced at a rate of −6 dB/octave (Dong and Cooper 2006). ANF FTCs have well-defined, moderately sharp tips, whereas the mechanical tuning curves have ill-defined and blunt tips. The BWs at 10 dB above the minimum are >50% larger for the mechanical tuning curves (523 and 686 Hz) than for the ANF FTCs (309 and 457 Hz). The ANF FTCs have Q10 values of 1.37 and 1.46, whereas the mechanical tuning curves have Q10 values of 0.77 (CH35) and 0.97 (CH33), computed on the basis of the nominal CFs, 500 and 600 Hz.
FIG. 9.
Comparison of ANF and BM frequency tuning at apical sites of the chinchilla cochlea. Solid lines: isovelocity tuning curves for vibrations at apical sites in 2 chinchilla cochleae. Dashed lines: synthetic chinchilla ANF FTCs constructed in the same manner as the FTCs of Fig. 4 for CFs comparable to the nominal CFs of the mechanical responses (see Table 1 of Rhode and Cooper 1996). Thick lines: 500-Hz CF; thin lines: 600-Hz CF. The isovelocity curves have been computed on the basis of 1-nm tuning curves in Fig. 12 of Rhode and Cooper (1996): BM vibrations in ch33 (500-Hz CF; 5 μm/s criterion) and tectorial-membrane vibrations in ch35 (600-Hz CF; 30 μm/s criterion). Numbers of ANFs averaged at frequencies near CF: 139 (500 Hz) and 187 (600 Hz).
DISCUSSION
CF dependence of FTC shapes: differences for CFs higher and lower than 3–4 kHz
In chinchilla, ANF FTC shapes undergo abrupt changes in the 3- to 4-kHz CF region: 1) when normalized to CF, FTCs with higher CFs are nearly identical, regardless of CF (Fig. 7C), whereas FTCs with CF <3–4 kHz change systematically with CF, particularly in their upper limbs (Fig. 7A); 2) the slopes of the lower limbs of the FTCs change abruptly, roughly from about −25 dB/octave for CFs <3–4 kHz to −70 dB/octave for higher CFs (Figs. 1E and 7). Abrupt changes in the lower limb of FTCs were previously described for gerbil in the same CF region (Ohlemiller and Echteler 1990; Schmiedt 1989) and, as noted by Schmiedt (1989), probably also exist in cat (see Fig. 14 of Liberman 1978 and Fig. 3 of Javel 1994).
To the extent that FTCs reflect BM vibrations and recalling that each octave of CF subtends an approximately fixed distance on the BM (Eldredge et al. 1981; Greenwood 1990; Müller et al. 2008), the similarity of FTCs at the base of the chinchilla cochlea (Fig. 7C) implies that the envelopes of the BM traveling wave are identical and that the number of wavelengths in the traveling waves are the same, regardless of frequency. The existence of this property of cochlear mechanics—“scaling symmetry”—was apparently first conjectured by Zweig (1976) on the basis of Rhode's earliest BM data for squirrel monkey (Rhode 1971). In chinchilla, scaling symmetry applies to CFs >4 kHz, corresponding to the basal third of the cochlea (Eldredge et al. 1981; Müller et al. 2008) but does not apply to the remainder, i.e., the apical 2/3 of the cochlea (Fig. 7, A and B).
Other differences between cochlear responses for CFs higher and lower than 3–4 kHz
Systemic administration of furosemide alters FTC shapes differently across the 3- to 4-kHz CF boundary (Sewell 1984): tip-to-tail ratios are much reduced for FTCs of ANFs with CFs >4 kHz but less so or not at all for lower CFs. The CF-specific effect of furosemide on high-CF ANFs is due to a corresponding effect on BM vibrations at the base of the cochlea (Ruggero and Rich 1991): furosemide temporarily abolishes the active process, reducing sensitivity and compressive nonlinearity at CF. The lesser effect of furosemide on FTCs of ANFs with CF <3 kHz suggests that amplification and CF-specific compression play lesser roles in apical regions than in basal regions of the cochlea.
Differences in the strength and CF specificity of BM compressive nonlinearity across the 3- to 4-kHz CF boundary probably explain why putative “BM” input–output functions derived from responses of ANFs are less compressive for CFs <4 kHz than for higher CFs (Cooper and Yates 1994), may account for the weaker modulation of ANF CF responses by low-frequency tones in low-CF ANFs than in high-CF ANFs (see Fig. 8 in Temchin et al. 1997b), and may help to explain why the increases of CF thresholds induced by cochlear cooling are larger in high-CF ANFs than in low-CF ANFs (Ohlemiller and Siegel 1994). In addition to differences in frequency tuning and its lability across the 3- to 4-kHz CF boundary, the timing of ANF responses also changes abruptly around the same CF region: the phases of responses to low-frequency tones (≤600 Hz) undergo a shift amounting to nearly π radians (Ruggero and Rich 1983, 1987; Ruggero et al. 1996) and the onset delays of “impulse responses” measured using Wiener kernels jump by 0.3–0.5 ms (see Fig. 15A of Recio-Spinoso et al. 2005).
Implication for low-frequency suppression of the near-velocity sensitivity of excitation in high-CF ANFs
Because suppression of BM responses to CF tones by low-frequency tones requires suppressor displacement magnitudes at least as large as the responses to the CF tones (Geisler and Nuttall 1997), the existence of neural suppression of CF tones by nonexcitatory low-frequency tones (Cai and Geisler 1996; Fahey and Allen 1985; Temchin et al. 1997b) has led to questioning whether this neural phenomenon has a BM correlate (Rhode 2007b), or to postulating the existence of “synaptic suppression” in low-SR ANFs (Cai and Geisler 1996). In fact, 4–6 dB/octave high-pass filters interposed between BM vibrations and the receptor potentials of inner hair cells can fully account for neural suppression of CF tones by nonexcitatory low-frequency tones, especially in the case of low-SR ANFs [see companion paper (Temchin et al. 2008)], that are relatively insensitive (see Cheatham 2008; Temchin et al. 1997b).
Tuning, compressive nonlinearity, and amplification at low-CF sites of the chinchilla cochlea
The tuning discrepancies between mechanical and neural responses at low-CF sites (Fig. 9) may indicate the existence of an apical “second filter” interposed between organ of Corti vibrations and neural excitation. Evidence for such a “second filter” comes principally from recordings in well-sealed guinea pig cochleae, where the magnitudes of apical vibration are essentially low-pass (rather than band-pass) in nature (Dong and Cooper 2006). Another possibility is that the apparent broad tuning of apical mechanical vibrations is partly due to abnormally weak amplification caused by surgical trauma. At apical sites of the chinchilla cochlea, compression extends over the entire frequency range of responses, so that tuning hardly changes as a function of stimulus level (Rhode and Cooper 1996). Therefore it is appropriate to measure amplification as the difference between the peak magnitudes of responses to low- and high-level stimuli (see Robles and Ruggero 2001). Using this definition, amplification at basal sites of the chinchilla cochlea with CF of 9–10 kHz amounts to, at most, 46 dB (see Table 1 of Robles and Ruggero 2001). At apical sites of the chinchilla cochlea, amplification has been reported as 14–18 dB (Rhode and Cooper 1996), although an independent estimate based on Fig. 2 of Rhode and Cooper (1997) indicates amplification of about 30 dB. Therefore it is possible that in normal chinchilla cochleae amplification at the apex is weaker than that at the base by only 16 dB (i.e., 46 minus 30) or less.
ANF FTCs in different species
To a first approximation, the shapes of the FTCs of ANFs and their dependence on CF in chinchilla are similar to the patterns found in other species. In chinchilla and cat, thresholds converge at low frequencies (see Figs. 4 and 8 of Kiang 1984). In most species, high-CF ANF FTCs have distinct tip segments around CF, with relatively steep slopes, and tail segments at low frequencies, with relatively flat slopes. However, tails may be lacking in ANF FTCs of macaque monkey (Joris et al. 2006). The transition between tail and tip is smooth and monotonic in chinchilla (Figs. 4 and 7), gerbil (Ohlemiller and Echteler 1990; Schmiedt 1989), guinea pig (Evans 1972; Robertson and Johnstone 1979), rat (el Barbary 1991), mouse (Taberner and Liberman 2005), and rabbit (Borg et al. 1988), but includes a notch in cat FTCs (see Figs. 2, 3, 7, and 8 in Kiang and Moxon 1974; and Figs. 5 and 12 in Javel 1994). Javel (1994) described a break in the upper limb of high-CF ANFs of cat at 20–35 dB re CF threshold, which seems to coincide in level with the inflections of the upper limbs of chinchilla FTCs (Fig. 7). The upper limbs of low-CF ANF FTCs of cat often include “shoulders” marking the transition between the tip and “high-frequency tails” (Javel 1994; Kiang 1984). Such shoulders are not seen in FTCs of low-CF chinchilla ANFs.
Regardless of overall FTC shape, the Q10 values of the FTC tips increase systematically with increasing CF in all mammalian species (e.g., Fig. 6). Taberner and Liberman (2005) showed that the Q10 values of ANF FTCs measured with identical automated procedures in mouse, gerbil, guinea pig, chinchilla, and cat are similar over the CF range 0.7–20 kHz (Fig. 11 of Taberner and Liberman 2005). Ruggero and Temchin (2005) argued that such similarity may also extend to squirrel monkey and humans in spite of striking differences in cochlear lengths (Fig. 6 of Ruggero and Temchin 2005). Nevertheless, their Fig. 6A does show differences between the Q10 values for chinchilla and other species, particularly for high CFs (Ruggero and Temchin 2005). Specifically, in the 10-kHz region Q10 values ranged from 4.6 for chinchilla to 6.3 for squirrel monkey (a New-World primate). An even larger difference may exist between chinchillas and macaques (Old-World monkeys). Our analysis (not shown) of a plot of Q10 versus CF for Macaca irus and Macaca mulatta (Fig. 1 of Nomoto 1980) yields an average Q10 of 9.7 at CFs of about 10 kHz (albeit with large variance: SD = 5.3). Although it is uncertain whether those findings in macaque (based on FTCs measured using “audiovisual” criteria) are fully comparable with findings in other species (based on FTCs obtained with automated procedures), they are consistent with a recent abstract reporting that Q10 and Q40 values in macaque are larger than those in cat (Joris et al. 2006). Enhanced frequency tuning in primates, especially those native to the Old World, is of interest in the context of the unresolved controversy on whether humans (Old-World primates) have exceptionally sharp cochlear tuning (Ruggero and Temchin 2005; Shera et al. 2002).
Summary and conclusions
) FTCs flip their asymmetry gradually at a CF of about 1 kHz (Figs. 5 and 7A) and their shapes change abruptly in the 3- to 4-kHz CF region (Figs. 1, 2, 4, 5, and 7B). The 3- to 4-kHz CF boundary coincides with the boundary at which several other aspects of cochlear physiology, including the phases of ANF responses to low-frequency tones (Ruggero and Rich 1987; Ruggero et al. 1996) and the lability of FTC shapes (Sewell 1984), also change substantially. Such changes suggest that BM vibrations and/or their translation into neural excitation differ substantially between apical and basal segments of the cochlea.
) At the base of the chinchilla cochlea, ANF FTCs more closely resemble BM isovelocity tuning curves than isodisplacement curves. The near correspondence of ANF thresholds to constant BM velocity helps explain suppression of near-CF ANF responses by nonexcitatory low-frequency tones (Cheatham 2008; Temchin et al. 1997b).
) FTCs of low-CF ANFs are sharper than published isoresponse tuning curves for apical vibrations in chinchilla cochleae. This implies that existing mechanical recordings are not representative of fully normal chinchilla cochleae and/or that a “second filter” is interposed between vibrations and spike generation.
) The CF-dependent features of chinchilla FTCs, including their shape transitions at CFs of 1 and 3–4 kHz, resemble those of other mammalian species. However, high-CF ANF FTCs may be less sharply frequency tuned in chinchilla than in monkeys.
GRANTS
This work was supported by National Institute on Deafness and Other Communication Disorders Grants DC-000110 and DC-000419.
The costs of publication of this article were defrayed in part by the payment of page charges. The article must therefore be hereby marked “advertisement” in accordance with 18 U.S.C. Section 1734 solely to indicate this fact.
REFERENCES
- Borg et al. 1988.Borg E, Engström B, Linde G, Marklund K. Eighth nerve fiber firing features in normal-hearing rabbits. Hear Res 36: 191–202, 1988. [DOI] [PubMed] [Google Scholar]
- Cai and Geisler 1996.Cai Y, Geisler CD. Suppression in auditory-nerve fibers of cats using low-side suppressors. II. Effect of spontaneous rates. Hear Res 96: 113–125, 1996. [DOI] [PubMed] [Google Scholar]
- Cheatham 2008.Cheatham MA Comment on “Mutual suppression in the 6 kHz region of sensitive chinchilla cochleae” [J Acoust Soc Am 121: 2805–2818, 2007]. J Acoust Soc Am 123: 602–605, 2008. [DOI] [PubMed] [Google Scholar]
- Cooper and Rhode 1992.Cooper NP, Rhode WS. Basilar membrane mechanics in the hook region of cat and guinea-pig cochleae: sharp tuning and nonlinearity in the absence of baseline position shifts. Hear Res 63: 163–190, 1992. [DOI] [PubMed] [Google Scholar]
- Cooper and Rhode 1997.Cooper NP, Rhode WS. Mechanical responses to two-tone distortion products in the apical and basal turns of the mammalian cochlea. J Neurophysiol 78: 261–270, 1997. [DOI] [PubMed] [Google Scholar]
- Cooper and Yates 1994.Cooper NP, Yates GK. Nonlinear input–output functions derived from the responses of guinea-pig cochlear nerve fibres: variations with characteristic frequency. Hear Res 78: 221–234, 1994. [DOI] [PubMed] [Google Scholar]
- Dallos and Harris 1978.Dallos P, Harris D. Properties of auditory nerve responses in absence of outer hair cells. J Neurophysiol 41: 365–383, 1978. [DOI] [PubMed] [Google Scholar]
- Dong and Cooper 2006.Dong W, Cooper NP. An experimental study into the acousto-mechanical effects of invading the cochlea. J R Soc Interface 3: 561–571, 2006. [DOI] [PMC free article] [PubMed] [Google Scholar]
- el Barbary 1991.el Barbary A Auditory nerve of the normal and jaundiced rat. II. Frequency selectivity and two-tone rate suppression. Hear Res 54: 91–104, 1991. [DOI] [PubMed] [Google Scholar]
- Eldredge et al. 1981.Eldredge DH, Miller JD, Bohne BA. A frequency-position map for the chinchilla cochlea. J Acoust Soc Am 69: 1091–1095, 1981. [DOI] [PubMed] [Google Scholar]
- Evans 1972.Evans EF The frequency response and other properties of single fibres in the guinea-pig cochlear nerve. J Physiol 226: 263–287, 1972. [DOI] [PMC free article] [PubMed] [Google Scholar]
- Fahey and Allen 1985.Fahey PF, Allen JB. Nonlinear phenomena as observed in the ear canal and at the auditory nerve. J Acoust Soc Am 77: 599–612, 1985. [DOI] [PubMed] [Google Scholar]
- Geisler and Nuttall 1997.Geisler CD, Nuttall AL. Two-tone suppression of basilar membrane vibrations in the base of the guinea pig cochlea using “low-side” suppressors. J Acoust Soc Am 102: 430–440, 1997. [DOI] [PubMed] [Google Scholar]
- Greenwood 1990.Greenwood DD A cochlear frequency-position function for several species—29 years later. J Acoust Soc Am 87: 2592–2605, 1990. [DOI] [PubMed] [Google Scholar]
- Javel 1994.Javel E Shapes of cat auditory nerve fiber tuning curves. Hear Res 81: 167–188, 1994. [DOI] [PubMed] [Google Scholar]
- Joris et al. 2006.Joris PX, Ramirez CL, Mc Laughlin M, van der Heijden M. Spectral and temporal properties of the auditory nerve in Old-World monkeys. Assoc Res Otolaryngol Abstr 29: 302–303, 2006. [Google Scholar]
- Kiang et al. 1976.Kiang NY, Liberman MC, Levine RA. Auditory-nerve activity in cats exposed to ototoxic drugs and high-intensity sounds. Ann Otol Rhinol Laryngol 85: 752–768, 1976. [DOI] [PubMed] [Google Scholar]
- Kiang and Moxon 1974.Kiang NY, Moxon EC. Tails of tuning curves of auditory-nerve fibers. J Acoust Soc Am 55: 620–630, 1974. [DOI] [PubMed] [Google Scholar]
- Kiang 1984.Kiang NYS Peripheral neural processing of auditory information. In: Handbook of Physiology. The Nervous System. Sensory Processes. Bethesda, MD: Am. Physiol. Soc., 1984, sect. 1, vol. III, pt. 2, p. 639–674.
- Kiang et al. 1970.Kiang NYS, Moxon EC, Levine RA. Auditory-nerve activity in cats with normal and abnormal cochleas. In: Sensorineural Hearing Loss, edited by Wolstenholme GEW, Knight J. London: Churchill, 1970, p. 241–268. [DOI] [PubMed]
- Liberman 1978.Liberman MC Auditory-nerve response from cats raised in a low-noise chamber. J Acoust Soc Am 63: 442–455, 1978. [DOI] [PubMed] [Google Scholar]
- Müller et al. 2008.Müller M, Hoidis S, Smolders J. A physiological frequency-position map for the chinchilla cochlea. Assoc Res Otolaryngol Abstr 31: 73–74, 2008. [DOI] [PubMed] [Google Scholar]
- Narayan et al. 1998.Narayan SS, Temchin AN, Recio A, Ruggero MA. Frequency tuning of basilar membrane and auditory nerve fibers in the same cochleae. Science 282: 1882–1884, 1998. [DOI] [PMC free article] [PubMed] [Google Scholar]
- Nomoto 1980.Nomoto M Representation of cochlear innervation patterns in single auditory-nerve fiber responses. Jpn J Physiol 30: 31–40, 1980. [DOI] [PubMed] [Google Scholar]
- Ohlemiller and Echteler 1990.Ohlemiller KK, Echteler SM. Functional correlates of characteristic frequency in single cochlear nerve fibers of the Mongolian gerbil. J Comp Physiol A Sens Neural Behav Physiol 167: 329–338, 1990. [DOI] [PubMed] [Google Scholar]
- Ohlemiller and Siegel 1994.Ohlemiller KK, Siegel JH. Cochlear basal and apical differences reflected in the effects of cooling on responses of single auditory nerve fibers. Hear Res 80: 174–190, 1994. [DOI] [PubMed] [Google Scholar]
- Recio-Spinoso et al. 2005.Recio-Spinoso A, Temchin AN, van DP, Fan Y-H, Ruggero MA. Wiener-kernel analysis of responses to noise of chinchilla auditory-nerve fibers. J Neurophysiol 93: 3615–3634, 2005. [DOI] [PubMed] [Google Scholar]
- Rhode 1971.Rhode WS Observations of the vibration of the basilar membrane in squirrel monkeys using the Mössbauer technique. J Acoust Soc Am 49: 1218–1231, 1971. [DOI] [PubMed] [Google Scholar]
- Rhode 2007a.Rhode WS Basilar membrane mechanics in the 6–9 kHz region of sensitive chinchilla cochleae. J Acoust Soc Am 121: 2792–2804, 2007a. [DOI] [PubMed] [Google Scholar]
- Rhode 2007b.Rhode WS Mutual suppression in the 6 kHz region of sensitive chinchilla cochleae. J Acoust Soc Am 121: 2805–2818, 2007b. [DOI] [PubMed] [Google Scholar]
- Rhode and Cooper 1996.Rhode WS, Cooper NP. Nonlinear mechanics in the apical turn of the chinchilla cochlea in vivo. Audit Neurosci 3: 101–121, 1996. [Google Scholar]
- Rhode and Cooper 1997.Rhode WS, Cooper NP. Nonlinear mechanisms in the apical turn of the chinchilla cochlea. In: Diversity in Auditory Mechanics, edited by Lewis ER, Long GR, Lyon RF, Narins PM, Steele CR, Hecht-Poinar E. Singapore: World Scientific, 1997, p. 318–324.
- Rhode and Recio 2000.Rhode WS, Recio A. Study of mechanical motions in the basal region of the chinchilla cochlea. J Acoust Soc Am 107: 3317–3332, 2000. [DOI] [PubMed] [Google Scholar]
- Robertson and Johnstone 1979.Robertson D, Johnstone BM. Aberrant tonotopic organization in the inner ear damaged by kanamycin. J Acoust Soc Am 66: 466–469, 1979. [DOI] [PubMed] [Google Scholar]
- Robles and Ruggero 2001.Robles L, Ruggero MA. Mechanics of the mammalian cochlea. Physiol Rev 81: 1305–1352, 2001. [DOI] [PMC free article] [PubMed] [Google Scholar]
- Robles et al. 1986.Robles L, Ruggero MA, Rich NC. Basilar membrane mechanics at the base of the chinchilla cochlea. I. Input–output functions, tuning curves, and response phases. J Acoust Soc Am 80: 1364–1374, 1986. [DOI] [PubMed] [Google Scholar]
- Ruggero 1992.Ruggero MA Physiology and coding of sound in the auditory nerve. In: The Mammalian Auditory Pathway: Neurophysiology, edited by Popper AN, Fay RR. New York: Springer Verlag, 1992, p. 34–93.
- Ruggero et al. 2000.Ruggero MA, Narayan SS, Temchin AN, Recio A. Mechanical bases of frequency tuning and neural excitation at the base of the cochlea: comparison of basilar-membrane vibrations and auditory-nerve-fiber responses in chinchilla. Proc Natl Acad Sci USA 97: 11744–11750, 2000. [DOI] [PMC free article] [PubMed] [Google Scholar]
- Ruggero and Rich 1983.Ruggero MA, Rich NC. Chinchilla auditory-nerve responses to low-frequency tones. J Acoust Soc Am 73: 2096–2108, 1983. [DOI] [PubMed] [Google Scholar]
- Ruggero and Rich 1987.Ruggero MA, Rich NC. Timing of spike initiation in cochlear afferents: dependence on site of innervation. J Neurophysiol 58: 379–403, 1987. [DOI] [PubMed] [Google Scholar]
- Ruggero and Rich 1991.Ruggero MA, Rich NC. Furosemide alters organ of Corti mechanics: evidence for feedback of outer hair cells upon the basilar membrane. J Neurosci 11: 1057–1067, 1991. [DOI] [PMC free article] [PubMed] [Google Scholar]
- Ruggero et al. 1997.Ruggero MA, Rich NC, Recio A, Narayan SS, Robles L. Basilar-membrane responses to tones at the base of the chinchilla cochlea. J Acoust Soc Am 101: 2151–2163, 1997. [DOI] [PMC free article] [PubMed] [Google Scholar]
- Ruggero et al. 1990.Ruggero MA, Rich NC, Robles L, Shivapuja BG. Middle-ear response in the chinchilla and its relationship to mechanics at the base of the cochlea. J Acoust Soc Am 87: 1612–1629, 1990. [DOI] [PMC free article] [PubMed] [Google Scholar]
- Ruggero et al. 1996.Ruggero MA, Rich NC, Shivapuja BG, Temchin AN. Auditory-nerve responses to low-frequency tones: intensity dependence. Audit Neurosci 2: 159–185, 1996. [Google Scholar]
- Ruggero and Temchin 2005.Ruggero MA, Temchin AN. Unexceptional sharpness of frequency tuning in the human cochlea. Proc Natl Acad Sci USA 102: 18614–18619, 2005. [DOI] [PMC free article] [PubMed] [Google Scholar]
- Salvi et al. 1982.Salvi R, Perry J, Hamernik RP, Henderson D. Relationships between cochlear pathologies and auditory nerve and behavioral responses following acoustical trauma. In: New Perspectives on Noise-Induced Hearing Loss, edited by Hamernik RP, Henderson D, Salvi R. New York: Raven Press, 1982, p. 165–188.
- Schmiedt 1989.Schmiedt RA Spontaneous rates, thresholds and tuning of auditory-nerve fibers in the gerbil: comparisons to cat data. Hear Res 42: 23–35, 1989. [DOI] [PubMed] [Google Scholar]
- Sellick et al. 1982.Sellick PM, Patuzzi R, Johnstone BM. Measurement of basilar membrane motion in the guinea pig using the Mössbauer technique. J Acoust Soc Am 72: 131–141, 1982. [DOI] [PubMed] [Google Scholar]
- Sewell 1984.Sewell WF The effects of furosemide on the endocochlear potential and auditory-nerve fiber tuning curves in cats. Hear Res 14: 305–314, 1984. [DOI] [PubMed] [Google Scholar]
- Shera et al. 2002.Shera CA, Guinan JJ, Oxenham AJ. Revised estimates of human cochlear tuning from otoacoustic and behavioral measurements. Proc Natl Acad Sci USA 99: 3318–3323, 2002. [DOI] [PMC free article] [PubMed] [Google Scholar]
- Taberner and Liberman 2005.Taberner AM, Liberman MC. Response properties of single auditory nerve fibers in the mouse. J Neurophysiol 93: 557–569, 2005. [DOI] [PubMed] [Google Scholar]
- Temchin et al. 1997a.Temchin AN, Rich NC, Ruggero MA. Frequency-threshold curves of chinchilla auditory-nerve fibers. Assoc Res Otolaryngol Abstr 20: 152, 1997a. [Google Scholar]
- Temchin et al. 1997b.Temchin AN, Rich NC, Ruggero MA. Low-frequency suppression of auditory nerve responses to characteristic frequency tones. Hear Res 113: 29–56, 1997b. [DOI] [PMC free article] [PubMed] [Google Scholar]
- Temchin et al. 2008.Temchin AN, Rich NC, Ruggero MA. Threshold tuning curves of chinchilla auditory-nerve fibers. II. Dependence on spontaneous activity and relation to cochlear nonlinearity. J Neurophysiol doi: 10.1152/jn.90639.2008. [DOI] [PMC free article] [PubMed]
- Wang et al. 1997.Wang J, Powers NL, Hofstetter P, Trautwein P, Ding D, Salvi R. Effects of selective inner hair cell loss on auditory nerve fiber threshold, tuning and spontaneous and driven discharge rate. Hear Res 107: 67–82, 1997. [DOI] [PubMed] [Google Scholar]
- Wilson 1992.Wilson JP Cochlear mechanics. In: Auditory Physiology and Perception, edited by Cazals Y, Demany L, Horner K. Oxford, UK: Pergamon Press, 1992, p. 71–84.
- Zweig 1976.Zweig G Basilar membrane motion. Cold Spring Harb Symp Quant Biol 40: 619–633, 1976. [DOI] [PubMed] [Google Scholar]


