Abstract
Development of public health informatics applications often requires the integration of multiple data sources. This process can be challenging due to issues such as different file formats, schemas, naming systems, and having to scrape the content of web pages. A potential solution to these system development challenges is the use of Web 2.0 technologies. In general, Web 2.0 technologies are new internet services that encourage and value information sharing and collaboration among individuals. In this case report, we describe the development and use of Web 2.0 technologies including Yahoo! Pipes within a public health application that integrates animal, human, and temperature data to assess the risk of West Nile Virus (WNV) outbreaks.
The results of development and testing suggest that while Web 2.0 applications are reasonable environments for rapid prototyping, they are not mature enough for large-scale public health data applications. The application, in fact a “systems of systems,” often failed due to varied timeouts for application response across web sites and services, internal caching errors, and software added to web sites by administrators to manage the load on their servers. In spite of these concerns, the results of this study demonstrate the potential value of grid computing and Web 2.0 approaches in public health informatics.
Introduction
Public health data systems often require the integration of data from multiple sources including human and animal disease incidence, temperature, and socioeconomic data. This process can be challenging due to issues such as different file formats, schemas, and naming systems. For example, Zou et al. 1 combined temperature data from environmental sensors with West Nile Virus (WNV) surveillance systems monitoring infections in humans, birds, and mosquitoes to predict high risk WNV areas. Application development to support public health surveillance tasks often requires extensive programming and database work. A potential solution to these system development challenges is the use of Web 2.0 technologies. In general, Web 2.0 technologies are new internet services that encourage and value information sharing and collaboration among individuals. 2 Popular tools including Wikipedia 3 and Flickr 4 support user collaboration and content management while using technologies including Asynchronous JavaScript and XML (AJAX) and mini plug-in programs to provide dynamic content. 5,6 Other Web 2.0 applications further the use of the “Web as a platform” 6 and can facilitate data sharing and application development. For example, Yahoo! Pipes 7 is a tool that allows developers to rapidly ‘mashup’ or integrate content and functionality from different web sites into a single, hybrid application. 8 Another Web 2.0 tool is Dapper, 9 a web content “scraper” that enables users to extract (or scrape) information from one web page and integrate it into another. Finally, geographic information systems services, such as Google Earth, 10 facilitate integration of geospatial data in web-based applications.
The purpose of this paper is to assess the feasibility of using Web 2.0 technologies to develop complex public health applications. To assess this, we attempted to re-implement the work of Zou et al. 1 for predicting high risk WNV areas using a Web 2.0 approach and degree-day temperature calculations based on the single sine method. 11 Briefly, WNV is a mosquito-borne flavavirus that was originally discovered in the United States after an outbreak in New York City in 1999. 12–14 The infection can cause illness and death in humans and animals, including crows and horses. Transmission of the virus increases during the summer months since mosquito activity peaks in warmer weather. 14 Many different types of data streams are used for surveillance of West Nile Virus including human case reports, mosquito testing, dead bird sightings, dead bird or other wildlife testing, land use data, and temperature data. In this case report, we use Yahoo! Pipes, Dapper, GeoCommons, 11 and Google Earth to create a grid-like application for predicting West Nile Virus (WNV) risk in humans.
Methods
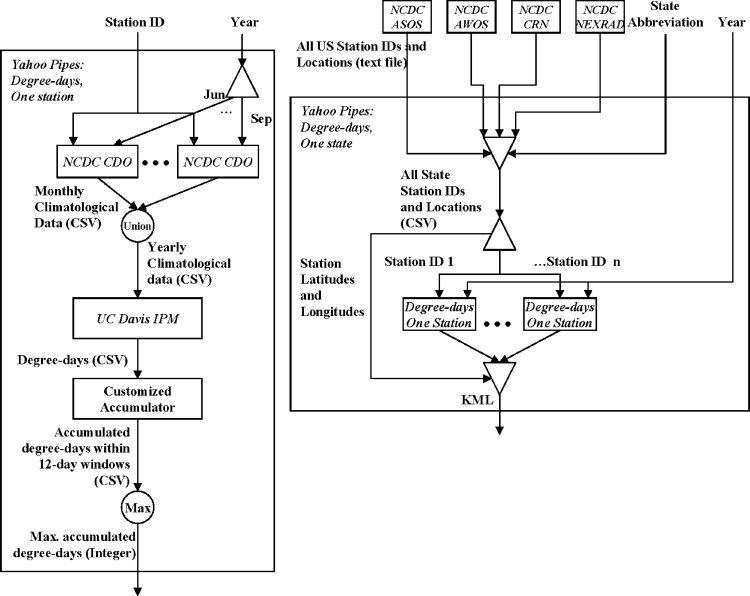
We used publicly available data from three websites and integrated that data using two different web services to create the application. Human and animal WNV data were taken from the CDC ArboNet website. 15 The ArboNet website provides the number of WNV cases in five types of organisms at the county level, as well as statewide accumulated totals. We focused on bird and human cases aggregated at the statewide level and built a ‘Dapp’ (an instance of a screen scrape using Dapper) to locate the total number of WNV cases on the USGS site. Then, using a list of state abbreviations as well as latitudes and longitudes from GeoCommons, we built a Yahoo! Pipe to loop over the states, extract the accumulated totals, and combine them with the geographical locations to produce an output file in Keyhole Markup Language (KML), a common graphical data format used by applications including Google Earth. Temperature data were taken from the National Climate Data Center (NCDC). 16 The NCDC provides monthly climatic data from each weather station; the stations are broken down into four lists on the NCDC web site. We built a Yahoo! Pipe to aggregate the station IDs and locations into a single list. Then, we extracted a sub-list of stations by state and downloaded the climate data from each station for a particular year (▶). Calculation of transmission risk was refined based on degree-day calculations. The degree-day is a measurement of heating or cooling in a given area and is calculated as the difference between the mean daily temperature and a pre-defined baseline temperature. 17,18 For vector-borne diseases like WNV, it is used to determine the temperature threshold for which viral transmission can occur. Degree-day calculations were performed by a web service published by the UC Davis Statewide Integrated Pest Management Program (IPM). 19 A customized accumulator was built to process the IPM output file and to perform a sliding-window accumulation to account for the limited infection period of a mosquito. Then, the maximum of the accumulated degree-days was computed by Yahoo! Pipes and compared to the threshold required for median viral transmission in order to predict WNV risk at the station for that year. These predictions were then combined with the geographical information to produce a KML file for all the stations in a particular state. We chose two states, Delaware and New Jersey, to use in our case report; any state with potential for WNV transmission could have been included.
Figure 1.
Schematic diagram illustrating how the developers combined different web-based data and analytical services to produce the application.
For visualization, each state has a separate KML file which can then be overlaid into Google Earth. This allows public health researchers to visualize the predictions from the temperature data alongside the actual number of human and animal cases. We repeated this procedure for years 2006 and 2007.
During development, we had to write computer programming code to address performance issues with the Web 2.0 applications. First, we built a server-side cache to store the content from the different data sources in order to avoid overloading the servers. This process is similar to the caching systems of web browsers, which store web content on the local disk and serve users with these cached copies instead of repeatedly fetching from the Web. With multiple users potentially running our pipeline and accessing the same web pages, it is more effective to have a second-level caching at the server side. Yahoo! Pipes does have its own internal caching system, but since we had no control of its properties, including expiration time and maximum size, we also implemented a cache at our local server. In addition, we wrote three small programs to connect different components of the pipeline. The first program extracted the properties of each weather station (ID, name, latitude and longitude) from the text files provided by the NCDC site. These files use fixed column lengths to separate different data fields instead of the more common use of delimiters. Since this file format is not currently supported by Yahoo! Pipes, we had to write our own parsers. The second program was used to submit temperature data to the IPM site for calculating degree-days. The IPM site provides two methods for data input: a text form for entering data on screen and the ability to submit a data file through the HTTP Post method. We were unable to use the first method as there were not enough input boxes for entering a whole month of data. Meanwhile, the data retrieval modules of Yahoo! Pipes only support the HTTP Get method, not Post. We therefore wrote our own connector for posting the data file prepared by Yahoo! Pipes to the IPM site. The third program processed the degree-days output of the IPM site and sent it back to Yahoo! Pipes. It used a sliding window to calculate the accumulated degree-days within each window.
Results
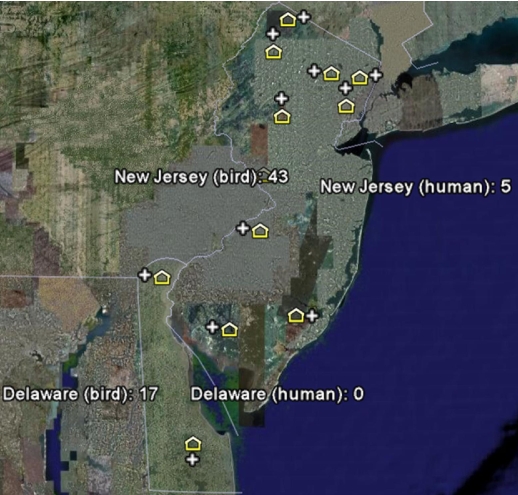
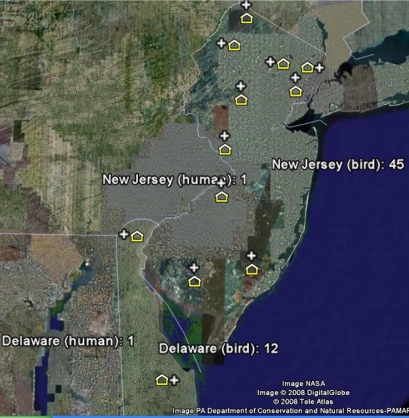
The application was developed in one and a half months. In addition to application development, this time included research to find available Web 2.0 resources as well as project design. The KML maps are displayed in Google Earth for 2006 and 2007 (▶); ▶ they show the total number of human and bird cases and a label for each weather station. Next to each weather station is a ‘+’ or ‘−’, indicating whether the degree-day was above or below the assigned threshold. For 2006 and 2007, both states have every weather station above the threshold (all have a ‘+'), which suggests that the weather in each state supports viral transmission. However, in New Jersey, the number of human cases decreases from 2006 to 2007 while the number of bird cases remains relatively the same. In Delaware, the number of bird cases decreases slightly.
Figure 2.
WNV and temperature data for Delaware and New Jersey in 2006. (Modified from Google Earth).
Figure 3.
WNV and temperature data for Delaware and New Jersey in 2007. (Modified from Google Earth).
Discussion
Web 2.0 is a second generation of Web-based data and analytical services that have revolutionized the way people communicate and develop applications. We used a Web 2.0 approach to develop a re-implementation of a tool used by Zou et al. 1 to predict high risk WNV areas using degree-day temperature calculations. In their example, the authors use Visual Basic .NET and ArcObject to develop their application. 1 We hypothesized that the use of grid-like applications and Web 2.0 technologies would facilitate the integration of public health data from diverse sources. However, in our example this process was far from straightforward. Yahoo! Pipes was not able to handle fetches of large amounts of data due to timeout, internal caching, and synchronization errors.
Some websites seemed to have been designed to confound mashup approaches. For example, the NCDC site limited our daily download of web pages to 100 pages, but it is unclear if there is an actual daily access limit. When 100 pages were exceeded, the site returned an error page. Likewise, for the USGS site, when too many requests were issued using Dapper within a short period of time, the web server returned blank fields where WNV case count were supposed to appear. Further output pages in this situation were indistinguishable from the situation where no WNV cases were reported. Other problems included a lack of support for basic data management functions (aggregation, table joins, etc.) and limited support for conversion of data between various output forms.
Conclusions
The purpose of this case report was to examine the feasibility of implementing Web 2.0 mashup techniques to develop public health applications. We conclude that while this approach is feasible, the development effort was not significantly reduced from more conventional software engineering approaches. This was in part due to the lack of maturity of present mashup tools and in part due to design aspects of two of the web sites that inhibited their use as impromptu web services. The design does illustrate the usefulness of grid-like computing approaches and Web 2.0 in public health and the value of web-based integration of data and analytical services.
Footnotes
This project is supported in part by The National Library of Medicine (NLM) Training Grant TI5 LM007056 to Matthew Scotch and National Institute of Neurological Disorders and Strokes (NINDS) grant U24 NS051869 to Kei Cheung.
References
- 1.Zou L, Miller SN, Schmidtmann ET. A GIS tool to estimate West Nile virus risk based on a degree-day model Environ Monit Assess 2007;129(1–3):413-420. [DOI] [PubMed] [Google Scholar]
- 2.Web 2.0. 2008http://en.wikipedia.org/wiki/Web_2 2007. Accessed September 18, 2008.
- 3.Wikipediawww.Wikipedia.com 2007. Accessed September 18, 2008.
- 4.Flickrwww.flickr.com/ 2007. Accessed September 18, 2008.
- 5.Cheung KH, Yip KY, Townsend JP, Scotch M. HCLS 2.0/3.0: Health care and life sciences data mashup using Web 2.0/3.0 J Biomed Inform 2008;41(5):694-705. [DOI] [PMC free article] [PubMed] [Google Scholar]
- 6.O'Reilly T. What is Web 2.0: Design Patterns and Business Models for the Next Generation of Softwarehttp://www.oreillynet.com/pub/a/oreilly/tim/news/2005/09/30/what-is-web-20.html? 2008. Accessed September 18, 2008.
- 7.Yahoo! Pipeshttp://pipes.yahoo.com/pipes/ 2008. Accessed September 18, 2008.
- 8.Murugesan S. Understanding Web 2.0 IT Professional 2007;9(4):34-41. [Google Scholar]
- 9.Dapperhttp://www.dapper.net/ 2007. Accessed September 18, 2008.
- 10.Google Earthhttp://earth.google.com/ 2007. Accessed September 18, 2008.
- 11.Allen J. A modified sine wave method for calculating degree days Environ Entomol 1976;5:388-396. [Google Scholar]
- 12.Reisen W, Brault AC. West Nile virus in North America: perspectives on epidemiology and intervention Pest Manag Sci 2007;63(7):641-646. [DOI] [PubMed] [Google Scholar]
- 13.O'Leary DR, Marfin AA, Montgomery SP, et al. The epidemic of West Nile virus in the United States, 2002 Vector Borne Zoonotic Dis 2004;4(1):61-70. [DOI] [PubMed] [Google Scholar]
- 14.Kraushaar G, Patel R, Stoneham GW. West Nile Virus: a case report with flaccid paralysis and cervical spinal cord: MR imaging findings AJNR Am J Neuroradiol 2005;26(1):26-29. [PMC free article] [PubMed] [Google Scholar]
- 15.USGS, CDC ArboNethttp://diseasemaps.usgs.gov/ 2005. Accessed September 18, 2008.
- 16.NOAA, National Climate Data Centerhttp://www.ncdc.noaa.gov/oa/ncdc.html 2005. Accessed September 18, 2008.
- 17.Province of British Columbia Terminal Weevils Guidebook Table of Contentshttp://www.for.gov.bc.ca/tasb/legsregs/fpc/fpcguide/weevil/glossary.htm 2005. Accessed September 18, 2008.
- 18.EPA Terms of Environment: Glossary, Abbreviations and Acronymshttp://www.epa.gov/OCEPAterms/dterms.html 2005. Accessed September 18, 2008.
- 19.UC-Davis Statewide Integrated Pest Management Programhttp://www.ipm.ucdavis.edu/ 2005. Accessed September 18, 2008.


