

Abstract
Resonance Raman studies have uncovered puzzling complexities in the structures of NO adducts of heme proteins. Although CO adducts of heme proteins obey well-behaved anti-correlations between Fe-C and C-O stretching frequencies, which reflect changes in backbonding induced by distal H-bonding residues, the corresponding NO data are scattered. This scatter can be traced to distal influences, since protein-free NO-hemes do show well-behaved anti-correlations. Why do distal effects produce irregularities in νFeN/νNO plots but not in νFeC/νCO plots? We show via Density Functional Theory (DFT) computations on model systems that the response to distal H-bonding differs markedly when the NO acceptor atom is N vs O. Backbonding is augmented by H-bonding to O, but the effect of H-bonding to N is to weaken both N-O and N-Fe bonds. The resulting downward deviation from the νFeN/νNO backbonding line increases with increasing H-bond strength. This effect explains the deviations observed for a series of myoglobin variants, in which the strength of distal H-bonding is modulated by distal pocket residue substitutions. Most of the data follow a positive νFeN/νNO correlation with the same slope as that calculated for H-bonding to N. Such deviations are not observed for CO adducts, because the CO π* orbital is unoccupied, and serves as a delocalized acceptor of H-bonds. H-bonding to N primes NO-heme for reduction to the HNO adduct, a putative intermediate in NO-reducing enzymes.
Keywords: Heme, Nitric Oxide, H-bonding, Backbonding, DFT
Introduction
There is continuing interest in the nature of heme adducts of the molecules CO, NO and O2, which are central to numerous biological signaling and energy transduction processes. Interactions of these adducts with surrounding protein residues are critical determinants of ligand discrimination, and of reactivity subsequent to binding. Vibrational spectroscopy is a useful probe of these interactions, because they influence the Fe-X and X-O vibrations, thanks to the delocalized electronic structure of the heme-XO adducts.
These vibrations are used widely to characterize CO adducts, which show a characteristic and well-behaved pattern of backbonding anti-correlations [1]. Influences that increase Fe → CO backbonding, such as distal H-bond donors, increase νFeC while decreasing νCO. The trans (proximal) ligand also affects the pattern via σ competition with the Fe-C bond. However, if the trans ligand donor strength is constant, then all the data fall on a single νFeC/νCO anti-correlation.
The situation is more complex for Fe(II)NO adducts of heme proteins.1 The νFeN/νNO data show considerable scatter, leading to an initial suggestion that variations in backbonding may not be consequential, as they are for CO adducts [2]. However, we were able to demonstrate that well-behaved anti-correlations are observed for protein-free NO adducts, and that it is possible to relate at least some of the protein-induced deviations from these backbonding lines to the strength of distal H-bond donors in the proteins [3]. Thus, the same H-bonding residues induce shifts along the νFeC/νCO backbonding lines, but away from the νFeN/νNO backbonding lines.
How can this difference be understood? Our initial hypothesis was that the responsible distal residues induced Fe-X-O angle changes for NO adducts but not CO adducts. Trial Density Functional Theory (DFT) calculations with constrained Fe-N-O angles produced changes which were consistent with this view [3, 4]. However, more extensive DFT modeling suggested an explanation that is more plausible physically, namely that deviations from the νFeN/νNO backbonding line reflect H-bonding specifically to the N atom of the bound NO. Because of the bent FeNO structure, a properly oriented H-bond can draw electron density into a non-bonding orbital on N, thereby weakening both the Fe-N and N-O bonds.
In the present work, we present the DFT modeling results that support this proposal. H-bond donors directed toward the O atom of NO-heme produce an anti-correlation of νFeN and νNO, consistent with enhanced backbonding. However, H-bond donors directed toward the N atom reduce both νFeN and νNO, producing a positive correlation. Re-examination of the data on NO adducts of myoglobin (Mb) reveal the same positive correlation, consistent with crystal structures that show the N atom to be the acceptor of an H-bond from the distal histidine. This H-bond may account for the facile formation of a surprisingly stable HNO adduct Mb(HNO) from MbNO [5-7]. Implications are considered for enzymatic mechanisms of NO reduction.
Methods
Computations were performed with the Gaussian 03 program [8], using the standard 6-31G* basis set for all the atoms except Fe, for which Ahlrichs' valence triple-ζ (VTZ) [9] basis set was employed. The non-hybrid DFT functional, BLYP was employed, with an ultrafine integration grid, because in previous work we found that hybrid DFT functionals, such as B3LYP, give inferior results with NO-heme [3]. This doublet adduct has low-lying high-spin excited states, which are overemphasized by the hybrid functionals.
The structures were optimized with minimal constraints, as described below. Vibrational frequencies were then calculated.
Results
The NO-heme model was (ImH)FeP(NO) (ImH = imidazole, P = porphine), as in previous DFT studies [3, 10-12]. Inasmuch as ligand orientation has been shown not to affect the energy significantly in this system [13], the imidazole and NO ligands, were kept in the same plane, which bisected the Fe-N(pyrrole) bonds (Cs symmetry - Figure 1). A series of H-bond donors were placed in the same plane, near the N or O atoms of the bound NO, and the geometry was allowed to optimize (Figure 1). In order of increasing donor strength (in the gas phase), the donors were CH4, NH3, H2O, ImH, HCl, HF and NH4+. In the case of ImH, the imidazole ring was allowed to rotate out of the FeNO plane, to avoid steric contacts. Geometric parameters of the computed structures are listed in Table 1, as are computed frequencies of the principal FeNO vibrational modes. As discussed elsewhere [3], the mode compositions are complex, with considerable coordinate mixing. Nevertheless, the listed frequencies arise from modes with major contributions from Fe-N and N-O stretching, and are readily identifiable via their isotope shifts [3].
Figure 1.

Optimized geometry for HCl H-bonded to N (left) or to O (right) of (ImH)FeP(NO)
Table 1.
Computed structural parameters and vibrational frequencies for (ImH)FeP(NO) and its complexes with selected H-bonding partners
| FeNO Geometry | FeNO Frequencies (cm-1) | H-bond Geometries: | ||||||
|---|---|---|---|---|---|---|---|---|
| Fe-N(Å) | N-O(Å) | <FeNO(°) | νFe-N | νN-O | ||||
| (ImH)FeP(NO): | 1.749 | 1.199 | 139.3 | 602 | 1669 | -- | -- | -- |
| H ⋯ O | dO--H(Å) | <O--H-X(°) | <H--O-N(°) | |||||
| NH4+: | 1.723 | 1.224 | 143.5 | 628 | 1556 | 1.646 | 177.5 | 128.3 |
| HF : | 1.736 | 1.209 | 140.2 | 619 | 1620 | 1.879 | 170.6 | 135.8 |
| HCl : | 1.739 | 1.205 | 140.9 | 611 | 1636 | 2.077 | 163.9 | 146.0 |
| ImH : | 1.740 | 1.205 | 140.0 | 610 | 1642 | 2.156 | 151.6 | 148.3 |
| H2O : | 1.742 | 1.205 | 139.5 | 609 | 1635 | 2.213 | 157.1 | 138.3 |
| NH3 : | 1.746 | 1.202 | 139.3 | 605 | 1650 | 2.596 | 163.6 | 140.9 |
| CH4 : | 1.748 | 1.199 | 139.5 | 602 | 1665 | 2.856 | 158.3 | 153.7 |
| H ⋯ N | dN--H(Å) | <N--H-X(°) | <H--N-O(°) | |||||
| NH4+: | 1.769 | 1.213 | 136.3 | 587 | 1602 | 1.701 | 178.2 | 114.4 |
| HF : | 1.756 | 1.204 | 137.4 | Mixed Modeb | 1642 | 1.904 | 178.5 | 114.2 |
| HCl : | 1.756 | 1.203 | 137.3 | 597 | 1645 | 2.093 | 165.3 | 104.3 |
| ImH : | 1.751 | 1.203 | 138.4 | 597 | 1646 | 2.289 | 163.6 | 104.3 |
| H2O : | 1.752 | 1.201 | 138.3 | 596 | 1650 | 2.386 | 155.7 | 98.9 |
| NH3 : | 1.745 | 1.201 | 139.7 | 605 | 1654 | 2.827 | 115.1 | 77.6 |
| CH4 : | -- | -- | -- | -- | -- | -- | -- | -- |
| NH3 - 180°a | 1.748 | 1.201 | 138.9 | 600 | 1655 | 2.764 | 180.0 | 104.0 |
. ∠N⋯H-X is fixed at 180° to achieve a stronger H-bonding interaction
. Mixing of H motion elevated the mainly νFe-N mode.
Stable structures were found in all cases, with no negative vibrational frequencies, except for CH4 in the neighborhood of the N atom of NO. In this case, the H-bond was too weak to restrain CH4 from drifting toward the O atom. Also NH3 was attracted toward the O atom, leaving a long H-bond to N, with an unfavorable (1150) N⋯H-N angle. This preference for O can be understood from the computed partial charges (Table 3), which are more negative for O than for N. In order to include the NH3 data in the correlations described below, we constrained ∠N⋯H-N to 1800 (NH3-1800 entry in Table 1); the resulting H-bond to N was thereby shortened slightly. The remaining donors formed straightforward H-bonds with N, having reasonable angles and distances. All the donors formed stronger H-bonds with O; they were directed more or less along the N-O vector (Figure 1). As expected, the O⋯H and N⋯H distances decrease with increasing H-bond donor strength.
Table 3.
Mulliken charges on Fe, N and O atoms in (ImH)FeP(NO) H-bonded complexes
| Fe | N | O | |
|---|---|---|---|
| (ImH)FeP(NO) : | 1.028 | -0.005 | -0.195 |
| H⋯O | |||
| NH4+: | 1.059 | -0.005 | -0.297 |
| HF : | 1.043 | -0.003 | -0.248 |
| HCl : | 1.041 | 0.000 | -0.224 |
| ImH : | 1.039 | -0.001 | -0.228 |
| H2O : | 1.038 | -0.006 | -0.226 |
| NH3 : | 1.034 | -0.006 | -0.213 |
| CH4 : | 1.031 | -0.003 | -0.199 |
| H⋯N | |||
| NH4+: | 1.063 | -0.125 | -0.188 |
| HF : | 1.047 | -0.081 | -0.186 |
| HCl : | 1.049 | -0.047 | -0.182 |
| ImH : | 1.041 | -0.047 | -0.192 |
| H2O : | 1.033 | -0.033 | -0.191 |
When the FeNO geometry is examined, systematic trends are also apparent (Table 1). The Fe-N-O angle, which is 139.30 for (ImH)FeP(NO) becomes larger for H⋯O but smaller for H⋯N interactions. However, the effects are small, smaller than 40. The N-O distance increases with increasing H-bond donor strength for both series, although more so for H⋯O than for H⋯N. The Fe-N distances, however, change in opposite directions, decreasing with H-bond strength for H⋯O but increasing for H⋯N. Likewise νNO decreases with increasing H⋯O as well as H⋯N H-bond strengths, but νFeN moves in opposite directions for the two cases. Figure 2 shows that the data fall on reasonably straight lines, for both distances and frequencies. For NH3, the unconstrained H⋯N complex (not shown) deviates from the pattern, but the 1800 angle constraint brings the data into line with the remaining complexes. (Another mode, at around 475 cm-1, with mixed Fe-N stretching and Fe-N-O bending character was found to vary in parallel with νFeN for H⋯O complexes, but was essentially invariant for H⋯N complexes. This mode is readily detected in NRVS spectra [14], but is very weak in resonance Raman or infrared spectra [3].)
Figure 2.

Correlations between computed Fe-N and N-O frequencies and bond distances for the listed donors H-bonded to N or O of (ImH)FeP(NO). νFeN for HF H-bonded to N (X, 2) was obtained via the Badger's rule correlation in Fig 3
For all 13 computed structures (7 O⋯H and 5 N⋯H plus no H-bond), there are excellent Badger's rule [15] correlations between bond distance and ν-2/3 (Figure 3)
Figure 3.
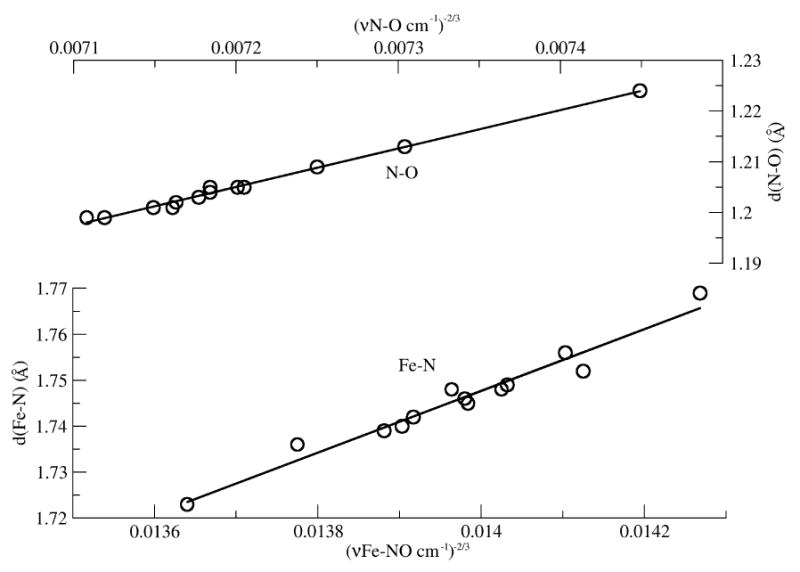
Computed bond length-frequency correlations for mainly N-O and Fe-N stretching modes according to Badger's rule:
| (1) |
The coefficients CFe-N and dFe-N, 67 and 0.81, are not far from recently determined values of 56 for CFe-O and 1.0 for dFe-O in heme and non-heme iron-oxygen complexes [16]. Even though the vibrational modes have contributions from coordinates other than N-O and Fe-N stretching, the νFeN/νNO plots are linear over the entire computed range, because the mode compositions (not shown) do not change significantly as a result of H-bonding. An exception is the N⋯HF complex, for which the computed mode with the largest Fe-N stretching contribution was found to also display significant H-atom motion, and a frequency which deviated from the pattern. (A similar effect accounts for the higher than expected νFeN for the HNO adduct of Mb [17].) The point plotted in Figure 2 for this complex was therefore obtained via the Badger's rule correlations.
The positive νFeN/νNO correlation computed for H⋯N complexes, allows us to make sense of the available νFeN/νNO data for a series of Mb variants, that had previously indicated a lack of any correlation [2, 4]. Figure 4 shows that some of these variants do obey a positive linear correlation, with essentially the same slope as that calculated for H⋯N complexes (Table 2). In Mb, the distal histidine, H64, is a H-bond donor to heme bound ligands, and in the case of NO the H64 NH group is closer to the N than the H-atom (see Discussion). The point for wild-type Mb falls in the middle of the positive correlation, but when H64 is replaced by the nonpolar isoleucine (H64I), the point slides up the correlation almost to the backbonding line that was previously defined experimentally using (NMeIm)Fe(II)TPP-X(NO) (NMeIm = N-methylimidazole, TPP = tetraphenylporphine) adducts [3]. In these adducts, the electron density on Fe(II) was modulated with electron-donating or –withdrawing substituents, X, on the phenyl groups of tetraphenylporphine. We note that Figure 4 does not include all the available FeNO protein adduct data [2, 4], but only those from Mb pocket mutants. Other adducts show greater scatter, suggesting additional influences on νFeN and νNO; here we are concerned with identifying distal H-bonding as a variable.
Figure 4.

Left: νFeN/νNO plot for the indicated variants of Mb [4] (□) and for the H ⋯ O bonding proteins TtTar4H [19] and NiR [21] (○). The backbonding line marked TPP-X is for (N-MeIm)FeTPP-X(NO), with electron donating and withdrawing group, X, on the TPP phenyl substituents. The structural diagrams illustrate the distal H-bond arrangement for Mb and TtTar4H. Right: Computed correlations for (ImH)FeP(NO) with variable H-bonding to N or O, and for various electron donating and withdrawing substituents on the porphine ring (P-X)
Table 2.
νFeN/νNO parametersa for 6-Coordinate Fe(II) Porphyrin NO adducts
| ν° (Fe-N)(cm-1) | Slope | |
|---|---|---|
| Experimental | ||
| (N-MeIm)Fe(TPP-X)(NO) [3] | 329 | -1.0 |
| Mb variants b | 610 | 0.21 |
| DFT-calculated | ||
| (ImH)Fe(P-X)(NO) [3] | 523 | -0.37 |
| (ImH)FeP(NO) with H⋯O b | 553 | -0.24 |
| (ImH)FeP(NO) with H⋯N b | 649 | 0.23 |
. νFeN=ν°FeN+s[νNO-ν°NO], ν°NO = 1876 cm-1 (gas phase frequency)
. This work
When H64 is replaced in Mb by the weaker H-bond donor glutamine (H64Q), the point moves up the H⋯N correlation. On the other hand, replacement of L29, a residue that buttresses H64 (see Figure 4 inset), with the bulkier phenylalanine (L29F), moves the point down the H⋯N line, consistent with stronger H64 H-bonding as a result of the steric interaction with F29. F46 is also a buttressing residue, and its replacement with the smaller valine (F46V) allows H64 to swing away from the ligand [18]; the point moves to the upper end of the H⋯N correlation. V68 is a non-polar residue which is directly in sidewise contact with the bound NO (Figure 4), and its replacement with the H-bond donor asparagine (V68N) produces the lowest point on the line, indicating a strong H⋯N interaction. (The one deviant point in Figure 4 is V68F, probably reflecting a steric and/or electronic interaction of the bulky phenyl ring directly with the bound NO).
It was previously recognized that deviations from the TPP-X backbonding line increased in proportion to the strength of H-bonding to NO [3], but it can now be seen that this is exactly the behavior expected specifically for H⋯N interactions. Supporting this inference is the position in Figure 4 of the H-NOX protein TtTar4H [19], whose structure (for the O2 complex – see Figure 4 inset) shows a distal tyrosine ligand H-bonding with the outer O atom [20]. This point falls on the backbonding line, as expected. So does the point for NO-bound heme d1 of cd1 nitrite reductase [21], whose structure reveals a strong H-bond to the outer O atom from a distal histidine positioned directly over it [22]. (Nioche et al [23] reported EPR evidence for loss of proximal ligation when NO binds an H-NOX protein homologous to TtTar4H, but this result is at odds with DFT calculations [11]. Also, the vibrational data on TtTar4H-NO [19] are inconsistent with 5-coordination.)
The slope of the experimental TPP-X backbonding line is different (Table 2) from that calculated for the H⋯O complexes, or for the line calculated previously [3] for porphine adducts with electron-donating or –withdrawing substituents directly on the ring (P-X line – Figure 4). It is uncertain whether these are real differences, reflecting the different modes of backbonding variation (TPP-X, with the substituent on a phenyl group, vs P-X, with the substituent directly on the ring, or H⋯O interactions), or whether they reflect computational inadequacy. Such differences are not seen for corresponding experimental and computational backbonding lines in the case of homologous CO adducts [3]. However, NO adducts are more computationally demanding than are CO adducts, because of the extra valence electron. Whether or not the slope discrepancies are real, the consistency between the computed and experimental data patterns for NO-heme adducts are clear, and striking.
Discussion
H-bond ambidenticity and electronic structure
One-electron occupancy of the NO π* orbitals provides the opportunity for ambidentate H-bonding by distal groups in heme proteins. Interaction with the Fe orbitals induces Fe-N-O bending, allowing the extra electron density to accumulate on the side of the N atom away from the heme (partial sp2 hybridization) [24]. This local electron density can serve as a H-bond acceptor, as can electron density on the O atom, which accumulates thanks to backbonding. H-bond complexes optimize to reasonable geometries in silico (Figure 1), whether the N or the O atom serves as acceptor, a conclusion also reached by Tangen et al [11]. The NO ambidenticity is in contrast to the behavior of heme CO adducts, which lack a mechanism for concentrating electron density on C. DFT modeling by Franzen [25] produced an optimum C-O⋯H angle of approximately 1000, indicating that a delocalized π orbital serves as the acceptor.
The electrostatic ambidenticity of heme-bound NO is revealed by the computed Mulliken charge distribution (Table 3). In (ImH)FeP(NO), charge accumulates on O (-0.2) and increases with H⋯O H-bonding (up to -0.3 for NH4+ as donor), with little change in the N charge, which remains very small (about -0.005). However, H⋯N H-bonding increases the charge on N (up to -0.12 for NH4+), with a smaller reduction of the O charge. Meanwhile the positive charge on Fe (about +1.0) is nearly constant, and much of the H-bond polarization reflects charge flow from the trans ImH ligand (not shown). This polarization is available whether the H-bond is directed at O or N.
The consequences for Fe-N and N-O bond strength are quite different in the two cases, however. H-bonding to O pulls electrons into the FeNO π* orbitals, strengthening Fe-N while weakening N-O, via the usual backbonding effect. On the other hand, H-bonding to N withdraws bonding electrons, from both the Fe-N and the N-O bonds, into a (partial sp2) non-bonding orbital. These effects can be visualized with the aid of the valence isomer diagram [3] in Figure 5. If the odd electron on NO is transferred to Fe, the isomer is Fe(I)(NO+), with ∠FeNO = 1800 (sp hybridization on N). If instead the odd electron is paired with another electron drawn from Fe, the isomer is Fe(III)(NO-), with ∠FeNO = 1200 (sp2 hybridization). Between these two is Fe(II)NO, the dominant isomer, with ∠FeNO = 1500 (half way between sp and sp2), the odd electron remaining on N.
Figure 5.

Valence isomers of LFeP(NO). Not shown are the Fe → NO π backbonds, which counterbalance the formal charges
However, this schema leaves out of account the countervailing effects of backbonding on the electron distribution. The formal +1 NO charge in Fe(I)(NO+) is overridden by enhanced backbonding in the linear geometry, allowing negative charge to accumulate on O. This effect was previously demonstrated via DFT calculations with constrained FeNO angles [3]. Because of the excess charge on O, H⋯O H-bonding increases the FeNO angle (Table 1), reflecting an increased Fe(I)(NO+) contribution. Due to enhanced backbonding, the Fe-N bond is strengthened and the NO bond is weakened, despite the valence bond description in Figure 5.
Conversely, the formal -1 NO charge on Fe(III)(NO-) is counteracted by diminished backbonding in the FeNO plane, so that the charge on O is smaller than it is for Fe(II)NO (Table 2), again despite the formal charge. Consequently, H⋯O H-bonding is disfavored, while H⋯N H-bonding is favored by the increased electron density in the sp2 non-bonding orbital. Diminished backbonding weakens the Fe-N bond, while enhanced sp2 hybridization simultaneously weakens the N-O bond. This is the reason that νFeN and νNO correlate negatively for H⋯O H-bonding, but positively for H⋯N H-bonding.
H-bonding and the FeNO angle
We next consider the puzzling variability in reported FeNO angles for MbNO. Four different crystal structures have been reported, with a wide range of angles: 147 [26], 144 [27], 121 [27], and 112° [28], even though the arrangement of the distal residues is almost the same; the crystals differ only in their method of preparation (Fe(III)Mb crystals bathed in nitrite or Fe(II)Mb crystals exposed to NO). There is some uncertainty associated with these values, since the crystallographic resolution (1.7, 1.3, 1.3 and 1.9 Å, respectively) was moderate. However, this uncertainty is unlikely to explain the large variation, especially between the first and last pair of values.
We suggest that this variation is tied to the H-bond status of the distal His (H64) sidechain in Mb. It occupies nearly the same position, whether the exogenous ligand is CO, NO or O2 (Figure 6). Its imidazole NεH group points toward the side of the XO group, but with different H-bond preferences for X and O. Table 4 lists distances from Nε to X and to O. For CO there is a clear preference for O (0.4 Å shorter distance), although the H-bond is directed from the side, consistent with Franzen's DFT modeling [25] which predicted an optimum C-O⋯H angle of approximately 1000. However, for NO, there is a clear preference for N, with shorter distance to N in all the structures. Intriguingly this preference increases when the FeNO angle is decreased from 147 or 1440 (0.2-0.3 Å shorter distance) to 121 or 1120 (0.6 Å shorter distance). Thus a correlation between H⋯N H-bond strength and FeNO angle is evident in the crystal structures, and is exactly as expected from stabilization of the Fe(III)(NO-) valence isomer.
Figure 6.

Superposition of MbXO structures (X=C, N, O), showing the disposition of the distal histidine (Blue: MbCO, pdb #: 1BZR; Red: MbNO, pdb #: 2FRJ; Green: MbO2, pdb #: 1A6M)
Table 4.
Structure parameters for MbXO crystal structures
| Structure | ∠FeXO (°) | (His)N⋯·X (Å) | (His)N⋯·O (Å) | ref |
|---|---|---|---|---|
| MbCO(sw) a | 171 | 3.59 | 3.21 | [38] |
| MbNO(hh) b | 147 | 2.98 | 3.18 | [26] |
| MbNO(hh) c | 144 | 3.05 | 3.34 | [27] |
| MbNO(hh) d | 121 | 2.72 | 3.33 | [27] |
| MbNO(sw) e | 112 | 2.78 | 3.38 | [28] |
| MbO2(sw) f | 122 | 3.08 | 2.97 | [39] |
pdb codes:
, 1BZR (@ 1.15Å);
, 1NPF (@ 1.90Å);
. 2FRJ (@ 1.30Å);
. 2FRK (@ 1.30Å);
. 1HJT (@1.70Å);
. 1A6M (@ 1.0Å)
sw = sperm whale; hh = horse-heart
The source of enhanced H⋯N H-bond strength in the two structures with smaller ∠FeNO is uncertain. Perhaps it reflects different distributions of (unresolved) solvent molecules or of salt ions, stemming from the different crystallization conditions. In any event, the energy differences must be small, suggesting that the FeNO bending potential is soft.
To explore this issue, we calculated the energy increase, ΔE, from the optimized (ImH)FeP(NO) structure upon constraining ∠FeNO to 119.3°, 20° less than the optimized angle (Table 5). In the absence of distal H-bonding, ΔE = 6.1 kcal/mol, but when there is an H⋯N donor, ΔE decreases as the donor strength increases; it is 4.3 kcal/mol for NH4+. In addition, the optimized H-bond distance becomes shorter, just as is seen in the MbNO crystal structure. For NH4+ the computed H⋯N distance shortens from 1.70 to 1.61Å. Thus, the bending potential is indeed softened by H-bonding to the N atom of NO.
Table 5.
Computed (ImH)FeP(NO) energy increase and H-bond shortening when ∠FeNO is constrained to 119.3° for various H⋯N donors
| H⋯N donor | Optimum | Constrained (∠FeNO = 119.3°) | ||
|---|---|---|---|---|
| ∠FeNO (°) | d(H⋯N) (Å) | ΔE (kcal/mol) | d(H⋯N) (Å) | |
| none | 139.3 | 6.12 | ||
| HF | 137.4 | 1.09 | 5.12 | 1.85 |
| HCl | 137.3 | 2.09 | 5.07 | 1.97 |
| NH4+ | 136.3 | 1.70 | 4.27 | 1.61 |
Multiple scattering XAFS analysis [29] on a frozen solution of MbNO yielded ∠FeNO = 1500, but in liquid solution a range of values is possible. The present analysis of the νFeN/νNO data for MbNO variants, leaves little doubt that there is a moderately strong H⋯N interaction with the distal histidine in wild-type Mb. This interaction is weakened or strengthened when buttressing effects on the His sidechain by adjacent residues are loosened or augmented. The positive νFeN/νNO correlation found for these variants, which agrees well with the predicted dependence, provides calibration for the strength of H⋯N bonds in other NO adducts.
It is also interesting that for bound O2, the distance to Nε is almost the same for both O atoms (Table 4). O2 has one more electron than NO, and the two sp2 electrons on the Fe-bound O atom might have been expected to provide stronger H-bonding than the one sp2 electron on Fe-bound N. However electron transfer from Fe(II) is greater to O2 than to NO (the O2 adduct has many properties suggesting a Fe(III)O2- electron distribution) [30] so that build-up of charge on the outer O atom is also greater, increasing its H-bond potential.
H-bonding and HNO adducts
Finally we call attention to the likely relevance of H⋯N bonds to the formation of HNO adducts, a topic of considerable interest in biological redox processes involving NO [31-33]. For example HNO intermediates have been implicated in the enzymatic mechanisms of NO synthase [34] and of nitrite [35] and NO [36] reductases. Farmer and coworkers have reported facile formation of a surprisingly stable HNO adduct of Mb, by chemical or electrochemical reduction of NO [5, 6]. HNO itself is highly unstable, and protein-free metal complexes can only be studied at low temperatures. But Mb(HNO) is stable for months. Apparently its formation had previously been missed because its UV/VIS absorption spectrum differs only slightly from that of MbNO [5, 6].
EXAFS analysis [7] on Mb(HNO), as well as DFT modeling [17], indicate lengthened Fe-N and N-O bonds, 1.82 and 1.24 Å, compared to 1.76 and 1.12 Å in MbNO. Strong H⋯N H-bonding in MbNO produces a similar, though less pronounced effect (Table 1). Thus the formation of Mb(HNO) can be envisioned (Figure 7) as complete transfer of the distal His NεH proton to the heme-bound NO, following addition of an electron. The distal His would meanwhile take up another proton from the solvent, via the Nδ atom. NMR analysis indicates that a key to the stability of Mb(HNO) is that the distal His now donates a H-bond to the O atom [37]. This could occur by a 1800 rotation of the bound HNO around the Fe-N bond, and imidazole tautomerization from Nε-H to Nδ-H (Figure 7). Thus we propose that the distal His residue is intimately involved in the facile reduction of MbNO to Mb(HNO), by accommodating ambidenticity in the NO H-bonding. Similarly directed distal H-bonding may be operative in NO processing enzymes.
Figure 7.

Scheme for H-bond-assisted reduction of MbNO to Mb(HNO)
Conclusions
The present analysis establishes that heme-bound NO can stably accept H-bonds directed either at the O or N atom. H⋯O bonding enhances backbonding, and leads to anti-correlation of Fe-N and N-O bond lengths and stretching frequencies, just as in CO-heme adducts. However, H⋯N bonding produces positive correlation of Fe-N and N-O bond lengths and stretching frequencies, because it draws electron density into a non-bonding (sp2) orbital on N, weakening the Fe-N and N-O bonds simultaneously. This effect serves to account for the heretofore puzzling vibrational data on MbNO variants. In Mb, the distal histidine forms a stronger H⋯N than H⋯O bond.
H⋯N bonding is coupled to FeNO bending; the stronger the H-bond the smaller the FeNO angle. This coupling can explain the surprising range of FeNO angles reported in MbNO crystal structures.
H⋯N bonding is likely involved in the facile formation of Mb(HNO), which can occur by proton transfer from the distal His upon electron injection into the NO-heme, accompanied by His reprotonation from solution. His tautomerization and HNO rotation about the Fe-N bond would then produce the (His)H⋯ONH interaction that is believed to account for the surprising stability of this adduct. Similar mechanisms may come into play in enzymes involved in NO reduction.
Acknowledgments
This work was supported by NIH grant GM 33576 from the National Institute of General Medical Sciences.
Abbreviations
- DFT
Density Functional Theory
- EPR
Electron Paramagnetic Spectroscopy
- ImH
Imidazole
- Mb
Myoglobin
- NMeIm
N-methylimidazole
- NRVS
Nuclear Resonance Vibrational Spectroscopy
- P
Porphine
- RR
Resonance Raman
- TPP
Tetraphenylporphine
- XAFS
X-ray Absorption Fine-Structure
Footnotes
Refrences
- 1.Spiro TG, Wasbotten IH. J Inorg Biochem. 2005;99:34–44. doi: 10.1016/j.jinorgbio.2004.09.026. [DOI] [PubMed] [Google Scholar]
- 2.Park ES, Boxer SG. J Phys Chem B. 2002;106:5800–5806. [Google Scholar]
- 3.Ibrahim M, Xu CL, Spiro TG. J Am Chem Soc. 2006;128:16834–16845. doi: 10.1021/ja064859d. [DOI] [PMC free article] [PubMed] [Google Scholar]
- 4.Coyle CM, Vogel KM, Rush TS, Kozlowski PM, Williams R, Spiro TG, Dou Y, Ikeda-Saito M, Olson JS, Zgierski MZ. Biochemistry. 2003;42:4896–4903. doi: 10.1021/bi026395b. [DOI] [PubMed] [Google Scholar]
- 5.Lin R, Farmer PJ. J Am Chem Soc. 2000;122:2393–2394. [Google Scholar]
- 6.Sulc F, Immoos CE, Pervitsky D, Farmer PJ. J Am Chem Soc. 2004;126:1096–1101. doi: 10.1021/ja0376184. [DOI] [PubMed] [Google Scholar]
- 7.Immoos CE, Sulc F, Farmer PJ, Czarnecki K, Bocian DF, Levina A, Aitken JB, Armstrong RS, Lay PA. J Am Chem Soc. 2005;127:814–815. doi: 10.1021/ja0433727. [DOI] [PubMed] [Google Scholar]
- 8.Frisch MJ Gaussian 03
- 9.Bauernschmitt R, Ahlrichs R. Chem Phys Lett. 1996;256:454–464. [Google Scholar]
- 10.Praneeth VKK, Nather C, Peters G, Lehnert N. Inorg Chem. 2006;45:2795–2811. doi: 10.1021/ic050865j. [DOI] [PubMed] [Google Scholar]
- 11.Tangen E, Svadberg A, Ghosh A. Inorg Chem. 2005;44:7802–7805. doi: 10.1021/ic050486q. [DOI] [PubMed] [Google Scholar]
- 12.Zhang Y, Gossman W, Oldfield E. J Am Chem Soc. 2003;125:16387–16396. doi: 10.1021/ja030340v. [DOI] [PubMed] [Google Scholar]
- 13.Patchkovskii S, Ziegler T. J Am Chem Soc. 2000;122:3506–3516. [Google Scholar]
- 14.Zeng WQ, Silvernail NJ, Wharton DC, Georgiev GY, Leu BM, Scheidt WR, Zhao JY, Sturhahn W, Alp EE, Sage JT. J Am Chem Soc. 2005;127:11200–11201. doi: 10.1021/ja051052x. [DOI] [PMC free article] [PubMed] [Google Scholar]
- 15.Badger RM. J Chem Phys. 1935;3:710–714. [Google Scholar]
- 16.Green MT. J Am Chem Soc. 2006;128:1902–1906. doi: 10.1021/ja054074s. [DOI] [PubMed] [Google Scholar]
- 17.Linder DP, Rodgers KR. Inorg Chem. 2005;44:8259–8264. doi: 10.1021/ic0504745. [DOI] [PubMed] [Google Scholar]
- 18.Lai HH, Li TS, Lyons DS, Phillips GN, Olson JS, Gibson QH. Proteins. 1995;22:322–339. doi: 10.1002/prot.340220404. [DOI] [PubMed] [Google Scholar]
- 19.Karow DS, Pan DH, Tran R, Pellicena P, Presley A, Mathies RA, Marletta MA. Biochemistry. 2004;43:10203–10211. doi: 10.1021/bi049374l. [DOI] [PubMed] [Google Scholar]
- 20.Pellicena P, Karow DS, Boon EM, Marletta MA, Kuriyan J. Proc Natl Acad Sci USA. 2004;101:12854–12859. doi: 10.1073/pnas.0405188101. [DOI] [PMC free article] [PubMed] [Google Scholar]
- 21.Das TK, Wilson EK, Cutruzzola F, Brunori M, Rousseau DL. Biochemistry. 2001;40:10774–10781. doi: 10.1021/bi002327i. [DOI] [PubMed] [Google Scholar]
- 22.Nurizzo D, Cutruzzola F, Arese M, Bourgeois D, Brunori M, Cambillau C, Tegoni M. Biochemistry. 1998;37:13987–13996. doi: 10.1021/bi981348y. [DOI] [PubMed] [Google Scholar]
- 23.Nioche P, Berka V, Vipond J, Minton N, Tsai AL, Raman CS. Science. 2004;306:1550–1553. doi: 10.1126/science.1103596. [DOI] [PubMed] [Google Scholar]
- 24.Ghosh A. Accounts Chem Res. 2005;38:943–954. doi: 10.1021/ar050121+. [DOI] [PubMed] [Google Scholar]
- 25.Franzen S. J Am Chem Soc. 2002;124:13271–13281. doi: 10.1021/ja017708d. [DOI] [PubMed] [Google Scholar]
- 26.Copeland DM, West AH, Richter-Addo GB. Proteins. 2003;53:182–192. doi: 10.1002/prot.10495. [DOI] [PubMed] [Google Scholar]
- 27.Copeland DM, SoareS AS, West AH, Richter-Addo GB. J Inorg Biochem. 2006;100:1413–1425. doi: 10.1016/j.jinorgbio.2006.04.011. [DOI] [PubMed] [Google Scholar]
- 28.Brucker EA, Olson JS, Ikeda-Saito M, Phillips GN. Proteins. 1998;30:352–356. [PubMed] [Google Scholar]
- 29.Rich AM, Armstrong RS, Ellis PJ, Lay PA. J Am Chem Soc. 1998;120:10827–10836. [Google Scholar]
- 30.Sono M, Roach MP, Coulter ED, Dawson JH. Chem Rev. 1996;96:2841–2887. doi: 10.1021/cr9500500. [DOI] [PubMed] [Google Scholar]
- 31.Paolocci N, Katori T, Champion HC, John ME, Miranda KM, Fukuto JM, Wink DA, Kass DA. Proc Natl Acad Sci USA. 2003;100:5537–5542. doi: 10.1073/pnas.0937302100. [DOI] [PMC free article] [PubMed] [Google Scholar]
- 32.Miranda KM. Coord Chem Rev. 2005;249:433–455. [Google Scholar]
- 33.Farmer PJ, Sulc F. J Inorg Biochem. 2005;99:166–184. doi: 10.1016/j.jinorgbio.2004.11.005. [DOI] [PubMed] [Google Scholar]
- 34.Rusche KM, Spiering MM, Marletta MA. Biochemistry. 1998;37:15503–15512. doi: 10.1021/bi9813936. [DOI] [PubMed] [Google Scholar]
- 35.Einsle O, Messerschmidt A, Huber R, Kroneck PMH, Neese F. J Am Chem Soc. 2002;124:11737–11745. doi: 10.1021/ja0206487. [DOI] [PubMed] [Google Scholar]
- 36.Averill BA. Chem Rev. 1996;96:2951–2964. doi: 10.1021/cr950056p. [DOI] [PubMed] [Google Scholar]
- 37.Sulc F, Fleischer E, Farmer PJ, Ma DJ, La Mar GN. J Biol Inorg Chem. 2003;8:348–352. doi: 10.1007/s00775-002-0422-7. [DOI] [PubMed] [Google Scholar]
- 38.Kachalova GS, Popov AN, Bartunik HD. Science. 1999;284:473–6. doi: 10.1126/science.284.5413.473. [DOI] [PubMed] [Google Scholar]
- 39.Vojtechovsky J, Chu K, Berendzen J, Sweet RM, Schlichting I. Biophys J. 1999;77:2153–74. doi: 10.1016/S0006-3495(99)77056-6. [DOI] [PMC free article] [PubMed] [Google Scholar]
- 40.Linder DP, Rodgers KR, Banister J, Wyllie GRA, Ellison MK, Scheidt WR. J Am Chem Soc. 2004;126:14136–14148. doi: 10.1021/ja046942b. [DOI] [PMC free article] [PubMed] [Google Scholar]
- 41.Walker FA. J Inorg Biochem. 2005;99:216–236. doi: 10.1016/j.jinorgbio.2004.10.009. [DOI] [PubMed] [Google Scholar]