Abstract
The functional relationship between correct response probability and response time is investigated in data sets from Rubin, Hinton and Wenzel, J Exp Psychol Learn Mem Cogn 25:1161–1176, 1999 and Anderson, J Exp Psychol [Hum Learn] 7:326–343, 1981. The two measures are linearly related through stimulus presentation lags from 0 to 594 s in the former experiment and for repeated learning of words in the latter. The Tagging/Retagging interpretation of short term memory is introduced to explain this linear relationship. At stimulus presentation the words are tagged. This tagging level drops slowly with time. When a probe word is reintroduced the tagging level has to increase for the word to be properly identified leading to a delay in response time. The tagging time is related to the meaningfulness of the words used—the more meaningful the word the longer the tagging time. After stimulus presentation the tagging level drops in a logarithmic fashion to 50% after 10 s and to 20% after 240 s. The incorrect recall and recognition times saturate in the Rubin et al. data set (they are not linear for large time lags), suggesting a limited time to search the short term memory structure: the search time for recall of unusual words is 1.7 s. For recognition of nonsense words the corresponding time is about 0.4 s, similar to the 0.243 s found in Cavanagh (1972).
Keywords: Memory store, Response probability, Response time, Short term memory, Recall, Recognition, Memory tagging
Introduction
In this paper I examine the functional relationship between recall/recognition probability and response time. This relationship appears to have been neglected in the literature in part because the two measurements developed separately. In their review of research on recall/recognition probabilities and responses times, Kahana and Loftus (1999) wrote that before the 1970s typically only probabilities were measured because of the difficulty involved in response time measurements. After the proliferation of personal computers in the labs response time measurements became easier to perform. However, response times were thought of as separate from response probabilities and the two properties were not studied together. Kahana and Loftus wrote that “it is probably fair to say that almost all RT research is concerned with tasks where error rates are negligible” and that “rarely are both investigated simultaneously in a given experimental design.” Indeed, even in the Kahana and Loftus paper recall/recognition probabilities and response times are drawn in separate graphs, and, with one exception, there is no graph showing how the response time varies with response probability. The exception is speed-accuracy trade-off curves for which the manipulated variable is the response time. There are also no recall/recognition probability versus response time graphs in reviews on memory research by Neath (1998) or by Anderson (1995).
The neglect of a simultaneous study of response probability and time also appears in the modeling of experimental data. Global memory models are typically static models (Gronlund and Ratcliff 1989) and do not involve the element of time needed to account for response times (for a review, see Clark and Gronlund 1996). There is at least one exception, REM-ARC (Nobel and Shiffrin 2001). However, the times considered were those of episodic memory data with lag times between 0.1 and 4.5 s. Global memory models are not directly derived from the underlying neuronal mechanisms, and the predictions of such are probably limited to the experimental results they were fitted to or interpolations thereof. Since they have not been fitted to the data set considered below and since they do not cover the full 0–594 s experimental time scale, global memory models will not be further considered in this paper.
I will use two experimental data sets in this article. The first is Rubin, Hinton and Wenzel (1999) who investigated word recall/recognition probabilities and times ranging from 0 to 594 s time lags with very small statistical error bars. The accuracy makes this experimental data set a center piece for memory researchers interested in recall and recognition probabilities and response times.
The second data set is Anderson (1981) who studied recognition and recall probabilities and response times with and without interference. He focused his attention on the fact that interference shifts the curves of response time and probability but also noted that when he plotted response probabilities and times for probabilities from 0.8 to 1.0 he found a straight line.
Experimental information
In the Rubin et al. (1999) experiment, the items used for recall and recognition were different. For recall words were chosen from Kucera and Francis (1967) to have frequencies between 10 and 100 per million. Proper names, plurals, words with apostrophes, and highly emotional words were excluded. For recognition, they used digit-letter-digit trigrams of the form used in Canadian postal codes. Their data were reported in “lags”. Each trial took 6 s which means that lag of 0 corresponds to 0 s after the end of the stimulus presentation and N lag corresponds to 6*N s after the end of the stimulus presentation. The data set I will use is restated here from the original paper with the additional time component (Tables 1 and 2).
Table 1.
Recall data set [corresponding to Tables A1, A4 and A5 in Rubin et al. (1999)]
| Lag | Seconds after end of stimulus presentation (calculated) | Probability of recall (all three measures) | Response times in seconds for correct responses—(all three measures) | Response times in seconds for incorrect responses—(all three measures) |
|---|---|---|---|---|
| 0 | 0 | .944 | 1.356 | 2.292 |
| 1 | 6 | .646 | 1.822 | 2.722 |
| 2 | 12 | .434 | 2.017 | 2.938 |
| 4 | 24 | .379 | 2.086 | 2.872 |
| 7 | 42 | .335 | 2.111 | 2.960 |
| 12 | 72 | .301 | 2.238 | 3.001 |
| 21 | 126 | .231 | 2.279 | 2.970 |
| 35 | 210 | .183 | 2.402 | 2.978 |
| 59 | 354 | .133 | 2.540 | 2.969 |
| 99 | 594 | .112 | 2.427 | 2.927 |
Table 2.
Recognition data set [corresponding to Tables A2, A4 and A5 in Rubin et al. (1999)]
| Lag | Seconds after end of stimulus presentation (calculated) | Probability of recognition (all three measures) | Response time in seconds for correct recognition | Response time in seconds for incorrect recognition |
|---|---|---|---|---|
| 0 | 0 | 0.81 | 1.128 | 1.324 |
| 1 | 6 | 0.642 | 1.214 | 1.456 |
| 2 | 12 | 0.503 | 1.227 | 1.509 |
| 4 | 24 | 0.475 | 1.247 | 1.481 |
| 7 | 42 | 0.401 | 1.261 | 1.505 |
| 12 | 72 | 0.358 | 1.282 | 1.517 |
| 21 | 126 | 0.278 | 1.254 | 1.463 |
| 35 | 210 | 0.195 | 1.292 | 1.485 |
| 59 | 354 | 0.141 | 1.278 | 1.472 |
| 99 | 594 | 0.134 | 1.287 | 1.472 |
In the Anderson (1981) experiments, the word items used were similar for recall and recognition and they were selected from Paivio et al. (1968) to be high in imagery, concreteness, and “meaningfulness”.—I will adopt the latter term for simplicity to describe the differences between the words in Anderson and Rubin et al. experiments.
Results and discussion
Correct recall (recognition): response time is linearly related to probability of correct answer with R of 0.98 (0.83)
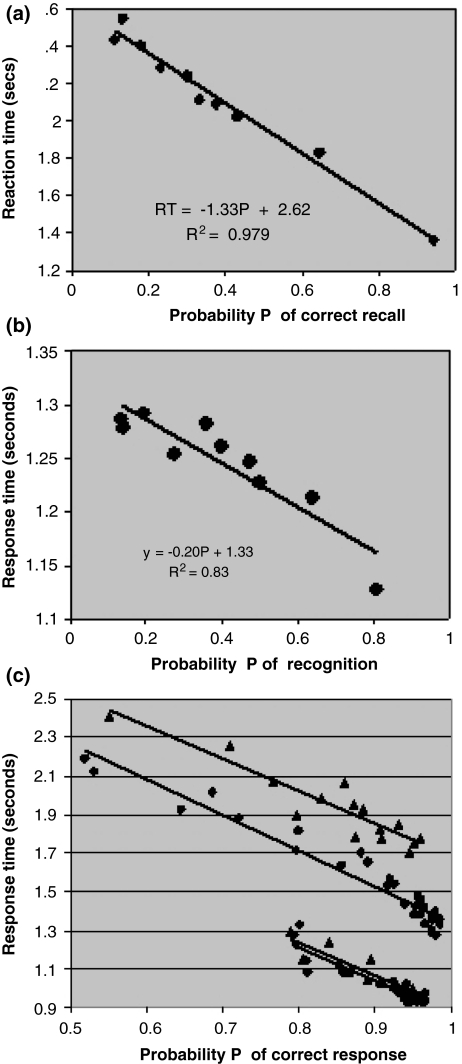
Let us begin by plotting the response time against the probability of correct recall in Rubin et al. (1999) (Fig. 1a). The response time is linearly related to the probability of recall with R squared being 0.98 over a probability range of 0.11–0.95 and over a time range of 0–594 s. A recent item (0 s after end of stimulus presentation) requires a total response time of about 1.3 s while an item that is typically no longer to be found for most participants (594 s after stimulus presentation) requires 2.6 s.
Fig. 1.
(a) Response time as a function of the probability of correct recall from Rubin et al. (1999). The time after stimulus presentation is not shown but short times correspond to high probability of recall and long times correspond to low probability of recall. Data set from Table 1. (b) Response time as a function of the probability of recognition from Rubin et al. (1999). The time after stimulus presentation is not shown but short times correspond to high probability of recognition and long times correspond to low probability of recognition. Note that the time scale is much smaller than the time scale in Fig. 1a so the experimental noise accounts for a larger amount of R. Data set from Table 2. (c) Response time as a function of the probability of recognition (lower curves) and recall (upper curves) from Anderson (1981). The triangles represent data with interference, the circles data without interference
In Fig. 1b is shown the corresponding data set for recognition. It seems to obey a linear relationship as well over roughly the same range of probabilities (0.13–0.81) and the same time range of 0–594 s. A recent item requires a total response time of about 1.13 s while an item that is old and typically no longer to be found requires 1.33 s. The scale of the time differences is much smaller than for recall and the level of statistical noise present in the experiment accounts for a larger part of the variance but R is still an impressive 0.83.
The data set from Anderson (1981) is shown in Fig. 1c where I have gone beyond Anderson by plotting all experimental data in the same graph, i.e. recall and recognition with and without interference, and included are also the data points below the 0.7 cutoff imposed by Anderson. Note that, as Anderson did, the data set looks linear (even below Anderson’s 0.7 cutoff). Just like the data set in the Rubin et al. (1999) experiment was linear over a surprisingly large time range, the Anderson data set is linear even though it contains points corresponding to new learning and “improved learning” as the subjects studied a second list with similar words and were more adept at the task.
The linear functional curves found are the central findings of this paper. Their simplicity suggests that they describe a core property of short term memory. They should be useful for memory modeling researchers because they obviously present a simple test for models.
Correct recall/recognition: the Tagging/Retagging interpretation of short term memory and the relationship of tagging time to the meaningfulness of a word
The established linear relationship between response time and probability of recall and recognition between 0 and 594 s in the Rubin et al. (1999) experiment suggests the Tagging/Retagging interpretation of short term memory.
When presented with a word, a subject tags that word by marking long term memory locations. The tagging level, defined as the probability of a correct identification, then slowly drops until the word is reintroduced, at which point the tagging level goes back up (the same word is read again and subjected to the same procedure as the first time it was presented). The retagging time can be inferred from the delay in the response and is found to be proportional to the tagging level drop from the linear relationship between response time and probability of recall and recognition. When the tagging level of the probe word drops to x%, the tagging level of the reference to the initial list (for recognition) and of the word association (for recall) also drops to x%. As the exposure to the probe word retags the probe word, the tagging levels of the list reference and word association are not increased and the subject only responds correctly x% of the time.
The experimental response time is the time it takes to fully re-tag the corresponding long term memory locations, find the list reference (for recognition) or the word association (for recall) and then initiate the motor response. The time it takes to initially tag long term memory locations can be calculated as the difference between the response time at the point which the probability of recognition is zero (everything has to be re-tagged) and the response time at the point which the probability of recognition is one (everything that could be tagged was just tagged).
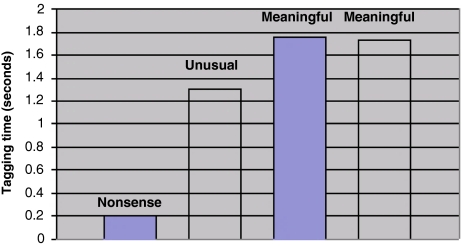
The tagging times are summarized in Table 3 and plotted in Fig. 2. The tagging time is related to the type of words used in the experiments. The more “meaningful” the memory item (adopting one of Anderson’s terms) the longer the tagging time. This makes sense; it should take longer to tag an item that may have many associations associated with it. Conversely, the tagging time is an operational definition of meaningfulness.
Table 3.
Slopes for the Rubin and Anderson data set
| Tagging time (seconds) | Memory items | |
|---|---|---|
| Rubin recognition | 0.2 | Digit-letter-digit trigrams (“nonsense”) |
| Rubin recall | 1.3 | Unusual words without emotional content (“unusual”) |
| Anderson recall | 1.84 and 1.69 | Words high in imagery, concreteness, and meaningfulness (“meaningful”) |
| Anderson recognition | 1.73 and 1.72 | Words high in imagery, concreteness, and meaningfulness (“meaningful”) |
Fig. 2.
Tagging times from Table 3. The solid bars correspond to recognition and the textured bars correspond to recall
In the Anderson data set the words used for both recall and recognition were the same and the average tagging times is roughly the same for both (it varies from 1.69 to 1.84). The response times for recall (without interference) are higher by about half a second suggesting that it takes half a second to find the word associated with the probe word and initiate the typing of it (see Fig. 1c). The response times for recognition are the same with and without interference, but for recall they are different in the two conditions. The interference was perhaps less related to the initial list reference (not affecting recognition) and more related to the words presented (affecting recall by adding another 0.3 s to the response time).
Correct response in the Tagging/Retagging interpretation: the tagging disappears logarithmically with time
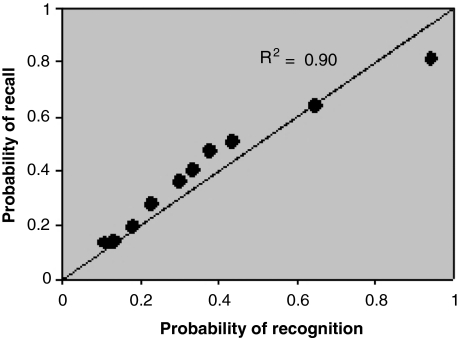
The tagging level drops equally fast in both recognition and recall, i.e. for the initial list reference and for the word association (see Fig. 3). It is tempting to suggest a universal time scale for the tagging level drop.
Fig. 3.
Probability of recognition and recall for the same delay times in the Rubin et al. experimental data. The line is the x = y function and the corresponding R is 0.90
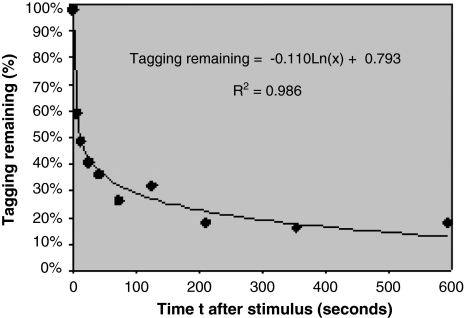
The tagging level drop with time can be calculated from Tables 1 and 2. We average the probabilites of recognition and recall to get the best statistics (Fig. 4). I obtain a logarithmic curve. The time for the tagging to drop by 50% is about 14 s (similar to the finding of Peterson and Peterson (1959)) but because of the logarithmic decay the time to drop to 20% is much longer—220 s.
Fig. 4.
Tagging remaining averaged over the Rubin et al. (1999) recall and recognition memory items. The curve represents a two parameter logarithmic fit, moving t = 0 to t = 0.5 s to avoid a divergence. Data set from Tables 1 and 2
Incorrect recall/recognition: saturation of the response time and the total time to search short term memory during recall
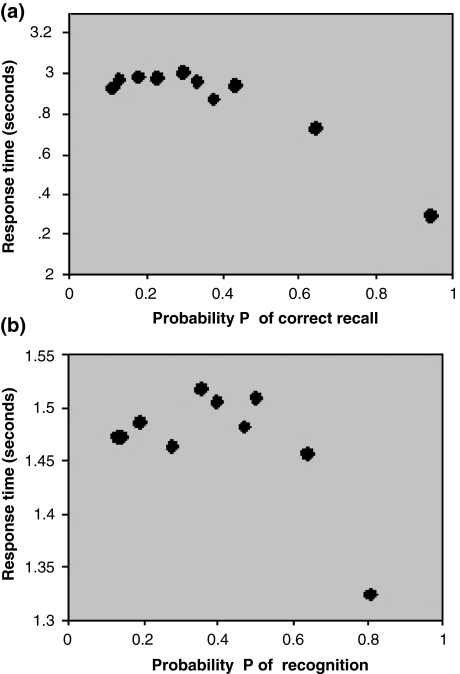
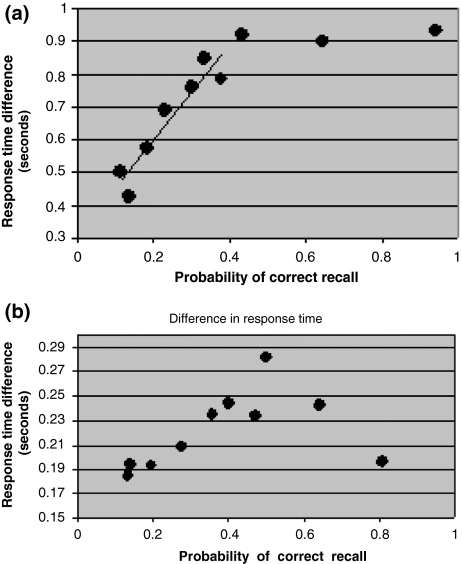
Let us consider the response times for incorrect recall and recognition in the Rubin et al. (1999) experiment as shown in Fig. 5a, b. When the correct recall and recognition probabilities are large, the response times for incorrect recall and recognition change linearly just like for correct recall and recognition. However, when the correct recall (recognition) probability decreases the response times for incorrect recall and recognition saturate and become constant. The response times are always larger for incorrect recall or recognition than for correct recall or recognition (the differences in response time between the incorrect and correct searches are shown in Fig. 6a, b below).
Fig. 5.
(a) Response time for incorrect recall as a function of the probability of correct recall (to keep the scales the same throughout the paper). Data set from Table 1. (b) Response time for incorrect recognition as a function of the probability of correct recognition (to keep the scales the same throughout the paper). Data set from Table 2
Fig. 6.
(a) Difference in response times between incorrect and correct recall as a function of the probability of correct recall. Data set from Table 1. (b) Difference in response times between incorrect and correct recognition as a function of the probability of correct recognition. Data set from Table 2
It is possible to infer the temporal size of short term memory if we assume that the search yielding the correct result is not exhaustive but the search yielding the saturated incorrect result is. The search time for recall of unusual words is the difference between the total saturated response time for incorrect recall of 3 s at low correct recall probability (Fig. 5a) minus the shortest response time recorded, the response time for correct recall at P = 1 (Fig. 1a), 1.3 s, which yields 1.7 s. The noise in the data set for recognition of nonsense words makes it more difficult to assess the corresponding time—a rough estimate is 1.5–1.13 = 0.4 s. This latter estimate appears to be the first non-Sternberg task result that can be compared to the Cavanagh (1972) time estimate to fully search short term recognition memory of 0.243 s.
Summary
In memory research there is a tradition dating back to Ebbinghaus to find the precise shape of the memory decay curve. Most recently Rubin et al. (1999) suggested that the curve needed an eight parameter fit through the experimental time period (0–594 s). To a theorist this is discouraging since it suggests that there are many different mechanisms behind the measured memory decay and disentangling the various contributions at various time scales can be very difficult. In this paper I found that there is an easier angle of attack. All of the experimental points can be fitted with a single straight line as long as one considers a different set of variables than traditionally used, the probability of recall/recognition and the response time.
The Tagging/Retagging interpretation explains the straight line. The retagging is proportional to the tagging drop and it is associated with an increase in the response time. The tagging drop occurs for all parts of the memory including the reference to the initial list and the words associated with the probe word. Assuming that the probability of identification of the list reference (for recognition) or of the associated word (for recall) is proportional to the tagging that remains, the tagging drop leads to a corresponding proportional drop in the probability of correct recall or recognition. Thus we get a straight line connecting response time and probability of correct recall or recognition.
I found that the more “meaningful” the words used, the longer time it took the subjects to initially tag the word, thus “meaningfulness” and tagging time seem to be related concepts.
From the curves of incorrect responses I calculated the time it takes to do an exhaustive search of short term memory. It is 0.4 s for recognition of nonsense words and 1.7 s for recall of unusual words. This former number is not too dissimilar to Cavanagh’s (1972) estimate of 0.243 s.
What could be the biological underpinning of the Tagging/Retagging interpretation? Modulatory neurons create slow synaptic potentials which last minutes (Kandel 1996, p. 222 and Kandel 2004). These potentials were shown to facilitate presynaptic connections which could be the tagging of word long term memory locations (tagging is considered to be short term memory see, for example, Cowan 1988, 1995). In the experiments of Rubin et al. (1999) and Anderson (1981) the subjects seemed to have little long term memory of the memory item which is consistent with long term memory requiring protein synthesis in the synapses which takes about an hour (Kandel 2004). The probability of transfer of short term memory into long term memory should be the overlap of the tagging drop function and the protein synthesis function. The tagging function has a logarithmic decay which allows it to extend substantially in time—while it drops to 50% in 10 s it still has 20% left after 6 min.
Questions that the Tagging/Retagging interpretation raises but that were not answered in this article include:
What is the chemistry of the tagging? The logarithmic decay suggests a distribution of energy barriers for the corresponding chemical reactions taking place.
How does the tagging process stop when the item is fully tagged?
Why is the retagging time proportional to the tagging level drop?
Is the retagging time really only dependent upon the meaningfulness of the item (interference does not seem to change the retagging time)? How does it change with changes in neuro transmitter levels?
Is the time dependence of the drop in tagging level the same for all memory items?
What makes the tagging process so specific so that words, word associations and list references are tagged independently? Is the tagging process always so specific?
Acknowledgement
Thanks to Nelson Cowan and Stephen Schmidt for comments on an earlier version of the manuscript.
References
- Anderson JR (1981) Interference: the relationship between response latency and response accuracy. J Exp Psychol [Hum Learn] 7:326–343 [DOI]
- Anderson JR (1995) Learning and memory. Wiley, New York
- Cavanagh JP (1972) Relation between the immediate memory span and the memory search rate. Psychol Rev 79:525–530 [DOI]
- Clark SE, Gronlund SD (1996) Global matching models of recognition memory: how the models match the data. Psychon Bull Rev 3:37–60 [DOI] [PubMed]
- Cowan N (1988) Evolving conceptions of memory storage, selective attention, and their mutual constraints within the human information processing system. Psychol Bull 104:163–191 [DOI] [PubMed]
- Cowan N (1995) Attention and memory: an integrated framework. Oxford psychology series, no. 26. Oxford University Press
- Gronlund SD, Ratcliff R (1989) Time course of item and associative information: implications for global memory models. J Exp Psychol 15:846–858 [DOI] [PubMed]
- Kahana M, Loftus G (1999) Response time versus accuracy in human memory. In: Sternberg R (ed) The nature of cognition. MIT Press, Masschusetts
- Kandel E (1996) In search of memory. W. W. Norton & Company, New York
- Kandel E (2004) The molecular biology of memory storage: a dialogue between genes and synapses. Science 294:1030–1038 [DOI] [PubMed]
- Kucera H, Francis WN (1967) Computational analysis of present-day American English. Brown University Press, Providence
- Neath I (1998) Human memory. Brooks/Cole, Pacific Grove
- Nobel PA, Shiffrin RM (2001) Retrieval processes in recognition and cued recall. J Exp Psychol Learn Mem Cogn 27:384–413 [DOI] [PubMed]
- Paivio A, Yuille JC, Madigan SA (1968) Concreteness, imagery, and meaningfulness values for 925 nouns. J Exp Psychol 76(Suppl 1):1–25 [DOI] [PubMed]
- Peterson LR, Peterson MJ (1959) Short-term retention of individiual verbal items. J Exp Psychol 58:193–198 [DOI] [PubMed]
- Rubin DC, Hinton S, Wenzel A (1999) The precise time course of retention. J Exp Psychol Learn Mem Cogn 25:1161–1176 [DOI]


