

Abstract
Background
Decisions to screen older patients for cancer are complicated by the fact that aging populations are heterogeneous with respect to life expectancy.
Objective
To examine national trends in the association between cervical cancer screening and age, health and hysterectomy status.
Design and participants
Cross-sectional data from the 1993, 1998, 2000, and 2005 National Health Interview Surveys (NHIS) were used to examine trends in screening for women age 35–64 and 65+ years of age. We investigated whether health is associated with Pap testing among older women using the 2005 NHIS ( = 3,073). We excluded women with a history of cervical cancer or who had their last Pap because of a problem.
Measurements
The dependent variable was having a Pap test within the past 3 years. Independent variables included three measures of respondent health (the Charlson comorbidity index (CCI), general health status and having a chronic disability), hysterectomy status and sociodemographic factors.
Main results
NHIS data showed a consistent pattern of lower Pap use among older women (65+) compared to younger women regardless of hysterectomy status. Screening also was lower among older women who reported being in fair/poor health, having a chronic disability, or a higher CCI score (4+). Multivariate models showed that over 50% of older women reporting poor health status or a chronic disability and 47% with a hysterectomy still had a recent Pap.
Conclusions
Though age, health and hysterectomy status appear to influence Pap test use, current national data suggest that there still may be overutilization and inappropriate screening of older women.
KEY WORDS: cervical screening, hysterectomy, older age, health status, comorbidity
INTRODUCTION
Decisions to screen older patients for cancer often are complicated by the fact that aging populations are heterogeneous with respect to life expectancy. As life expectancy decreases with age and worsening health, so does the probability that a patient will benefit from early detection.1 However, if life expectancy is long, healthy older adults may continue to benefit from screening. Walter and Covinsky suggest that it may be more useful for clinicians to consider patient characteristics and preferences than simply using age to guide screening decisions in older patients.2
Recently, several professional organizations have updated their clinical guidelines to recommend an age at which older women (defined as 65 or 70 years of age depending on the organization) who have had adequate recent screening with no abnormal Pap test results may discontinue cervical cancer screening.3,4 Inclusion of an upper age limit in clinical guidelines is a result of growing evidence suggesting that the benefits of early detection (i.e., prolonged life and reduced disease-specific mortality) are not likely to be realized by older women at low risk for cervical cancer. Furthermore, the potential harms associated with screening, such as false-positive results, anxiety and invasive follow-up procedures, are thought to outweigh the benefits among older women with a history of normal screening tests because they are at low risk.3 Recent data from the Women’s Health Initiative suggest that sexually-active older women who are not married or living with a partner may benefit from continued screening because of the increased chance for new exposure to human papillomavirus.5 Regardless of age, routine screening is considered unnecessary for women who have had a total hysterectomy for benign disease.3
Although cervical cancer screening guidelines recommend an upper age limit for women with a history of normal test results, variability in the life expectancy of older adults may render decisions about whether to continue screening difficult for low risk women. Lower rates of screening have been associated with increasing age, lack of contact with a primary care provider, not having a usual source of health care, low income, low educational attainment and being unmarried.6,7 Self-reported health status also has been correlated with screening use. In one study, younger women (ages 25–64) reporting excellent/very good health status were significantly more likely to report recent Pap use than those with poorer health status, but the same association between health status and screening was not found among older women (65+ years).6 In addition to self-reported health status, other measures of life expectancy, such as the presence of comorbid conditions and disability, have been correlated with cancer screening. For example, some studies have found that screening rates decreased with increasing comorbidity,8,9 but a study by Mandelblatt et al.10 found that older women with more than three chronic illnesses were twice as likely to get screened as women with fewer illnesses—perhaps because they had more opportunities to do so.
In this analysis, we examined whether the changes in clinical guidelines regarding older age are reflected in national screening rates and whether older women’s life expectancy influenced these rates. We first updated prior reports of national trends11 by describing Pap test rates stratified by age and hysterectomy status before and after guidelines were revised. We then explored whether and how life expectancy and hysterectomy status were associated with Pap use. Because there is no generally accepted way to measure life expectancy in national surveys, we tested models using three different measures of health available on the National Health Interview Survey (NHIS): the Charlson comorbidity index (CCI), general health status, and chronic disability. To our knowledge, this is the first attempt to capture health and comorbidity as a factor influencing Pap screening among older women in a nationally representative dataset. Given current guidelines and known correlates of Pap test use, we expected screening to be lower among older women in poor health and those who had undergone a hysterectomy.
METHODS
We analyzed data from the NHIS which is the leading source of health information on the U.S. civilian, noninstitutionalized population.12 An annual, in-person household survey, it collects demographic and health information using a complex, stratified, multistage sample designed to provide nationally representative data. The NHIS oversamples Hispanics and African Americans to improve their estimates.13
Dependent Variable-Recent Pap
U.S. Preventive Services Task Force (USPSTF) guidelines for cervical cancer screening define recent as having a Pap test within the past 3 years.3 The NHIS asked women when their most recent Pap was performed and why. Respondents who reported a personal history of cervical cancer or whose last Pap test was for a specific problem were excluded from the analysis because these tests were not likely performed for screening.
The behavioral model of health services utilization 14 has proved useful for explaining cancer screening.14–16 The model is multi-level incorporating patient, provider, and health systems factors to explain use of health services including predisposing characteristics (e.g., sociodemographics), enabling resources (e.g., health insurance) and need (for use to take place).15 The extensive literature demonstrating an association between these factors and cancer screening, and their availability in the NHIS dataset, facilitated our selection of covariates.
Independent Variables
We organized covariates used into four groups: health, hysterectomy status, health care access, and demographics.
Health We explored three different measures available on the NHIS to capture respondent health as a proxy for life expectancy: the CCI,17 general health status (excellent/good and fair/poor) and having a chronic disability (yes/no). We calculated a CCI with values ranging from 0–17 and used the following medical conditions: myocardial infarction, cerebrovascular disease, chronic pulmonary disease, ulcer disease, cancer, diabetes, renal disease, liver disease, connective tissue disease, and dementia. Based on the distribution of responses in the NHIS 2005, we created a categorical variable (0, 1–3, 4+, and missing). The CCI, one of the most commonly used comorbidity indices in the field of health services research, is a good predictor of mortality 17–19 and has been validated in many different settings. 20–22 Self-reported CCI’s predicted 1-year mortality comparably with indices based on administrative data.23
Hysterectomy Status Respondents self-reported hysterectomy status (yes/no).
Health Care Access Access to health care was measured by whether respondents had health insurance coverage (private, public or no health insurance) and a usual source of health care (yes/no). Health care utilization was measured by whether respondents had visited a doctor or OB/GYN in the last year. Health behaviors associated with Pap testing included having a mammogram within the past two years (yes/no) and smoking status (never/former/current). 24–26
Sociodemographics Demographic measures included age, race/ethnicity (Hispanic, non-Hispanic white, non-Hispanic black), immigration status (born in U.S., in U.S. <10 years and in U.S. 10+ years), marital status (married/living with partner and not married), educational attainment (less than high school, high school graduate, some college, college graduate) and annual household income (<$20k, $20k – $34, 999, $35k – $54,999, $55k – $74,999 and $75k and over).
Statistical Analysis
We computed frequencies and regressions using SUDAAN 9.01 software 27, because it takes into account NHIS’s complex sample design. First, we examined trends in screening by hysterectomy status for women age 35–64 and 65+ years using NHIS data from 1993 ( = 5,405 and = 2,655, respectively), 1998 ( = 8,421 and = 3,594, respectively), 2000 ( = 8,361 and = 3,458, respectively), and 2005 ( = 8,158 and = 3,148, respectively). Data comparing trends by year were standardized to the 2000 population using 5-year age groups. We limited our analysis to years in which respondents were asked to report both whether they had had a hysterectomy and a Pap. While all these samples excluded respondents with a history of cervical cancer, not all of them were asked about the reason for the last Pap (i.e., routine or for a specific problem). However, the 2005 sample did make this distinction. Therefore, in the next phase of the analysis investigating whether health and hysterectomy status were associated with recent screening among older women, we excluded 75 NHIS 2005 respondents who had their most recent Pap due to a specific problem (i.e., sample size reduced from 3,148 to 3,073).
To address whether health and hysterectomy status were associated with a recent Pap among older women, we investigated univariate associations by computing weighted percentages and 95% confidence intervals. Next, we conducted multivariate logistic regression analyses controlling for known correlates. Because the CCI, general health status and chronic disability are correlated and measure similar constructs, we ran three separate models. Independent variables that did not show significant variation with the outcome, had a sample size <50 in a given stratum or were temporally inconsistent with the outcome variable (e.g., doctor’s visit in the last year vs. 3 years) were not included in the final models. From the odds ratios of the logistic models, we computed adjusted proportions called predicted marginals for each category of an independent variable.28 This method standardizes measures to adjust for covariates and can be interpreted like percentages. Predicted marginals have intuitive appeal because they make it easier for readers to assess the prevalence of sample in each category.
RESULTS
Figure 1 displays cervical cancer screening rates from 1993 to 2005 stratified by age (35–64 and 65+) and hysterectomy status. Younger women showed consistently higher screening rates (range: 75.8–87.1%) than older women (range: 48.6–67.8%) over the 12-year period regardless of hysterectomy status. For both age groups, recent Pap use increased between 1993 and 2000, after which rates appear to decline. Younger women with a hysterectomy had significantly lower screening rates in any given year than other women in the same age cohort, but still screened at higher rates than older women overall. For example, in 2005, screening rates among women ages 35–64 who had and did not have a hysterectomy were 75.8% (CI: 72.4, 78.8) and 84.7% (CI: 83.6, 85.7), respectively, while rates among older women who had a hysterectomy were lower than among older women with no hysterectomy (48.6% (CI: 45.6, 51.5) vs. 59.8% (CI: 57.4, 62.2)).
Figure 1.
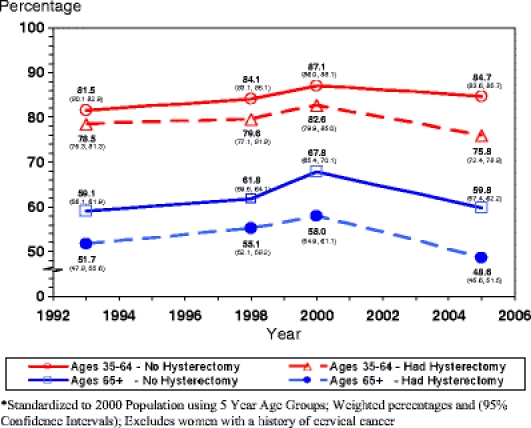
Use of Pap tests within the past 3 years by age and hysterectomy status, NHIS 1993–2005.
Table 1 displays the distribution of sociodemographic, health care access and health characteristics of older women and the percentage who reported a recent Pap test in 2005. Screening declined with increasing age (from 72% in women 65–69 years to 40% in women 80+). Lower screening rates were reported by women who had lower educational attainment, lower household income or were not married. Women with no recent Pap also were less likely to have had private health coverage, a usual source of healthcare, a recent healthcare visit, or a recent mammogram. Current smokers had lower rates than former or never smokers, though these results were not statistically significant. Women who reported a hysterectomy, fair/poor health, a chronic disability, or a higher CCI score (4+) also were less likely to report a recent test.
Table 1.
Distribution of Characteristics of Women Ages 65+ and the Percentage Who Report a Recent Pap Test, National Health Interview Survey 2005
| Variables | Women age 65+ ( = 3,073) | Reporting Pap < 3 Years ( = 1,674) | |
|---|---|---|---|
| Weighted % (95% CI) | Weighted % (95% CI) | ||
| Total | 3,073 | 100 (NA, NA) | 55.5 (53.3, 57.6) |
| Age group | |||
| 65–69 | 787 | 27.8 (25.9, 29.8) | 71.9 (68.2, 75.3) |
| 70–74 | 714 | 23.7 (22.1, 25.3) | 60.6 (56.6, 64.4) |
| 75–79 | 654 | 20.8 (19.1, 22.5) | 48.5 (44.1, 52.8) |
| 80+ | 918 | 27.7 (25.9, 29.6) | 40.0 (36.3, 43.8) |
| Race/Ethnicity† | |||
| NH white | 2,374 | 84.4 (82.5, 86.1) | 54.7 (52.2, 57.1) |
| NH black | 344 | 9.1 (7.7, 10.7) | 61.1 (54.0, 67.7) |
| Hispanic | 268 | 6.5 (5.5, 7.7) | 60.7 (52.6, 68.2) |
| Immigration | |||
| Born in US | 2,695 | 88.5 (87.1, 89.7) | 55.0 (52.7, 57.3) |
| In US < 10 years | 15 | * | * |
| In US 10+ years | 359 | 10.8 (9.5, 12.2) | 59.4 (53.5, 65.2) |
| Missing | 4 | * | * |
| Marital status | |||
| Married, LWP | 902 | 42.3 (40.1, 44.5) | 63.0 (59.7, 66.3) |
| Not married | 2,162 | 57.5 (55.3, 59.7) | 49.9 (47.5, 52.3) |
| Missing | 9 | * | * |
| Education | |||
| Less than high school | 855 | 25.2 (23.3, 27.2) | 46.6 (42.2, 51.1) |
| High school graduate | 1,093 | 37.2 (35.0, 39.4) | 53.2 (49.9, 56.6) |
| Some college | 654 | 21.8 (20.2, 23.4) | 60.5 (55.9, 64.9) |
| College graduate | 438 | 14.5 (13.0, 16.2) | 69.8 (64.7, 74.4) |
| Missing | 33 | * | * |
| Annual household income‡ | |||
| <$20,000 | 1,416 | 36.6 (34.4, 38.8) | 47.3 (44.0, 50.6) |
| $20,000–$34,999 | 837 | 28.7 (26.6, 30.9) | 54.6 (49.7, 59.3) |
| $35,000–$54,999 | 460 | 17.8 (16.1, 19.8) | 64.6 (58.8, 69.9) |
| $55,000–$74,999 | 153 | 6.6 (5.4, 8.0) | 68.8 (59.3, 76.9) |
| $75,000 and over | 207 | 10.2 (8.7, 12.0) | 64.3 (55.1, 72.5) |
| Health coverage | |||
| Private | 1,876 | 63.3 (61.1, 65.5) | 58.0 (55.3, 60.5) |
| Public | 1,180 | 36.0 (33.9, 38.2) | 51.6 (48.0, 55.1) |
| None | 16 | * | * |
| Missing | 1 | * | * |
| Usual source of care | |||
| Yes | 2975 | 96.8 (95.8, 97.5) | 56.0 (53.8, 58.2) |
| No (includes ER) | 98 | 3.2 (2.5, 4.2) | 39.7 (29.4, 51.0) |
| MD visits in last year | |||
| None | 174 | 5.5 (4.6, 6.6) | 35.4 (27.7, 44.0) |
| 1 | 296 | 10.0 (8.8, 11.3) | 55.6 (49.3, 61.7) |
| 2–5 | 1294 | 41.5 (39.5, 43.5) | 57.8 (54.7, 60.9) |
| 6+ | 1274 | 42.0 (39.9, 44.1) | 55.8 (52.3, 59.2) |
| Missing | 35 | * | * |
| Seen OB/GYN in last year | |||
| Yes | 579 | 19.5 (17.8, 21.2) | 87.3 (83.8, 90.1) |
| No | 2491 | 80.5 (78.8, 82.1) | 47.8 (45.4, 50.2) |
| Missing | 3 | * | * |
| Mammogram within 2 years | |||
| Yes | 1896 | 63.5 (61.3, 65.6) | 72.2 (69.9, 74.5) |
| No | 1130 | 34.9 (32.7, 37.1) | 26.1 (23.2, 29.2) |
| Missing | 47 | * | * |
| Smoking status | |||
| Never | 1901 | 61.8 (59.7, 63.9) | 55.7 (52.9, 58.4) |
| Former | 903 | 29.7 (28.0, 31.5) | 56.1 (52.3, 59.8) |
| Current | 265 | 8.4 (7.3, 9.6) | 51.9 (45.0, 58.8) |
| Missing | 4 | * | * |
| Charlson comorbidity index | |||
| 0 | 703 | 22.9 (21.2, 24.8) | 55.5 (51.1, 59.9) |
| 1–3 | 1907 | 62.6 (60.5, 64.6) | 56.7 (53.9, 59.4) |
| 4+ | 399 | 12.6 (11.3, 14.0) | 49.7 (44.0, 55.5) |
| Missing | 64 | 1.9 (1.4, 2.5) | 54.0 (39.3, 68.0) |
| Health status | |||
| Excellent/Good | 2267 | 74.2 (72.4, 75.9) | 58.6 (56.2, 61.0) |
| Fair/Poor | 806 | 25.8 (24.1, 27.6) | 46.6 (42.6, 50.6) |
| Chronic disability | |||
| Yes | 1168 | 36.4 (34.4, 38.5) | 44.2 (40.9, 47.5) |
| No | 1905 | 63.6 (61.5, 65.6) | 62.0 (59.4, 64.5) |
| Hysterectomy status | |||
| Yes | 1239 | 41.5 (39.5, 43.6) | 50.0 (46.9, 53.2) |
| No | 1812 | 57.8 (55.7, 59.7) | 59.4 (56.7, 62.1) |
| Missing | 22 | * | * |
Excludes women with a history of cervical cancer and women tested due to a specific problem
"Missing" denotes Refused, Don’t Know, and Unknown responses
* Sample size <50
† Excludes 87 Non-Hispanic AIAN/Asian/Multiple-Race respondents
‡ Missing values have been imputed
Knowing that the three health measures (CCI, general health status and chronic disability) available on the NHIS are correlated with each other and are imprecise indicators of life expectancy, we tested each separately to see how they performed in multivariate regression models. Each of the three models reported in Table 2 adjusted for age, education, marital status, race/ethnicity, health insurance coverage, and recent mammogram use. The CCI was included in the first model (column 1), while general health status (column 2) and chronic disability (column 3) were included in the second and third models, respectively. Recent screening was associated with reports of being in excellent/good health and no chronic disabilities. Although the negative association between screening and CCI was consistent with the other two health measures, it was not statistically significant even when the index was modeled as a binary variable (data not shown).
Table 2.
Multivariate Logistic Regression Models Using Three Different Health Indicators for Women Ages 65+ Reporting a Pap Test Within the Past 3 Years, National Health Interview Survey 2005*
| Variables | Charlson index | Health status | Chronic disability | |||
|---|---|---|---|---|---|---|
| Predicted marginals† (95% CI) | Predicted marginals (95% CI) | Predicted marginals (95% CI) | ||||
| Charlson comorbidity index | = 0.5126 | |||||
| 0 | 57.2 | (52.8, 61.6) | ||||
| 1–3 | 56.2 | (53.6, 58.9) | ||||
| 4 | 53.2 | (47.6, 58.7) | ||||
| Health status | = 0.0315 | |||||
| Excellent-Good | 57.2 | (54.7, 59.7) | ||||
| Fair-Poor | 52.5 | (48.6, 56.4) | ||||
| Chronic disability | = 0.0001 | |||||
| Yes | 51.2 | (47.9, 54.5) | ||||
| No | 58.7 | (56.2, 61.3) | ||||
| Hysterectomy status | = 0.0000 | = 0.0000 | = 0.0000 | |||
| Yes | 47.6 | (44.4, 50.8) | 47.3 | (44.2, 50.4) | 47.4 | (44.3, 50.6) |
| No | 62.3 | (59.7, 64.9) | 62.4 | (59.8, 65.0) | 62.3 | (59.8, 64.9) |
*Excludes women with a history of cervical cancer or who had Pap test for a specific problem
†The percentages presented (predicted marginals) are adjusted for health coverage, 2-year mammogram, race, age, education and marital status. These adjusted proportions are obtained by directly standardizing the predicted probabilities from the logistic model to the entire weighted sample used in the analysis. Predicted marginals can be interpreted like percentages
In all three models, hysterectomy status showed a significant negative association with screening (Table 2). About 47% of women with a hysterectomy had a recent Pap test compared with approximately 62% of women with no hysterectomy ( = 0.0000). Patterns of association between screening and the adjusted covariates (age, education, marital status, race/ethnicity, and recent mammogram use) were the same in all models as described in Table 2. The exception was health insurance coverage. Health insurance coverage was not significant in any of the models, but was retained for conceptual reasons, because it is an indicator of health care access that has been highly correlated with cancer screening in U.S. populations.29,30
Conclusions
Our study provides the most recent data showing that national rates of cervical cancer screening are continuing to decline in older women and women who have undergone a hysterectomy. Over the time period we examined (1993 to 2005), NHIS data showed consistent patterns of lower Pap test use among older women (65+) compared to younger women regardless of hysterectomy status. Women who reported a hysterectomy were significantly less likely than other women in their age group to have a recent Pap. Our findings also document for the first time in a national dataset significant associations between measures of health (as proxies for life expectancy) and use of Pap tests among older women.
The data suggest that screening rates are lower for older women in poorer health (e.g., 57.2% with a recent Pap among women reporting excellent/good health compared to 52.5% of women in fair/poor health, = 0.03). Still, over half of women reporting poor health, a chronic disability, or a CCI of 4 or greater reported a recent Pap test. This finding indicates overutilization of screening among women who are unlikely to benefit from early detection. Our results are similar to findings from a 2000–2001 study conducted in California that showed overutilization of breast and cervical cancer screening among older women in poor health.1
It is unclear why women who seemingly won’t benefit from continued Pap testing still get screened. Some investigators have suggested that older women in poor health may be more motivated to get screened because of a greater sense of susceptibility to illness. They also may have more opportunities to screen because of frequent interactions with healthcare providers.31 Another possibility is that decisions to discontinue screening would involve a conversation between clinicians and patients about predicting life expectancy and there are no specific clinical guidelines on how to do this. Further, older adults may not understand concepts of uncertainty and probability that underlie understanding how competing causes of mortality and delayed benefits of screening influence the prudence of continued screening.32
A national survey of women 40 and older found that women were resistant to reducing the frequency of Pap tests as recommended by revised clinical guidelines especially if they thought a reduction was being suggested for cost rather than scientific reasons.33 Similarly, a qualitative study of attitudes about continuing cancer screening found that 43% of older adults would consider screening even if their doctor recommended against it.32 It is not clear whether these participants understood that the benefits of screening may not be realized for years or whether having this knowledge would make a difference in their enthusiasm for screening. Although patient preferences are important to consider, there is some evidence that physicians also account for patient health status in deciding whether to test,34 and our data support this.
Although recent Pap use was lower among all women who reported hysterectomies during the time period we examined (1993–2005), about half of older women with hysterectomies were screened within the three years prior to interview in 2005. Since we excluded women with a history of cervical cancer from our analysis, the women with a hysterectomy in our sample likely had the procedure for benign disease, suggesting that Pap testing was unnecessary. Our findings are not inconsistent with Behavioral Risk Factor Surveillance System data from 1999 to 2002 that showed more than two-thirds of hysterectomized women reported a recent Pap (a higher rate of inappropriate screening compared to our data).35 More of a decline might have been expected in our 2005 study both because the USPSTF recommended in 1996 that Pap testing is unnecessary for women who had a hysterectomy with removal of the cervix for benign disease and because of the considerable publicity generated by the earlier study.
We examined three different health indicators. Both poorer general health and chronic disability were independently associated with declining Pap use. Although the CCI did not reach statistical significance in our multivariate analysis, the pattern of association was consistent with the other two measures. Our findings for general health status are consistent with Walter and colleagues.1 With regards to chronic disability, research has shown that women with major lower extremity mobility difficulties are less likely to receive Pap tests.36 We could not ascertain this distinction with the NHIS data.
For a woman with short life expectancy, it would be clinically appropriate to forego cancer screening. Thus, the lower rate of screening among women with poor health status in our sample most likely represents a responsible population pattern. However, the lower screening rate among women with disabilities should be viewed with more caution. In our analysis, we could not distinguish whether the specific disability would reduce life expectancy. If it would not, then cancer screening would still be appropriate. Clinicians and health care systems need to facilitate access to cancer screening among disabled women with good life expectancy. The lack of a significant association between the CCI and screening may mean that clinicians do not pay attention to life expectancy or medical disease burden when deciding whether to perform cervical cancer screening, or the CCI, which was originally created to predict mortality, may not be as sensitive in detecting an association with health care utilization as the other two health measures. An earlier study using NHIS found that the CCI was significantly associated with PSA testing among men aged 45–74 (1.09, CI=1–1.18, = .041) but not among older men (75+).37 It should be noted that, in this analysis, the CCI was adapted to the content of the NHIS and has not been previously validated with this particular survey instrument; however, the adapted index used here was a fairly close approximation of other claims-based applications. 38
Although we used data from a large, nationally representative sample with high response rates to assess the association between age, health and hysterectomy status and cervical cancer screening, there are some limitations. Because the NHIS is cross-sectional, we cannot ascertain causality. Thus we cannot conclude that health status is the reason older women are getting fewer Pap tests. Nor can we conclude that revised clinical guidelines recommending longer screening intervals led to discontinuing screening at older ages or caused the decline in Pap use that we observed between 2000 and 2005. Furthermore, self-reported data could overestimate adherence.39 We could not assess the proportion of hysterectomies that were supracervical or performed for cervical neoplasia with our data. Nevertheless, prior national estimates indicate that almost half of women who have undergone hysterectomy are receiving unnecessary Pap tests.35
Though age, health and hysterectomy status appear to influence Pap test use, current national data suggest that there still is inappropriate screening of older women. The behavioral model of health services utilization,14,15 as well as other health behavior models 40–42 have historically focused on the challenge of increasing delivery and uptake of recommended clinical practices. However, evidence of widespread overutilization here and elsewhere in health care,43,44 suggests that more theoretic research on the factors that influence and explain overuse of health services is needed. Models have been applied to the overuse of antibiotics 45 and diagnostic tests 46,47 and extending similar efforts to understand individual, provider and system factors that encourage overutilization of screening would benefit both patients and society by avoiding tests that produce unnecessary risks and costs.
Informed decision making approaches, such as decision aids, could potentially reduce unnecessary Pap testing. For example, decision aids for prostate cancer screening have resulted in decreased interest in and use of PSA testing among patients seeking routine care.48 Yet informed decision-making approaches would be incomplete without incorporating information regarding life expectancy, the relevance of competing disease risks, and the delayed medical benefit of screening. Sometimes the ascertainment of unnecessary testing will be clear-cut, as in the case of women with a prior hysterectomy, and informational interventions will be relatively straightforward. Yet in more difficult cases, such as among women with advancing age or competing illnesses, informed decision-making approaches that help patients and clinicians better communicate about how these complex issues relate to cervical cancer screening will be beneficial.
Acknowledgements
The authors wish to thank William Waldron for expert programming.
Conflict of Interest None disclosed.
References
- 1.Walter LC, Lindquist K, Covinsky KE. Relationship between health status and use of screening mammography and Papanicolaou smears among women older than 70 years of age. Ann Intern Med. 2004;140:681–8. [DOI] [PubMed]
- 2.Walter LC, Covinsky KE. Cancer screening in elderly patients: a framework for individualized decision making. J Am Med Assoc. 2001;285:2750–6. [DOI] [PubMed]
- 3.U.S. Preventive Services Task Force. The Guide to Clinical Preventive Services, 2006. Available at: http://www.ahrq.gov/clinic/uspstf/uspstopics.htm#Ctopics. Accessed August 18, 2008.
- 4.Smith RA, Cokkinides V, Eyre HJ. American Cancer Society guidelines for the early detection of cancer, 2006. CA-Cancer J Clin. 2006;56:11–25. [DOI] [PubMed]
- 5.Yasmeen SM, Romano PSMM, Pettinger MM, et al. Incidence of cervical cytological abnormalities with aging in the women’s health initiative: a randomized controlled trial. Obstet Gynecol. 2006;108:410–9. [DOI] [PubMed]
- 6.Hewitt M, Devesa SS, Breen N. Cervical cancer screening among U.S. women: analyses of the 2000 National Health Interview Survey. Prev Med. 2004;39:270–8. [DOI] [PubMed]
- 7.Swan J, Breen N, Coates RJ, Rimer BK, Lee NC. Progress in cancer screening practices in the United States: results from the 2000 National Health Interview Survey. Cancer. 2003;97:1528–40. [DOI] [PubMed]
- 8.Kiefe CI, Funkhouser E, Fouad MN, May DS. Chronic disease as a barrier to breast and cervical cancer screening. J Gen Intern Med. 1998;13:357–65. [DOI] [PMC free article] [PubMed]
- 9.Kagay CR, Quale C, Smith-Bindman R. Screening mammography in the American elderly. Am J Prev Med. 2006;31:142–9. [DOI] [PubMed]
- 10.Mandelblatt JS, Gold K, O’Malley AS, et al. Breast and cervix cancer screening among multiethnic women: role of age, health, and source of care. Prev Med. 1999;28:418–25. [DOI] [PubMed]
- 11.Sirovich BE, Welch HG. The frequency of Pap smear screening in the United States. J Gen Intern Med. 2004;19:243–50. [DOI] [PMC free article] [PubMed]
- 12.National Research Council. Toward a national health care survey. A data system for 21st century. Washington, DC: National Academy Press; 1992.
- 13.Botman SL, Moore TF, Moriarity CL, Parsons VL. Design and estimation for the National Health Interview Survey, 1995–2004. Vital Health Statistics. 2000;2.
- 14.Andersen RM. Revisiting the behavioral model and access to medical care: does it matter? J Health Soc Behav. 1995;36:1–10. [DOI] [PubMed]
- 15.Phillips KA, Morrison KR, Andersen R, Aday LA. Understanding the context of healthcare utilization: assessing environmental and provider-related variables in the behavioral model of utilization. Health Serv Res. 1998;33:571–96. [PMC free article] [PubMed]
- 16.Coughlin SS, Breslau ES, Thompson T, Benard VB. Physician recommendation for papanicolaou testing among US women, 2000. Cancer Epidemiol Biomarkers Prev. 2005;14:1143–8. [DOI] [PubMed]
- 17.Charlson ME, Pompei P, Ales KL, MacKenzie CR. A new method of classifying prognostic comorbidity in longitudinal studies: development and validation. J Chronic Dis. 1987;40:373–83. [DOI] [PubMed]
- 18.D’Hoore W, Sicotte C, Tilquin C. Risk adjustment in outcome assessment: the Charlson comorbidity index. Methods of Information in Medicine. 1993;32:382–7. [PubMed]
- 19.Sundararajan V, Henderson T, Perry C, Muggivan A, Quan H, Ghali WA. New ICD-10 version of the Charlson comorbidity index predicted in-hospital mortality. J Clin Epidemiol. 2004;57:1288–94. [DOI] [PubMed]
- 20.Birim O, Maat APWM, Kappetein AP, van Meerbeeck JP, Damhuis RAM, Bogers AJJC. Validation of the Charlson comorbidity index in patients with operated primary non-small cell lung cancer. Eur J Cardio-Thorac Surg. 2003;23:30–4. [DOI] [PubMed]
- 21.Quan HM, Parsons GAR, Ghali WAM. Validity of information on comorbidity derived from ICD-9-CCM administrative data. Med Care. 2002;40:675–85. [DOI] [PubMed]
- 22.Singh BM, Bhaya MM, Stern JM, et al. Validation of the Charlson comorbidity index in patients with head and neck cancer: a multi-institutional study. Laryngoscope. 1997;107:1469–75. [DOI] [PubMed]
- 23.Chaudhry SM, Jin LM, Meltzer DM. Use of a self-report-generated Charlson comorbidity index for predicting mortality. Med Care. 2005;43:607–15. [DOI] [PubMed]
- 24.Rakowski W, Meissner H, Vernon SW, Breen N, Rimer B, Clark MA. Correlates of repeat and recent mammography for women ages 45 to 75 in the 2002 to 2003 Health Information National Trends Survey (HINTS 2003). Cancer Epidemiol Biomark Prev. 2006;15:2093–101. [DOI] [PubMed]
- 25.Clark MA, Rakowski W, Ehrich B. Breast and cervical cancer screening: associations with personal, spouse’s and combined smoking status. Cancer Epidemiol Biomark Prev. 2000;9:513–6. [PubMed]
- 26.Rakowski W, Clark MA, Ehrich B. Smoking and cancer screening for women ages 42–75: associations in the 1900–1994 National Health Interview Surveys. Prev Med. 1999;29:487–95. [DOI] [PubMed]
- 27.SUDAAN user’s manual, release 9.0.1. Research Triangle Park, NC: Research Triangle Institute, 2005.
- 28.Korn EL, Graubard BI. Analysis of Health Surveys. New York: John Wiley and Sons; 1999.
- 29.Vernon SW, Tiro JA, Meissner HI. Behavioral research in cancer screening. In: Miller S, Bowen DJ, Croyle RT, Rowland JH, eds. Handbook of Behavioral Science and Cancer. Washington, DC: American Psychological Association; 2008.
- 30.Hiatt RA, Klabunde C, Breen N, Swan J, Ballard-Barbash R. Cancer screening practices from national health interview surveys: past, present, and future. J Natl Cancer Inst. 2002;94:1837–46. [DOI] [PubMed]
- 31.Mandelblatt J, Lawrence W, Yi B, King J. The balance of harms, benefits, and costs of screening for cervical cancer in older women: the case for continued screening. Arch Intern Med. 2004;164:245–7. [DOI] [PubMed]
- 32.Lewis C, Kistler C, Amick H, et al. Older adults’ attitudes about continuing cancer screening later in life: a pilot study interviewing residents of two continuing care communities. BMC Geriatrics. 2006;6:10. [DOI] [PMC free article] [PubMed]
- 33.Sirovich BE, Woloshin S, Schwartz LM. Screening for cervical cancer: will women accept less? Am J Med. 2005;118:151–8. [DOI] [PubMed]
- 34.Heflin MT, Pollak KI, Kuchibhatla MN, Branch LG, Oddone EZ. The impact of health status on physicians’ intentions to offer cancer screening to older women. J Gerontol A Biol Sci Med Sci. 2006;61:844–50. [DOI] [PubMed]
- 35.Sirovich BE, Welch HG. Cervical cancer screening among women without a cervix. J Am Med Assoc. 2004;291:2990–3. [DOI] [PubMed]
- 36.Iezzoni LI, McCarthy EP, Davis RB, Harris-David L, O’Day B. Use of screening and preventive services among women with disabilities. Am J Med Qual. 2001;16:135–44. [DOI] [PubMed]
- 37.Lu-Yao G, Stukel TA, Yao SL. Prostate-specific antigen screening in elderly men. JNCI J Natl Cancer Inst. 2003;95:1792–7. [DOI] [PubMed]
- 38.Klabunde CN, Potosky AL, Legler JM, Warren JL. Development of a comorbidity index using physician claims data. J Clin Epidemiol. 2000;53:1258–67. [DOI] [PubMed]
- 39.Vernon SW, Briss PA, Tiro JA, Warnecke RB. Some methodologic lessons learned from cancer screening research. Cancer. 2004;101:1131–45. [DOI] [PubMed]
- 40.Zapka JG, Lemon SC. Interventions for patients, providers and health care organizations. Cancer. 2004;101:1165–87. [DOI] [PubMed]
- 41.Wagner EH, Austin BT, Von Korff M. Organizing care for patients with chronic illness. Milbank Q. 1996;74:511–44. [DOI] [PubMed]
- 42.Green LW, Kreuter MW. Health promotion planning. An educational and environmental approach. Mountain View, CA: Mayfield Publishing Company; 1991.
- 43.Fisher ES, Wennberg DE, Stukel TA, Gottlieb DJ, Lucas FL, Pinder EL. The implications of regional variations in medicare spending. Part 1: the content, quality, and accessibility of care. Ann Intern Med. 2003;138:273–87. [DOI] [PubMed]
- 44.Fisher ES, Wennberg DE, Stukel TA, Gottlieb DJ, Lucas FL, Pinder Et. The implications of regional variations in medicare spending. Part 2: health outcomes and satisfaction with care. Ann Intern Med. 2003;138:288–98. [DOI] [PubMed]
- 45.Avorn, JL, Barrett, JF., Davey, PG, McEwen, SA, O’Brien, TF, Levy, SB. Antibiotic resistance: synthesis of recommendations by expert policy groups. World Health Organization; 2001.
- 46.Melanson S, Szymanski T, Rogers S, et al. Utilization of arterial blood gas measurements in a large tertiary care hospital. Am J Clin Pathol. 2007;127:604–9. [DOI] [PubMed]
- 47.Solomon DH, Hashimoto H, Daltroy L, Liang MH. Techniques to improve physicians’ use of diagnostic tests: a new conceptual framework. JAMA J Am Med Assoc. 1998;280:2020–7. [DOI] [PubMed]
- 48.Volk RJ, Hawley ST, Kneuper S, et al. Trials of decision aids for prostate cancer screening: a systematic review. Am J Prev Med. 2007;33:428–34. [DOI] [PubMed]