

Abstract
Background
Prior to introduction of the prostate-specific antigen (PSA) test, the Seattle–Puget Sound and Connecticut Surveillance, Epidemiology and End Results (SEER) areas had similar prostate cancer mortality rates. Early in the PSA era (1987–1990), men in the Seattle area were screened and treated more intensively for prostate cancer than men in Connecticut.
Objective
We previously reported more intensive screening and treatment early in the PSA era did not lower prostate cancer mortality through 11 years and now extend follow-up to 15 years.
Design
Natural experiment comparing two fixed population-based cohorts.
Subjects
Male Medicare beneficiaries ages 65–79 from the Seattle ( = 94,900) and Connecticut ( = 120,621) SEER areas, followed from 1987–2001.
Measurements
Rates of prostate cancer screening; treatment with radical prostatectomy, external beam radiotherapy, and androgen deprivation therapy; and prostate cancer-specific mortality.
Main Results
The 15-year cumulative incidences of radical prostatectomy and radiotherapy through 2001 were 2.84% and 6.02%, respectively, for Seattle cohort members, compared to 0.56% and 5.07% for Connecticut cohort members (odds ratio 5.20, 95% confidence interval 3.22 to 8.42 for surgery and odds ratio 1.24, 95% confidence interval 0.98 to 1.58 for radiation). The cumulative incidence of androgen deprivation therapy from 1991–2001 was 4.78% for Seattle compared to 6.13% for Connecticut (odds ratio 0.77, 95% confidence interval 0.67 to 0.87). The adjusted rate ratio of prostate cancer mortality through 2001 was 1.02 (95% C.I. 0.96 to 1.09) in Seattle versus Connecticut.
Conclusion
Among men aged 65 or older, more intensive prostate cancer screening early in the PSA era and more intensive treatment particularly with radical prostatectomy over 15 years of follow-up were not associated with lower prostate cancer-specific mortality.
Key Words: prostate cancer, cancer screening, men’s health, outcomes, practice variation
INTRODUCTION
Following the introduction of the prostate-specific antigen (PSA) test in the United States in 1986 and its widespread use for screening, both prostate cancer incidence and mortality rose to peaks between 1991 and 1992. Through 2002, U.S. prostate cancer incidence has fallen but remains higher than before 1986, and mortality has dropped by about 25%.1 Whether early detection and subsequent attempted curative treatment of early-stage, screen-detected cancers with surgery or radiotherapy are primarily responsible for the fall in mortality has been uncertain.2–6 Alternative explanations, such as treatment improvements, including more widespread use of androgen deprivation therapy, have been advanced.7,8
To address this question, we have previously reported the results from two large prospective cohorts in the U.S., where men age 65 and older in the Seattle–Puget Sound area were exposed to substantially higher levels of PSA testing, prostate biopsy, radical prostatectomy, and radiotherapy in the early PSA era from 1987–1990 than men in Connecticut. Nonetheless, over 11 years of follow-up, through 1997, prostate cancer mortality rates among cohort members in the two areas were not significantly different, with a rate ratio of 1.03 (95% confidence interval 0.95 to 1.11).9
One possible limitation of the earlier report was insufficient follow-up, particularly for younger men with a life expectancy of at least ten years, usually considered optimal candidates for screening and attempted curative treatment.10 Another limitation was lack of information on androgen deprivation therapy. This report presents 15-year follow-up on the cumulative incidences of prostate cancer screening and treatment, including androgen deprivation, as well as rates of prostate cancer mortality.
METHODS
Human Subjects
The study was approved by the Institutional Review Boards of Partners Healthcare System and the participating institutions.
Eligibility Criteria
Men were eligible if they were Medicare beneficiaries age 65–79 without prostate cancer as of January 1, 1987, and resident within either SEER region from January 1, 1987 through December 31, 1990.
Measurement of Screening and Treatment Intensity
Claims for both PSA tests and prostate biopsies among men with both Part A and Part B Medicare coverage were used as measures of screening intensity. Current Procedural Terminology (CPT) codes used for identifying PSA tests and biopsies were provided previously.9 PSA tests and biopsies were excluded once an individual was diagnosed with prostate cancer (at least two prostate cancer diagnoses on different Medicare claims or evidence of radical prostatectomy or external beam radiotherapy for prostate cancer).
In the PSA era, screening increases prostate cancer incidence1; therefore, incidence was used as a secondary measure of screening intensity.
In our previous report, SEER data alone were used to document external beam radiotherapy within four months of diagnosis. In this update, both SEER data and Medicare claims were used to identify radical prostatectomy and radiotherapy through 2001 for men with prostate cancer. For the same time period, we used Medicare claims to identify orchiectomy (CPT codes 54520, 56318, or 54690 in outpatient claims or ICD-9 codes 62.4 or 62.41 in inpatient claims) and GnRH agonist therapy: 3.6 mg monthly goserelin (CPT code J9202) and 7.5 mg monthly leuprolide (CPT code J9217). A cohort member was defined as receiving androgen deprivation if he had claims for at least three doses of either leuprolide or goserelin, in any sequence, at least 25 days apart, or three or four doses billed on the same day, as that was the mechanism for reimbursement in the U.S. for longer-acting (3- and 4-month) preparations of these agents as they became available. Compared with medical records, this claims-based algorithm has 88.5% sensitivity and 91.1% specificity.11
Prostate Cancer Mortality
The primary end-point for this study was prostate cancer mortality for the two cohorts from 1987–2001, based on data from the SEER-Medicare file and the two registries.
Data Sources
The methods for this study have been published previously.9 Briefly, five data sources were used: Medicare denominator and vital status files, a SEER-Medicare Linked Database, local SEER Registry data, and the National Death Index (NDI). Medicare provides health insurance in the U.S. for people age 65 and older. The U.S. National Cancer Institute’s Surveillance, Epidemiology, and End Results (SEER) Program collects cancer incidence and survival data from numerous cancer registries, including the Seattle–Puget Sound area and Connecticut.
Denominator and vital status files were used to identify history of residence and date of death. The SEER-Medicare linked database provided screening and treatment information for cancers diagnosed in 1991–1999, with a 93% matching rate.12 Incidence and mortality data for 2000–2001 were obtained directly from the local registries. The SEER-Medicare linked files included data on PSA (1988–2001), prostate biopsy (1987–2001), radical prostatectomy (1987–2001), radiation (1987–2001), orchiectomy (1987–2001), and injections of gonadotropin-releasing hormone (GnRH) agonists (1991–2001) for men who had fee-for-service (FFS) Medicare coverage and were diagnosed with prostate cancer in 1987 through 2001. For men without prostate cancer, we had data on PSA and biopsy on a 5% sample of men from 1987–1990 and all men with FFS Medicare in 1991–2001. Because 100% Medicare claims for FFS beneficiaries were available from 1991, and 12 months of claims history was necessary to exclude pre-existing prostate cancer, in this report, to address whether differences in PSA and biopsy rates between the two regions attenuated over time, screening rates are reported for 1992–2001. Our original report provided PSA and biopsy rates from 1987–1990, our exposure period as defined a priori.9 For men who moved out of the study regions and subsequently died, a National Death Index search was conducted to identify cause of death.
Statistical Methods
Estimated rates of screening, treatment, and mortality were expressed as events per 100,000 person-years (PYRS). The number of men alive through the end of the year and half of the men who died or were lost to follow-up during the year were summed to compute the PYRS in each cohort annually. Poisson regression models were used to compute adjusted relative rates of screening, treatment and mortality.13 This method produces similar relative rate estimates to Cox regression,14 since the grouped one-year time intervals are short.15 SEER-Medicare linked data were obtained on all outcomes grouped by age (65–69, 70–74, 75–79 years), calendar year and registry area, so that all analyses used the age group-year-area stratum as the unit of analysis, weighted by the number in the stratum. All models controlled for age group, race, area, and calendar year. Follow-up was censored at year of death or 2001.
Subjects in the same age-group-year-SEER region stratum likely have similar screening exposures and treatments, so that mortality among these subjects might not be independent, leading to over-narrow confidence intervals around point estimates. To correct for these potential correlations, we clustered individuals within strata to incorporate variance overdispersion when necessary. There was evidence of clustering for PSA and biopsy rates, so these analyses incorporated the variance adjustment. For mortality rates, there was no evidence of clustering so we did not adjust the variance.13
Cumulative incidences of prostate cancer, radical prostatectomy, external beam radiotherapy and either surgical or medical androgen deprivation in the two regions were determined using life table methods.14 To show population-based prostate cancer mortality trends over time in the two regions, cross-sectional mortality rates are also presented, adjusted to the age of the study population in 1992. All statistical tests were performed at the 5% level and were two-sided.
RESULTS
Table 1 provides the age distributions for the 215,521 eligible men initially included in both cohorts, and the proportion of men still alive after 15 years, through 2001. About two thirds of the men in the study cohorts had died by this time. As evidence of the relatively long life expectancy of the men 65–69 at baseline in our cohort, about half were still alive after 15 years of follow-up, compared to about 30% of men age 70–74, and only about 15% of men age 75–79.
Table 1.
Original Age Distribution and Proportion of Men Alive through 2001 (15 Years of Follow-up)
| Seattle–Puget Sound | Connecticut | |||
|---|---|---|---|---|
| Age in 1987 | Original cohort | Alive through 2001, (%) | Original cohort | Alive through 2001, (%) |
| 65–69 | 43,249 (45.6%) | 21,089 (48.8%) | 53,310 (44.2%) | 25,293 (47.4%) |
| 70–74 | 31,544 (33.2%) | 9,767 (31.0%) | 41,167 (34.1%) | 12,413 (30.2%) |
| 75–59 | 20,107 (21.2%) | 3,230 (16.1%) | 26,144 (21.7%) | 4,072 (15.6%) |
| All | 94,900 (100%) | 34,086 (35.9%) | 120,621 (100%) | 41,778 (34.6%) |
We present the rates and rate ratios for PSA testing (Table 2) and prostate biopsy (Table 3) over the follow-up interval from 1992–2001, and the cumulative incidence of prostate cancer over the follow-up interval from 1987–2001, by region (Fig. 1). Although the Seattle–Puget Sound area continued to have a higher level of PSA testing after the “exposure window” of 1987–1990, we had defined a priori, the difference in biopsy rates during 1992–2001 was not statistically significant and as a result, the absolute difference in prostate cancer incidence changed only modestly after the initial exposure period. Over 15 years of follow-up, the cumulative risks of a prostate cancer diagnosis among men in the Seattle area cohort were 14.1%, 15.5%, and 15.8% for men age 65–69, 70–74, and 75–79 at baseline, respectively; in the Connecticut cohort the corresponding risks were 11.0%, 12.0%, and 12.1%. In our original paper, we reported the rate ratios in the Seattle area compared to Connecticut for PSA testing (5.39, 95% confidence interval 4.76 to 6.11), and prostate biopsy (2.20, 95% confidence interval 1.81 to 2.68), our primary measures of “screening intensity”, in 1987–1990.9
Table 2.
PSA Testing Rates and Rate Ratios (with 95% Confidence Intervals) for the Study Cohort by Age and Study Region, 1992–2001
| Seattle–Puget Sound | Connecticut | ||||
|---|---|---|---|---|---|
| Age in 1987 | PSA/Person-years | Rate per 100 | PSA/Person-years | Rate per 100 | Rate Ratio Seattle/Connecticut |
| 65–69 | 66,485/171,992 | 38.7 | 73,839/253,894 | 28.7 | 1.35 (1.33 – 1.36) |
| 70–74 | 36,989/103,610 | 35.7 | 44,462/166,195 | 26.8 | 1.33 (1.32 – 1.35) |
| 75–79 | 15,384/50,271 | 30.6 | 17,995/80,458 | 22.4 | 1.37 (1.34 – 1.40) |
| All | 11,858/325,873 | 36.5 | 136,296/500,547 | 27.2 | 1.35 (1.34 – 1.36) |
All prostate-specific antigen tests in the years prior to prostate cancer diagnosis and one PSA test in the year of cancer diagnosis were included in the analysis. PSA tests after the year of cancer diagnosis were excluded. An individual was considered have prostate cancer if there were at least two prostate cancer diagnoses on different Medicare claims or evidence of radical prostatectomy or external beam radiation for prostate cancer. Because Medicare claims were available for all cohort members from 1991, and a period of 12 months of claims history was necessary to exclude pre-existing prostate cancer, in this report PSA rates are reported for 1992–2001
Table 3.
Prostate Biopsy Rates and Rate Ratios by Age and Study Region, 1992–2001
| Seattle–Puget Sound | Connecticut | ||||
|---|---|---|---|---|---|
| Age in 1987 | Biopsies/Person-years | Rate per 100 | Biopsies/Person-years | Rate per 100 | Rate Ratio Seattle/Connecticut |
| 65–69 | 3,722/171,992 | 2.19 | 5,633/253,894 | 2.22 | 0.99 (0.95 – 1.03) |
| 70–74 | 1,886/103,610 | 1.82 | 3,137/166,195 | 1.89 | 0.96 (0.91 – 1.02) |
| 75–79 | 690/50,271 | 1.37 | 1,079/80,458 | 1.34 | 1.02 (0.93 – 1.13) |
| All | 6,298/325,873 | 1.93 | 9,849/500,547 | 1.97 | 0.98 (0.95 – 1.02) |
All prostate biopsies in the years prior to prostate cancer diagnosis and in the year of cancer diagnosis were included in the analysis. Biopsies after the year of cancer diagnosis were excluded. An individual was considered have prostate cancer if there were at least two prostate cancer diagnoses on different Medicare claims or evidence of radical prostatectomy or external beam radiation for prostate cancer. Because Medicare claims for all cohort members were available from 1991, and a period of 12 months of claims history was necessary to exclude pre-existing prostate cancer, in this report biopsy rates are reported for 1992–2001
Fig. 1.
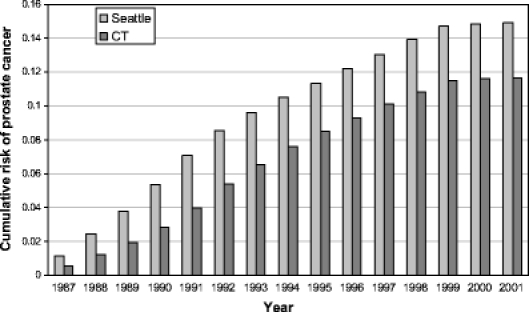
Cumulative incidence of prostate cancer by study region.
We also present the rates and rate ratios for radical prostatectomy and external beam radiotherapy over the entire study period from 1987–2001 (Table 4). Men in the Seattle–Puget Sound region continued to be more likely to have radical prostatectomy or external beam radiotherapy than their counterparts in Connecticut, especially among older men; however, over the entire follow-up interval, the difference was statistically significant only for radical prostatectomy. While the cumulative risks of radical prostatectomy were higher for younger men, as would be expected, the rate ratios comparing radical prostatectomy in the Seattle area versus Connecticut increased with age, with a point estimate of 4.4-fold higher for men age 65–69 at baseline, 7.3-fold higher for men age 70–74 at baseline, and 15.4-fold higher for men age 75–79 at baseline. On the other hand, men in the Seattle area had a modest but significantly lower rate ratio for receiving androgen deprivation therapy compared to men in Connecticut that was not dependent on age (Table 4). In our previous paper we reported the rate ratios in the Seattle area compared to Connecticut for radical prostatectomy (5.9, 95% confidence interval 5.0 to 6.0) and external beam radiotherapy (2.3, 95% confidence interval 2.2 to 2.5), our primary measures of “treatment intensity,” from 1987–1990.9
Table 4.
Cumulative Risks and Rate Ratios (with 95% Confidence Intervals) for Radical Prostatectomy and External Beam Radiation, 1987–2001, and Androgen Deprivation Therapy 1991–2001, by Age and Study Region
| Age in 1987 | Cumulative risk Seattle–Puget Sound | Cumulative risk Connecticut | Rate Ratio Seattle/Connecticut |
|---|---|---|---|
| Radical Prostatectomy | |||
| 65–69 | 3.93% | 0.91% | 4.40 (2.06 – 9.44) |
| 70–74 | 2.31% | 0.33% | 7.29 (2.64 – 20.09) |
| 75–79 | 0.74% | 0.05% | 15.36 (3.91 – 60.30) |
| All ages | 2.84% | 0.56% | 5.20 (3.22 – 8.42) |
| External beam radiation | |||
| 65–69 | 6.22% | 5.86% | 1.08 (0.72 – 1.61) |
| 70–74 | 6.06% | 4.77% | 1.37 (0.89 – 2.10) |
| 75–79 | 4.69% | 2.93% | 1.75 (1.18 – 2.60) |
| All ages | 6.02% | 5.07% | 1.24 (0.98 – 1.58) |
| Androgen deprivation therapy | |||
| 65–69 | 4.05% | 5.50% | 0.73 (0.58 – 0.91) |
| 70–74 | 5.36% | 6.62% | 0.78 (0.64 – 0.94) |
| 75–79 | 5.96% | 6.82% | 0.84 (0.64 – 1.09) |
| All ages | 4.78% | 6.13% | 0.77 (0.67 – 0.87) |
There was no significant difference in prostate cancer mortality between the Seattle area and Connecticut cohorts over the 15 years of follow-up (rate ratio = 1.02; 95% C.I. 0.96–1.09). Moreover, no significant differences were seen for any age stratum (Table 5). There was a somewhat higher prostate cancer mortality in the Seattle area compared to Connecticut for men age 75–79 at baseline, which did not reach statistical significance.
Table 5.
Prostate Cancer-specific Mortality Rates and Rate Ratios (with 95% Confidence Intervals) by Age and Study Region, 1987–2001
| Seattle–Puget Sound | Connecticut | ||||
|---|---|---|---|---|---|
| Age in 1987 | Deaths /Person-years | Rate/100,000 | Deaths /Person-years | Rate/100,000 | Rate Ratio Seattle/Connecticut (95% CI) |
| 65–69 | 598/494,717 | 120.9 | 751/599,239 | 125.3 | 0.97 (0.88 – 1.09) |
| 70–74 | 609/312,071 | 195.1 | 786/400,810 | 196.1 | 1.00 (0.90 – 1.11) |
| 75–79 | 467/164218 | 284.4 | 531/208412 | 254.8 | 1.12 (0.99 – 1.27) |
| Total | 1674/971006 | 172.4 | 2068/1208461 | 171.1 | 1.02 (0.96 – 1.09) |
Figure 2 displays cross-sectional prostate cancer mortality for men age 65–79 from 1987–2001, documenting similar decreases in disease-specific mortality in both study regions despite the variations in screening and treatment patterns.
Fig. 2.
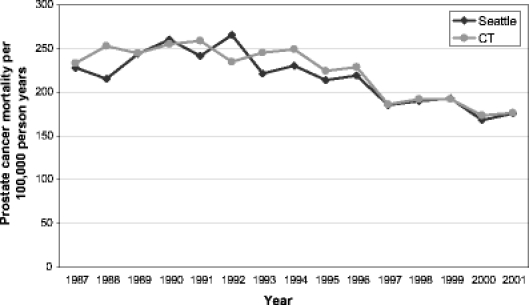
Age adjusted prostate cancer mortality per 100,000 person-years for men in the Seattle–Puget Sound region and Connecticut on the basis of cross-sectional data, 1987-2001, adjusted to the age composition of the entire study cohort: 48.3% aged 70-74, 33.3% aged 75-79, 18.4% aged 80-84 as of 1 January 1992. (US data by SEER region, age, and race provided by LAG Ries, Cancer Statistics Branch, National Cancer Institute).
DISCUSSION
Given the greater intensity of screening early in the PSA era, and the resultant higher cumulative incidence of a prostate cancer diagnosis and attempted curative treatment particularly with radical prostatectomy among cohort members in the Seattle–Puget Sound area than in Connecticut over the entire 15 years of follow-up, a lower prostate cancer mortality in the Seattle region might have been expected over time if these interventions were effective. However, no significant difference in prostate cancer mortality was found over 15 years, and the 95% confidence interval around the rate ratio is inconsistent with more than a 4% reduction in prostate cancer mortality in the Seattle area compared to Connecticut. Interestingly, the overall drop in prostate cancer mortality has been similar in the two regions (Fig. 2). These results suggest that the higher intensity of screening and treatment with radiotherapy or surgery in the Seattle area compared to Connecticut early in the PSA era did not translate into any further reduction in prostate cancer mortality for men over age 65.
The subgroups in our cohorts age 65–69 at baseline are of particular interest, as these men had life expectancies above ten years during the early PSA era, and might be hypothesized to have been most likely to have benefited from more aggressive screening and treatment. During the exposure window of 1988–1990, men in this age group in the Seattle area cohort were about 5.6 times as likely to have a PSA test and 2.2 times more likely to undergo a prostate biopsy than men in the Connecticut cohort;9 while over the entire follow-up period, they were 4.4 times as likely to have a radical prostatectomy and equally likely to have undergone radiation therapy. Nevertheless, they did not have a significantly lower prostate cancer mortality risk over the next 15 years.
How much of an impact on population-based prostate cancer mortality might have been expected from the difference in the use of radical prostatectomy or external beam radiotherapy among these younger men? Based on the observed treatment patterns in the two study cohorts, for the youngest men age 65–69 in 1987, about 961 fewer radical prostatectomies or courses of radiotherapy were observed in the Connecticut cohort. If just 10% of these 961 men were destined to die of prostate cancer without treatment and instead died of other causes, then the population-based prostate cancer mortality rate in Connecticut would have increased from about 125 to 141/100,000 and the difference would have reached statistical significance for this subgroup.
The subgroups of men age 75–79 at baseline are also important to consider, as these men had less than a ten-year life expectancy at baseline, and as a result, are not being included in current screening trials. During the exposure window of 1988–1990, men this age in the Seattle area cohort were about 5.2 times as likely to have a PSA test and 1.7 times more likely to undergo a prostate biopsy than men in the Connecticut cohort;9 while over the entire follow-up period, they were 15 times as likely to have a radical prostatectomy and 1.8 times as likely to have undergone radiation therapy. Nevertheless, they did not have a significantly lower risk of prostate cancer mortality over the next 15 years.
Our findings are consistent with a case-control study carried out at ten Veterans Affairs medical centers. In that study, PSA screening was not significantly associated with lower all-cause or cause-specific mortality.16 Our results are also in accord with an ecological analysis that did not show a statistically significant relationship between the prevalence of PSA testing and percentage declines in prostate cancer mortality across all SEER areas.5
Our findings conflict with a report from Tyrol, Austria, where widespread provision of free PSA screening was reported to have resulted in lower prostate cancer mortality in Tyrol versus the rest of Austria.17 It is difficult to compare the two studies, as the frequency of PSA testing, biopsy, and attempted curative treatment have not yet been reported from Tyrol. Our findings also conflict with a recent study that described lower overall survival among older men with low-risk and intermediate-risk prostate cancer managed with observation compared to active treatment.18 However, most of the differences in overall survival occurred in the first five years of follow-up, and only a small percentage of deaths were attributable to prostate cancer, which strongly suggests residual confounding by comorbidity.
Because our cohorts only included men aged 65 and over, the results may not be applicable to younger men. However, our study findings are highly relevant to the screening debate as the majority of men are diagnosed with prostate cancer after age 65. Another limitation of our study is the lack of data on men enrolled in Health Maintenance Organizations (HMOs). During 1987–1990, about 20% of the Seattle cohort and 10% of the CT cohort were HMO members. Based on SEER data, we had previously confirmed that older men in the Seattle area had substantially higher prostate cancer incidence and radical prostatectomy rates than men in Connecticut.19 In a sensitivity analysis excluding HMO enrollees from both cohorts, no significant difference in prostate cancer mortality emerged.
A study by Newschaffer and colleagues suggested that clinicians may be more likely to code deaths due to prostate cancer among men not receiving attempted curative therapy.20 If this coding bias exists, then prostate cancer mortality in the Seattle area cohort, where men were more likely to have attempted curative procedures, should have appeared lower.
The most striking difference between our two cohorts was that the rate of radical prostatectomy was substantially higher in the Seattle area. Currently only radical prostatectomy has been shown to be an effective treatment for localized prostate cancer in a randomized trial; however, radical prostatectomy had little effect for men aged 65 or older in that study, and few of the men in that trial were detected by PSA screening.21
Ultimately, several large randomized trials of PSA screening now underway will determine whether such screening reduces overall or disease-specific mortality. Population-based studies such as ours (as well as rigorous cohort or case-control studies) that are focused on the effectiveness of interventions in the community may provide insights that will be complementary to the results of these clinical trials, particularly for men age 75 and older who have been excluded from the trials. Our results suggest that it is inappropriate to assume that more intensive efforts at PSA screening and attempted curative treatment such as practiced in the Seattle area compared to the state of Connecticut early in the PSA era further reduced prostate cancer mortality for men age 65 and older. Until results of randomized trials become available, shared decision-making regarding PSA screening should continue between clinicians and patients. It remains unclear whether PSA screening is primarily responsible for the decline in prostate cancer-specific mortality that has been observed among older men in the United States.
Acknowledgement
This research was funded by grants from the Agency for Health Care Research and Quality (HS 08397, HS 10278).
Conflict of Interest Statement None disclosed.
References
- 1.Ries L, Harkins D, Krapcho M, et al. SEER Cancer Statistics Review, 1975–2003. Bethesda, MD: National Cancer Institute; ; 2006.
- 2.Hankey B, Feuer E, Clegg L, et al. Cancer surveillance series: Interpreting trends in prostate cancer - Part I: Evidence of the effects of screening in recent prostate cancer incidence, mortality, and survival rates. J Natl Cancer Inst. 1999;91:1017–24. [DOI] [PubMed]
- 3.Feuer E, Merrill R, Hankey B. Cancer surveillance series: Interpreting trends in prostate cancer - Part II: Cause of death misclassification and the recent rise and fall in prostate cancer mortality. J Natl Cancer Inst. 1999;91:1025–32. [DOI] [PubMed]
- 4.Etzioni R, Penson DF, Legler JM, et al. Overdiagnosis due to prostate-specific antigen screening: lessons from U.S. prostate cancer incidence trends. J Natl Cancer Inst. 2002;94:981–90. [DOI] [PubMed]
- 5.Shaw P, Etzioni R, Zeliadt S, et al. An ecologic study of prostate-specific antigen screening and prostate cancer mortality in nine geographic areas of the United States. Am J Epidemiol. 2004;160:1059–69. [DOI] [PubMed]
- 6.Potosky A, Feuer E, Levin D. Impact of screening on incidence and mortality of prostate cancer in the United States. Epidemiologic Reviews. 2001;23:181–6. [DOI] [PubMed]
- 7.Albertsen P. The prostate cancer conundrum. J Natl Cancer Inst. 2003;95:930–1. [DOI] [PubMed]
- 8.Damber J. Decreasing mortality rates for prostate cancer: possible role of hormonal therapy. BJU International. 2004;93:695–701. [DOI] [PubMed]
- 9.Lu-Yao G, Albertsen PC, Stanford JL, Stukel TA, Walker-Corkery ES, Barry MJ. Natural experiment examining impact of aggressive screening and treatment on prostate cancer mortality in two fixed cohorts from Seattle area and Connecticut. BMJ. 2002;325:740–5. [DOI] [PMC free article] [PubMed]
- 10.Smith R, Cokkinides V, Eyre H. American Cancer Society guidelines for the early detection of cancer, 2006. CA Cancer J Clin. 2006;56:11–25. [DOI] [PubMed]
- 11.Oleynick JU, Albertsen PC, Barry MJ, Walker-Corkery ES, Yao SL, Lu-Yao GL. Utility of the SEER-Medicare data to identify medical androgen deprivation therapy. J Clin Onc. 2006;24:6113.
- 12.Warren JL, Klabunde CN, Schrag D, Bach PB, Riley GF. Overview of the SEER-Medicare data: content, research applications, and generalizability to the United States elderly population. Medical Care. 2002;40:IV–3–18. [DOI] [PubMed]
- 13.McCullagh P, Nelder J. Generalized Linear Models. London: Chapman and Hall; 1989.
- 14.Cox DR. Regression models and life-tables. Journal of the Royal Statistical Society, Series B, Methodological. 1972;34:187–220.
- 15.D’Agostino R, Lee M, Belanger A. Relation of pooled logistic regression to time dependent Cox regression analysis: the Framingham Heart Study. Statistics in Medicine. 1990;9:1501–15. [DOI] [PubMed]
- 16.Concato J, Wells CK, Horwitz RI, et al. The Effectiveness of screening for prostate cancer: A nested case-control study. Arch Intern Med. 2006;166:38–43. [DOI] [PubMed]
- 17.Oberaigner W, Horninger W, Klocker H, Schonitzer D, Stuhlinger W, Bartsch G. Reduction of prostate cancer mortality in Tyrol, Austria, after introduction of prostate-specific antigen testing. Am J Epidemiol. 2006;164:376–84. [DOI] [PubMed]
- 18.Wong Y, Mitra N, Hudes G, et al. Survival associated with treatment vs observation of localized prostate cancer in elderly men. JAMA. 2006;296:2683–93. [DOI] [PubMed]
- 19.Lu-Yao G, Greenberg ER. Changes in prostate cancer incidence and treatment in the USA. Lancet. 1994;343:251–4. [DOI] [PubMed]
- 20.Newschaffer CJ, Otani K, McDonald MK, Penberthy LT. Causes of death in elderly prostate cancer patients and in a comparison nonprostate cancer cohort. J Natl Cancer Inst. 2000;92:613–. [DOI] [PubMed]
- 21.Bill-Axelson A, Holmberg L, Ruutu M, et al. Radical prostatectomy versus watchful waiting in early prostate cancer. N Engl J Med. 2005;352:1977–84. [DOI] [PubMed]